• 검색 결과가 없습니다.

A Study on User Willingness of Intelligent Music Platform Based on TAM Model

N/A
N/A
Protected

Academic year: 2021

Share "A Study on User Willingness of Intelligent Music Platform Based on TAM Model"

Copied!
8
0
0

로드 중.... (전체 텍스트 보기)

전체 글

(1)

JKSCI

A Study on User Willingness of Intelligent Music Platform Based on TAM Model

1)

Jingrong Li*

*Lecturer, Dept. of Instrumental Music, Music Conservatory, Anshan Normal University, Anshan, China

[Abstract]

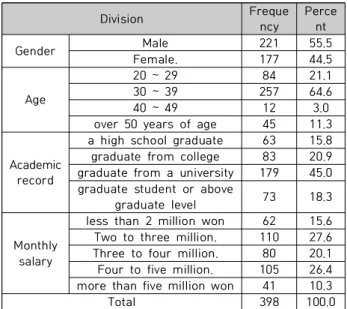
In this paper, we propose to study the factors affecting the user's intention to use smart music platform, and on the basis of studying the impact of service quality on the user's intention to use, such as perceived usability, perceived ease, perceived entertainment and perceived cost, respectively. Based on this, the impact factors model on the usage intention of smart music platform users was presented, and 398 questionnaires were collected through a survey of university students majoring in Chinese music, and the collected data were obtained by conducting frequency analysis, reliability analysis, exploratory factor analysis, correlation analysis, and structural equation model analysis using spss20.0 and amos20.0.

The results show that: Quality of service has a positive effect on perceived usefulness, perceived ease of use, perceived entertainment and perceived cost. A study found that perceived usefulness, perceived ease of use, and perceived entertainment have a positive effect on users' intention of use and perceived cost has a negative effect on their intention of use. Through this conclusion, the entrepreneur presented an important meaning in promoting sustainable development of smart music platforms by improving the operation and profit model of smart music platforms.

▸Key words: Intelligence Music, purchase intention, TAM models, perceived entertainment, perceived cost

[요 약]

본 연구를 통해 스마트 음악 플랫폼 사용자의 사용의도에 미치는 영향 요인으로 지각된 유용 성 , 지각된 용이성, 지각된 오락성, 지각된 원가 등 서비스 품질의 역할을 연구하고자 한다. 이를 바탕으로 스마트 음악 플랫폼 사용자의 사용의도에 영향을 미치는 과정을 제시하고, 중국 음악

전공 대학생들을 대상으로 400부의 설문지를 배부하여 398부를 수집하였고, 수집된 데이터는

SPSS 20.0와 AMOS 20.0을 이용하여 빈도분석, 신뢰도 분석, 탐색적 요인 분석, 확인적 요인분석,

상관관계분석 , 구조방정식 모형 분석을 실시하여 결과를 도출하였다.

연구결과는 다음과 같다 . 서비스 품질은 지각된 유용성, 지각된 용이성, 지각된 오락성, 지각된 원가에 긍정적인 영향을 미친다 . 지각된 유용성, 지각된 용이성, 지각된 오락성이 이용자의 사용 의도에 긍정적인 영향을 미치고 지각된 원가는 사용의도에 부정적인 영향을 미친다는 연구결과를

도출하였다 . 이러한 결론을 통해 기업가가 스마트 음악 플랫폼의 운영과 수익시스템을 개선하여

스마트 음악 플랫폼의 지속 가능한 발전을 도모하는 데 중요한 의미를 제시하였다 .

▸주제어: 스마트 음악 플랫폼, TAM 모델, 사용의도, 지각된 오락성, 지각된 원가

∙First Author: Jingrong Li, Corresponding Author: Jingrong Li

*Jingrong Li ([email protected]), Dept. of Instrumental Music, Music Conservatory, Anshan Normal University

∙Received: 2020. 09. 03, Revised: 2020. 09. 29, Accepted: 2020. 10. 06.

Copyright ⓒ 2020 The Korea Society of Computer and Information http://www.ksci.re.kr pISSN:1598-849X | eISSN:2383-9945

(2)

I. Introduction

China Internet Network Information Center released the 45th China Internet Network Development Statistics report, saying that as of March 2020, China's Internet users have reached 904 million, Among them, the size of mobile network users is 897 million, 99.3% of total Internet users, Network music users reach 635 million, 70.3% of all Internet users, Mobile network music users reach 633 million, Up 79.78 million from the end of 18, 70.5% of mobile phone users, The huge scale of Internet users has laid the user foundation for the development of online music. 2019, The quality of Internet entertainment applications is constantly improving, Early 2020, Affected by the new coronary pneumonia, Network entertainment application user size and utilization rate have been greatly improved. By March 2020, The number of users of online video, music and games is 850 million ,635 million and 532 million, The utilization rates were 94.1 per cent ,70.3 per cent and 58.9 per cent, respectively, To become an important part of the people's online spiritual and cultural life [1] .

The steady growth of China's music industry in recent years has become an important force to stimulate China's pan-entertainment consumer economy. The rapid development of artificial intelligence has brought great innovation to the music creation mode, streaming media digital music dissemination, music education and training, and the upgrading of music technology equipment such as audio equipment and musical instrument manufacturing [2] . Artificial intelligence has penetrated into all aspects of the music industry chain. The emergence of artificial intelligence first explored the music creation model itself, which constructed the core power of the whole music industry, and had a certain impact on the horizontal and vertical industrial chain and different levels of Chinese music. Intelligent music platform is also gradually rising. For example, shrimp music began to increase the pace of research and development of

AI intelligent recommendation function in 2017.

Based on artificial intelligence algorithm, intelligent recommendation function can comprehensively analyze the user's mood and recommend suitable music to the customer according to the user's scene. You can also capture user preferences based on data to increase interactivity. At the NetEase year-end song report that ignited the circle of friends in the 2019 New year [3] , the application of H5 products is undoubtedly the power of artificial intelligence big data. The accuracy of these big data and the degree of understanding of users' music preferences and habits even surpass the users themselves, and become the central nervous system that moves users, drives marketing, and reaps users. Personalized music recommendation also promotes users' awareness of music payment, promotes online and offline music consumption, and further deepens the development of Chinese music industry [4] .

With the rapid development of music industry, how to make the online music platform use the existing resources to attract users is the most important part of the platform operation. Through exploring the key factors and the relationship between the user's willingness to use the intelligent music platform, this paper puts forward some strategies and suggestions to improve the user's willingness to use the intelligent music platform.

II. Theoretical literature

1. Assumptions about perceived usefulness and perceived ease of use

Perceived Usefulness (Davis 1989) refers to the

degree of influence of user individual subjective

perception of external information technology on

job performance [5] . The perceived usefulness in this

paper refers to the degree to which users feel the

use of intelligent music platform to improve job

performance, that is, the value of life and work

brought by the use of intelligent music platform [6] .

(3)

If users think that using intelligent music platform will help their studies and work, they will change their attitude towards the platform and enhance their willingness to use it. At present, many studies have proved that perceived usefulness has a significant impact on users' willingness to use.

Perceived Ease of Use (Davis 1989) refers to the degree of difficulty that individuals subjectively believe in the use of an information technology [7] . The perceived ease of use in this paper refers to the user's perception of the degree of effort required to use the online music platform, that is, whether the user thinks that the intelligent music platform is easy to use. Based on this, the following assumptions are put forward:

H1: The perceived usefulness is affecting consumers' willingness to use.

H2: The perceived ease of use is affecting consumers' willingness to use.

2. Perceived entertainment hypothesis

Perceived entertainment refers to the subjective happiness of users in the process of using intelligent music platform [8] . Moon et al .(2001) proved that perceptual entertainment has a significant effect on users' willingness to accept the use of new information technology [9] , Liu Hong (2013) confirmed that perceived entertainment has a positive and positive effect on users' willingness to use video sites [10] . Based on this, the following assumptions are put forward:

H3: The Perceived entertainment is affecting consumer' willingness to use.

3. Perceived cost-related assumptions

When the user perceives the cost to pay more, it will actively reduce the use of the platform, that is, the perceived cost will negatively affect the user's willingness to use continuously [11] . Yu Yue et al (2018) studied the purchase intention of college students on the basis of perceived value theory.

The results show that the monetary cost dimension in perceived cost is the primary factor affecting college students' online purchase intention. The

perceived cost in this paper refers to the cost that users think they should bear in the process of using intelligent music platform [12] . Based on this, the following assumptions are made:

H4: The perceived cost is affecting consumers' willingness to use.

4. Perceived Quality of Service Related Assumptions

Perceptual service quality refers to the perception and evaluation of the service provided by the operator of the intelligent music platform.

When the customer service personnel of the platform can give timely help and solution to the problems or feedback raised by the user [13] , it will enable the user to use the platform more smoothly, thus reducing the user's efforts to use the perceived cost of using the platform. It makes it easier for users to use smart music platforms [14] . High-quality services require significant cost, which will be passed on to users. Ming Yang et al .(2017) put forward that the quality of service positively affects the perceived usefulness of users to the system. Guo Wenqian (2017) proved that the quality of service has a positive effect on the perceived usefulness and entertainment of online English course platform users [15] . Based on this, the following assumptions are made:

H5: Perceived Quality of Service is affecting consumers' perceived usefulness.

H6: Perceived Quality of Service is affecting consumers' perceived ease of use.

H7: Perceived Quality of Service is affecting consumers' perceived entertainment

H8: Perceived Quality of Service is affecting consumers' perceived cost.

III. research method

1. Research Model

Based on the above analysis, this paper

constructs the research model.

(4)

Fig. 1. Research model

2. Operational Definition and Measurement Scale of Variables

Variable Definition Reference

Literature Perceived

usefulness

Reflect the extent to which a person considers the use

of a specific system to

improve his performance. Venkatesh &

Davis(2000),

Heijden(2003) Perceived

Ease of Use

Reflect the extent to which a person considers it easy to use a specific system.

Perceived Entertain

ment

Objective feelings of an individual when performing

an act or participating in an activity.

Moon & 

Kim(2001)

Perceived Costs

Possible economic losses during the use of the

system.

Ho Cheong

& Park 2005 Perceived

Quality of Service

Results of user evaluation and comparison of actual

and expected service experience.

Parasuraman A、Zeithaml

、Berry (1988) Willingness

to Use

Intention to use refers to the psychological tendency

of using behavior.

Panpan Sun(2016) Table 1. Operational Definition and Measurement Scale of Variables

IV. Analysis Result

1. Demographic Characteristics of The Sample From the general characteristics to see of the study, men accounted for 221(55.5 %), in response the name 398, women account for 177(44.5 %). Ratio of men than women. In addition, for 257 for the most - year-old respondent, (64.9 %).This was followed by 20 - year-old (21.2 %) at the age of 84.20 - year-old respondent from the age of 84 (21.1

%). Answer to the more than 50 years old with the lowest rate of response has 45(11.3%).Graduated

Division Freque

ncy

Perce nt

Gender Male 221 55.5

Female. 177 44.5

Age

20 ~ 29 84 21.1

30 ~ 39 257 64.6

40 ~ 49 12 3.0

over 50 years of age 45 11.3

Academic record

a high school graduate 63 15.8 graduate from college 83 20.9 graduate from a university 179 45.0 graduate student or above

graduate level 73 18.3

Monthly salary

less than 2 million won 62 15.6 Two to three million. 110 27.6 Three to four million. 80 20.1 Four to five million. 105 26.4 more than five million won 41 10.3

Total 398 100.0

Table 2. Demographic Characteristics of the Sample

from college, most respondents in the academic investigation, for 179 (45 %). This was followed by specialist graduates, 83 73 more than a graduate student, (20.9 %) (18.3 %).Answer the high school graduates with the lowest rate of 63 (15.8 %).The results showed that monthly salary survey, up to the Korean won the response of a further 110 people (27.6%), the highest ratio. This was followed by 105 (26.4%) 400~500 million. This was followed by 300~400 (20.1%). 80 million Answer the more than 5 million Korean won with the lowest rate of respondent(10.3%) with 41.

2. Exploratory Factor Analysis and Reliability Analysis

2.1 Exploratory Factor Analysis and Reliability Analysis of exogenous variables

The exploratory factor analysis was first

performed to see if the various measuring tools

used in this study were consistent with the intent of

this study. In order to minimize the number of

factors, prevent information loss to the maximum

extent and eliminate variables that impede the

properness of measurement, this paper implements

the princlusion compendium analysis and further

clarifies the classification of the variables. The

criteria for evaluation of factor extraction are

above EignValue and above 0.5.In addition, to

(5)

ensure reliability of the measured variables, the coefficient of Cronbach's Alpha coefficient, which represents the internal character, was determined.

It is generally considered that holding a price above 0.6 is more reliable and that holding a price above 0.7 is higher.

The results show that all factors are extracted above 0.5 and that the Cronbach's Alpha coefficient is above 0.7 for the general allowable value, in the reliability analysis of the test item.

2.2 Confirmatory Factor Analysis

In order to verify the convergence and discriminant appropriateness of measurement variables, the deterministic element analysis was carried out. The suitability of the measurement model is X²=824.991, P=.000, DP=1944, CMIN/DF= 4.253, GFI=.799, NFI=.897, IFI=.919, CFI=.919, RM=.433. The suitability of the measurement model is acceptable. In addition, the measurement model X²(df) = shown in 824.991 (1944) and suggested that X²/d.f. be priced below 5(large number of specimens), so the survey model used in this study is well fitted.

Compositional concept

Estim

ate S.E. C.R. AVE CR

Perceived quality of service

0.728 0.852 0.752 0.821

0.061 0.065 0.069

17.805 15.549

17.086 0.545 0.867 Willingness

to use

0.967 0.646 0.633

0.049 0.047

15.377

14.924 0.556 0.885 Perceived

costs

0.879 0.911 0.759

0.042 0.048

25.189

18.5 0.635 0.857

Perceived entertainment

0.863 0.88 0.889 0.867

0.043 0.042 0.043

24.661 25.197 23.958

0.642 0.902

perceived ease of use

0.783 0.902 0.719 0.811

0.067 0.085 0.068

18.879 14.837 17.094

0.541 0.896

perceived usefulness

0.871 0.887 0.899 0.896

0.047 0.047 0.042

24.608 25.246 25.085

0.554 0.857

X2=824.991, P=.000, DF=194, CMIN/DF=4.253, GFI=.846, AGFI=.799, NFI=.897, ,IFI=.919, CFI=.919, RMR=.043 Table 3. Confirmatory Factor Analysis

In addition, the correlation coefficient between each variable is statistically significant, and both Estimate and S.E. of the validation factor analysis show statistical significance and confirm the rationality of convergence. CR was also evaluated through Amos. All projects exceed the generally allowed 0.6 and the results are trustworthy.

Contingency, on the other hand, has other determination values-AVE, which is the size of the dispersion that an indicator can account for a potential concept, which is more than 0.5.The AVE values for all factors in this study are above 0.5 and ensure convergence rationality.

3. Research Hypothesis Verification

Structural model analysis was used to verify the hypothesis. To verify the hypothesis, the path coefficients for the structural model can be found in

<Table 4>.The suitability index for the structural model used in this study is X² = 862.849, P = .000, DP = 201, CMIN/DF = 4.293, GFI = .838, AGFI = .796, IFI = .896, IFI = .915, CFI = .88, RMR=0.499.The suitability of the structural model in this study is not a problem and can be assessed as an acceptable level.

Avenue Estim

ate S.E. C.R. P

Perception quality of service --> Perception

usefulness 0.439 0.414 7.795 ***

Perception quality of service --> Sensory ease

of use

0.291 0.28 5.143 ***

Perception Service Quality --> Perception

Entertainment 1.052 1.018 17.902 ***

Perception Service Quality

-> Perception Cost 1.095 0.831 15.152 ***

perceived usefulness-->Willingness

to use

0.088 0.077 2.575 0.01 perceived ease of

use-->Willingness to use 0.087 0.074 2.561 0.01 Perceived

entertainment-->Willingn ess to use

0.766 0.649 10.324 ***

Perceived

costs-->Willingness to use -0.208 -0.225 -3.821 ***

X²=862.849,P=.000, DF=201,CMIN/DF

=4.293,GFI=.838,AGFI=.796,NFI=.892,

IFI=.915,CFI=.838, RMR=.049

Table 4. Structural model analysis result

(6)

H1. The effect of perceived service quality on perceived usefulness, as observed in Table 6 , on perceived usefulness is 0.439.These results are statistically significant at a limited level of 0.05 (C.R

= 7.795, p < 0.05). Therefore, H1 is verified as expected.

H2a. The effect of perceived service quality on perceived ease of use as observed in Table 6 is 0.291.The results of such a study were statistically meaningless at the level noted in 0.05 (C.R = 5.143, p < 0.05).Therefore, H2 is verified as expected.

H2b. Regarding the effect of perceived service quality on perceived entertainment, as observed in

<Table 6>, the effect of perceived service quality on perceived entertainment is 1.052.The results of such a study were statistically meaningless at the level noted in 0.05 (C.R = 17.902, p <

0.05).Therefore, H3 is verified as expected.

H3a. Regarding the effect of perceived service quality on perceived cost, as observed in Table 6 , the effect of perceived service quality on perceived cost is 1.095.Such research results were statistically significant at a limited level of 0.05 (C.R = 15.152, p

< 0.05). Therefore, H4 is verified as expected.

H3b. Concerning the useful on the use will affect, for influence, useful on the use of will observed as

<Table 6> 0.088.The results of such studies is statistically meaningful results, under the limited level of 0.05 (p<0.05, C.R=2.575). H 5, therefore, as expected receive verification.

H4a. The effect of ease of use on willingness to use is 0.087 as observed in Table 6 .These results are not statistically significant at a limited level of 0.05 (C.R = 2.561 , p < 0.05). Therefore, H6 is verified as expected.

H4b. Regarding the effect of perceived entertainment on willingness to use, as observed in Table 6 , the effect of perceived entertainment on willingness to use is 0.7666.These results are not statistically significant at a limited level of 0.05 (C.R

= 10.324, p < 0.05). Therefore, H7 is verified as expected.

H5a. Assume 10. The effect of perceived costs on willingness to use, as observed in Table 6 , on perceived costs, is -0.208.These results are statistically significant at a limited level of 0.05 (C.R

= - 3.821, p < 0.05). Therefore, H8 is verified as expected.

V. Conclusions

1. Conclusions

The following important conclusions are drawn from empirical research.

1. Perceived usefulness, perceived ease of use, perceived entertainment have a positive impact on the user's willingness to use; When users feel that the use of intelligent music platform has brought great help to their own studies and work, and the platform is easier to use, it will also produce positive emotions when used. It also produces positive attitude and behavior intention. Therefore, companies need to focus on the ease of use and entertainment of their products while designing and developing music apps, which will increase users' willingness to use them.

2. High quality service improves users' willingness to use. The high-quality service provided by platform operators will make it easier for users to use the smart music platform, which in turn will increase their users' willingness to use it

3. Perceived cost has a negative impact on the user's willingness to use. When users considers that a higher fee is required in the use of a smart music platform, it reduces the user's willingness to use the platform and proactively reduces the use of the platform.

2. Practical Revelations

the following suggestions are put forward for the development of online music platform:

1. Upgrade Platform service content. On the

basis of meeting the needs of users, the online

(7)

intelligent music platform should introduce differentiated products, services and user experiences to provide consumers with the information they need to make them feel the convenience and benefits.

2. Focus on the quality of service of the Platform. The empirical research proves that the service quality has an important influence on the user's willingness to use, that is, to build an intelligent music platform with high service quality, which can improve the user's willingness to use.

3. Improved pricing strategies, subdividing user types. Enriching the pricing model, increasing the service content of the intelligent music platform as much as possible, and improving the performance-price ratio on a certain basis is a necessary condition for the development and growth of the business。

3. Limitations and future research direction This study aims at collecting data for college students. The results may be limited by the sample population, and whether the results are applicable to other groups remains to be tested. This study constructs the theoretical model on the basis of the existing research, but in practice, the factors that affect the user's use of intelligent music platform are not only these, but also the variables that may be ignored in this study. In addition, the study did not explore the degree of interaction between the various influencing factors.

In view of the limitations of this study, we can start with the following aspects in the future:

1. Expand the sample size and improve the proportion of samples in all regions and ages

2. In-depth study of the interrelationship between internal variables and a more complete model.

3. In-depth understanding of customer needs, for different users to develop a corresponding pricing model, so that customer perception of the service is far higher than the cost required.

REFERENCES

[1] Z. Qiu, Y. Ren, C. Li, H. Liu, Y. Huang, Y. Yang, and K. Zhang,

"Mind Band: a crossmedia AI music composing platform," In Proceedings of the 27th ACM International Conference on Multimedia, Vol, 3, No, 3, pp. 2231-2233, Oct. 2019. DOI:

https://doi.org/10.1145/3343031.3350610

[2] Q. H. Nguyen, T. T. Do, T. B. Chu, L. V. Trinh, D. H. Nguyen, C. V. Phan, and M. C. Chua, "Music Genre Classification using Residual Attention Network," In 2019 International Conference on System Science and Engineering, Vol, 9, No, 2, pp. 115-119, July.

2019. DOI: 10.1109/ICSSE.2019.8823100

[3] R. Louie, A. Coenen, C. Z. Huang, M. Terry, and C. J. Cai,

"Novice-AI Music Co-Creation via AI-Steering Tools for Deep Generative Models," In Proceedings of the 2020 CHI Conference on Human Factors in Computing Systems, Vol, 4, No, 4, pp. 1-13, Apr. 2020. DOI: https://doi.org/10.1145/3313831.3376739 [4] J. McCormack, T. Gifford, P. Hutchings, M. T. Llano Rodriguez,

M. Yee-King, and M. d'Inverno, "In a Silent Way: Communication between AI and improvising musicians beyond sound," In Proceedings of the 2019 CHI Conference on Human Factors in Computing Systems, Vol, 3, No, 38, pp. 1-11, May. 2019. DOI:

https://doi.org/10.1145/3290605.3300268

[5] T. T. Nguyen, P. M. Vu, and T. T. Nguyen, "Code Search on Bytecode for Mobile App Development," In Proceedings of the 2019 ACM Southeast Conference, Vol, 4, pp. 253-256, Apr. DOI:

https://doi.org/10.1145/3299815.3314471

[6] A. Vahdat, A. Alizadeh, S. Quach, and N. Hamelin, "Would you like to shop via mobile app technology? The technology acceptance model, social factors and purchase intention," Australasian Marketing Journal (AMJ). Vol, 5, No, 1, pp. 15-19, Jan. 2019.

DOI: https://doi.org/10.1016/j.ausmj.2020.01.002

[7] S. Seshanna, and S. Ramanujam, "Measuring Factors that Influence the Success of App based Mobile Commerce," E-Commerce for Future & Trends, Vol, 6, No, 1, pp. 1-6, June. 2019. DOI:

http://dx.doi.org/10.37591%2Fecft.v6i1.2025

[8] W. Zhang, "A Study on the User Acceptance Model of Artificial Intelligence Music Based on UTAUT," Journal of the Korea Society of Computer and Information, Vol, 25, No, 6, pp. 25-33, June. 2020. DOI: https://doi.org/10.9708/jksci.2020.25.06.025 [9] K. Sokolova, and H. Kefi, "Instagram and YouTube bloggers

promote it, why should I buy? How credibility and parasocial interaction influence purchase intentions," Journal of Retailing and Consumer Services, Vol, 53, pp. 68-73, Mar. 2020. DOI:

https://doi.org/10.1016/j.jretconser.2019.01.011

[10] J. Prodanova, A. Ciunova-Shuleska, and N. P. Sterjadovska,

"Enriching m-banking perceived value to achieve reuse

intention," Marketing Intelligence & Planning, Vol, 37, No, 6,

(8)

pp. 617-630. Sep. 2019. DOI: https://doi.org/10.1108/MIP-11- 2018-0508

[11] S. K. Abbas, H. A. Hassan, J. Asif, B. Ahmed, and S. S. Haider,

"Integration of TTF, UTAUT, and ITM for mobile Banking Adoption," International Journal of Advanced Engineering, Management and Science (IJAEMS), Vol, 4, No, 5, pp. 375-379, May. 2018. DOI: https://doi.org/10.1016/j.ijinfomgt.2018.10.024 [12] F. Z. Barrane, G. E. Karuranga, and D. Poulin, "Technology

adoption and diffusion: a new application of the UTAUT model," International Journal of Innovation and Technology Management, Vol, 15, No, 6, pp. 195-233, June. 2018. DOI:

https://doi.org/10.1142/S0219877019500044

[13] A. Pooya, M. Abed Khorasani, and S. Gholamian Ghouzhdi,

"Investigating the effect of perceived quality of self-service banking on customer satisfaction," International Journal of Islamic and Middle Eastern Finance and Management, Vol. 13 No. 2, pp. 263-280. June. 2020. DOI: https://doi.org/10.1108/I MEFM-12-2018-0440

[14] S. M., Hanjaya, S. K. Kenny, and S. F. Gunawan, "Understanding factors influencing consumers online purchase intention via mobile app: perceived ease of use, perceived usefulness, system quality, information quality, and service quality," Marketing of Scientific and Research Organizations, Vol, 32, No, 2, pp.

175-205. Oct. 2019. DOI: https://doi.org/10.2478/minib-2019-00 35

[15] A. K. Othman, L. F. A. Hassan, M. I. Hamzah, A. R. Razali, M. A. S. Saim, M. S. Ramli, and M. A. A. Azhar, "The Influence of Social Commerce Factors on Customer Intention to Purchase,"

Asian Themes in Social Sciences Research, Vol, 3, No, 1, pp.

1-10, Mar. 2019. DOI: https://doi.org/10.33094/journal.139.2019 .31.1.10

Authors

Jingrong Li received a B.A. degree in Music Performance in 2011 and a M.A. degree in Music in 2014 from Shenyang Conservatory of Music in China. Since 2018, She has been a Ph.D. student in Global Music at Kyonggi

University in Korea. Jingrong Li has been teaching in the

Music Conservatory of Anshan Normal University in China

since 2014. She is currently mainly responsible for

instrumental music teaching. She is interested in traditional

music and makes a deep study of the traditional music of

ethnic minorities in Northeast China.

수치

Table  2.  Demographic  Characteristics  of  the  Sample

참조

관련 문서

A Study on the Education Institution of Korean Traditional Music: Centering around

The goal of study is to find out whether the music drama activity has a positive effect on young children's prosocial behavier by experimenting with

In terms of the relationship between personal service contact and passengers' emotions, this study classified service contact quality factors into four groups based on

Objectives: This study aimed to investigate the relationship between job stress and turnover intention of employed opticians and to investigate the mediating effect of burnout

The purpose of this study is to analyze the effects of service quality on customer satisfaction and revisit intention perceived by Chinese golf range

As the basis of the study, concept behind information communication technology was formed, and based on theoretical fundamentals of current internet use, ICT

1 John Owen, Justification by Faith Alone, in The Works of John Owen, ed. John Bolt, trans. Scott Clark, &#34;Do This and Live: Christ's Active Obedience as the

The goal of this paper is to study curriculum and management status of Arts and Culture Education Instructors focused on Korean music among the