1. Introduction
An environmental impact assessment (EIA) collects information on development sites pertaining to natural environmental factors, such as air, quality, and soil quality; ecological factors, such as the current state of animals and plants; and socio-economic factors, such as population and housing status. Although previously collected environmental, statistical, and spatial data can be used (Sung et al., 2019; Cho et al., 2017; Song et al., 2015), it is also necessary to collect information
directly via field surveys to acquire detailed data on the target site (Kim et al., 2017; Yoo et al., 2011). Preparing and reviewing environmental impact statements (EIS) necessitate considerable time and cost.
Since an EIS is used as reference material for a specific project, it contains very detailed information about the surrounding area. Accordingly, information on past projects in the same area can be used as reference data when preparing an EIA, although the practical use of such information requires institutional improvement (Cho et al., 2019).
Construction of Spatiotemporal Big Data Using Environmental Impact Assessment Information
Namwook Cho
1)· Yunjee Kim
2)· Moung-Jin Lee
3)†Abstract: In this study, the information from environmental impact statements was converted into spatial data because environmental data from development sites are collected during the environmental impact assessment (EIA) process. Spatiotemporal big data were built from environmental spatial data for each environmental medium for 2,235 development sites during 2007-2018, available from public data portals. Comparing air-quality monitoring stations, 33,863 measurement points were constructed, which is approximately 75 times more measurement points than that 452 in Air Korea’s real-time measurement network. Here, spatiotemporal big data from 2,677,260 EIAs were constructed. In the future, such data might be used not only for EIAs but also for various spatial plans.
Key Words: Environmental Impact Assessment, Spatial Information, Big Data, Data Science
https://doi.org/10.7780/kjrs.2020.36.4.11 ISSN 2287-9307 (Online)
Letter
Received August 13, 2020; Accepted August 18, 2020; Published online August 25, 2020
1)
Invited Research Fellow, Environmental Assessment Group, Korea Environment Institute
2)
Researcher, Environmental Assessment Group, Korea Environment Institute
3)
Research Fellow, Center for Environmental Data Strategy, Korea Environment Institute
†
Corresponding Author: Moung-Jin Lee ([email protected])
This is an Open-Access article distributed under the terms of the Creative Commons Attribution Non-Commercial License
(http://creativecommons.org/licenses/by-nc/3.0) which permits unrestricted non-commercial use, distribution, and reproduction in
any medium, provided the original work is properly cited.
The existing EIA information system is based on the Environmental Impact Assessment Support System, which is an information system operated by the Ministry of the Environment of Korea to collect and disclose information generated during the EIA process.
This system not only discloses information according to administrative procedure, such as the original text of the EIS and its annexes, but also supports the preparation of the EIS by providing basic spatial data necessary for the EIA (Yoo, 2018; Lee et al., 2018).
To establish a system that uses more detailed EIA information, we constructed spatiotemporal big data of spatial and attribute information using the measured values for each environmental medium in the projects and adjacent areas subject to EIA during 2007-2018 (Lee, 2018; Ahn et al., 2013). These big data are based on location, measurements, and other administrative information that the developer must provide in the process of submitting the EIS. Under the current system, when promoting a new project subject to EIA, the relevant data for the area surrounding the target site
can be derived from a literature survey. It is possible to reduce the time and cost of the EIA process and improve the quality of the assessment by allowing the use of information obtained in other projects. This paper also introduces and discusses methods that can be used in fields such as spatial planning (Kim et al., 2016) and existing EIA.
2. Method of EIA spatial big data construction
EIA spatiotemporal big data were constructed from 2,235 EIA projects and 541 EIA follow-up reports from the original EIS texts collected from the Environmental Impact Assessment Support System from 2007 to 2018.
The data construction process is divided into three steps.
First, to extract attribute information, the environmental quality measurement information included in the EIS is classified and standardized for each environmental medium, item, and substance and constructed as data.
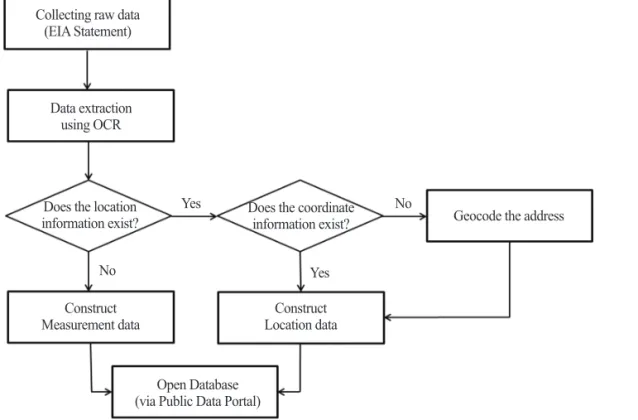
Fig. 1. Flow Chart of data processing.
Collecting raw data (EIA Statement)
Data extraction using OCR
Does the location
information exist? Does the coordinate information exist?
Yes
Yes
No No
Geocode the address
Construct
Measurement data Construct
Location data Open Database
(via Public Data Portal)
To this end, the original EIS data in pdf files are converted using optical character recognition (OCR).
Then, to extract spatial information, the standard spatial big data is defined and geocoded through standardization of the coordinates or address data extracted in the first step. Finally, the big data are stored as an open database (DB) to facilitate processing and utilization. The attribute and spatial information extracted in this process is integrated, refined into an open DB, and stored in a form that can be used in conjunction with OpenAPI and CSV format (Ahn et al., 2009). These processes are summarized in Fig. 1.
1) Extraction of attribute information To extract attribute information from an EIS, first identify the form of the attribute information. When the entire attribute information is composed of text layers, the original pdf file is defined as Text PDF, and the text is extracted by OCR. However, when the attribute
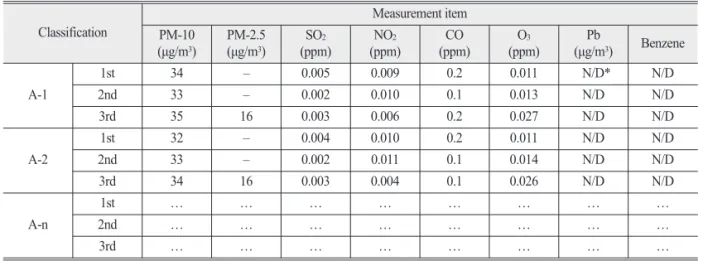
information includes only some or no text layers, the text is extracted using options such as alphabet (letter) + number or Korean + Chinese. The text extracted by dividing it into two categories is constructed as an attribute DB via verification processes, such as data- attribute value, address typo, and null value checks (Table 1).
2) Extraction of spatial information
First, the data must be cleaned to extract accurate spatial information. This proceeds in the following order: coordinate verification, address verification, address cleaning, and checking the shapefile format. To determine the exact location of spatial information, location data are constructed after verifying the coordinates and checking the accuracy of the addresses written in the original text. Coordinate verification is a process of checking whether the coordinate system is correct, such as longitude and latitude or transverse Table 1. Example of Environmental quality measurement data in EIS (Cheongju Ochang Technopolis General Industrial
Complex Development)
Classification Measurement item
PM-10
(µg/m
3) PM-2.5
(µg/m
3) SO
2(ppm) NO
2(ppm) CO
(ppm) O
3(ppm) Pb
(µg/m
3) Benzene A-1
1st 34 – 0.005 0.009 0.2 0.011 N/D* N/D
2nd 33 – 0.002 0.010 0.1 0.013 N/D N/D
3rd 35 16 0.003 0.006 0.2 0.027 N/D N/D
A-2
1st 32 – 0.004 0.010 0.2 0.011 N/D N/D
2nd 33 – 0.002 0.011 0.1 0.014 N/D N/D
3rd 34 16 0.003 0.004 0.1 0.026 N/D N/D
A-n
1st … … … … … … … …
2nd … … … … … … … …
3rd … … … … … … … …
* N/D : Non-Detection
Table 2. Example of measuring location information in EIS (Cheongju Ochang Technopolis General Industrial Complex Development)
Investigation
spot Address Coordinates (TM)
X Y
A-1 535, Hugi-gil, Ochang-eup, Cheongwon-gu, Cheongju-si, Chungcheongbuk-do 232332 361855 A-2 77-6, Ochanggajwa 4-gil, Ochang-eup, Cheongwon-gu, Cheongju-si, Chungcheongbuk-do 233672 360038
A-n Address of spot A-n … …
Mercator. This is the most important process when amassing spatial information because geocoding cannot be performed when there are coordinate errors. When transverse Mercator coordinates are used, it is necessary to identify the origin point and check the map index information. After coordinate verification, standardized spatial information is constructed by unifying the coordinate system of all spatial data (Table 2).
3. Results of constructing EIA spatial big data
After building the big data, 2,677,260 projects were included in a DB by integrating attribute and spatial information for 15 assessment items, such as air quality.
The result was deemed national key data and made available as an open DB through public data portals (https://www.data.go.kr/).
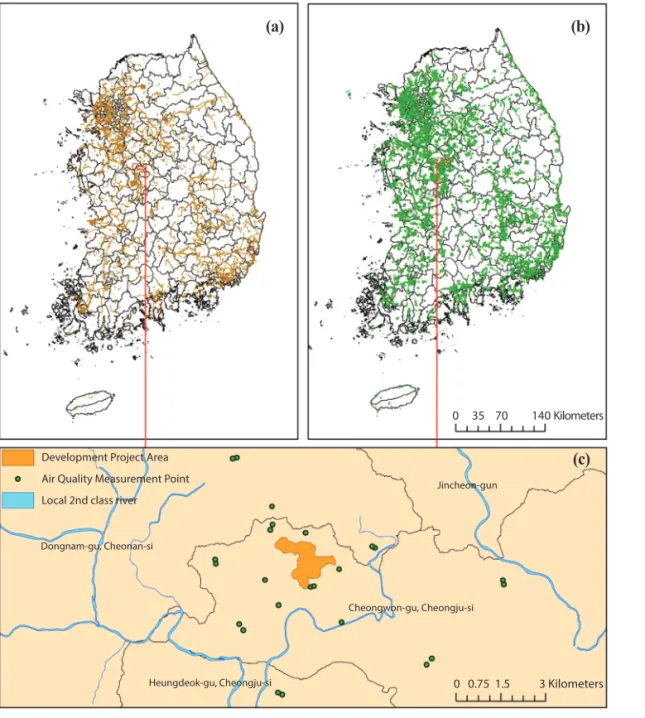
Fig. 2. (a) Development Project Area and (b) Air Quality Mesurement Point in EIA Spatial Big Data, (c) Case study of 「Cheongju Ochang Technopolis General Industrial Complex Development」 Project.
Development Project Area Air Quality Measurement Point Local 2nd class river
Dongnam-gu, Cheonan-si
Jincheon-gun
Cheongwon-gu, Cheongju-si
Heungdeok-gu, Cheongju-si