• 검색 결과가 없습니다.

A Case Study on Function Point Method applying on Monte Carlo Simulation in Automotive Software Development

N/A
N/A
Protected

Academic year: 2021

Share "A Case Study on Function Point Method applying on Monte Carlo Simulation in Automotive Software Development"

Copied!
11
0
0

로드 중.... (전체 텍스트 보기)

전체 글

(1)

JKSCI

A Case Study on Function Point Method applying on Monte Carlo Simulation in Automotive Software Development

1)

Sung Ryong Do*

*Professor, Industry Academy Cooperation Foundation, SangMyung University, Seoul, Korea

[Abstract]

Software development activities are influenced by stochastic theory rather than deterministic one due to having process variability. Stochastic methods factor in the uncertainties associated with project activities and provides insight into the expected project outputs as probability distributions rather than as deterministic approximations. Thus, successful software projects systematically manage and balance five objectives based on historical probability: scope, size, cost, effort, schedule, and quality. Although software size estimation having much uncertainty in initial development has traditionally performed using deterministic methods: LOC(Lines Of Code), COCOMO(COnsructive COst MOdel), FP(Function Point), SLIM(Software LIfecycle Management). This research aims to present a function point method based on stochastic distribution and a case study based on Monte Carlo Simulation applying on an automotive electrical and electronics system software development. It is expected that the result of this paper is used as guidance for establishing of function point method in organizations and tools for helping project managers make decisions correctly.

▸Key words: Function Point Method, Software Size Estimation, Monte Carlo Simulation, Quantitative Management, Stochastic Distribution

[요 약]

소프트웨어 개발은 다양한 프로세스 변동을 포함하기 때문에 , 결정론적 이론 보다는 확률론적 이론에

더 영향을 많이 받는다 . 확률론적 방식은 결정론적 방식보다 프로젝트 활동과 관련된 불확실을 고려하

고, 예상되는 결과에 대해서 확률 분포로 접근하는 장점이 있다. 그러므로 소프트웨어 프로젝트를 성공 하기 위해서는 확률 분포에 기반하여 범위, 규모, 비용, 공수, 일정 그리고 품질 목표를 체계적으로 관리해야 한다 . 소프트웨어 규모 산정은 불확실성이 큰 개발 초기의 활동임에도 불구하고, LOC, COCOMO, FP, SLIM과 같은 결정론적 산정 방식으로 수행되고 있다. 본 연구에서는 확률적 분포 기반의 기능 점수 프로세스를 수립하고, 효과를 검증하기 위해 몬테카를로 시뮬레이션 기반의 자동차 전기전자

제어시스템 소프트웨어 개발에 적용한 사례를 제시한다 . 본 연구 결과가 조직 내 기능 점수 프로세스를

수립하기 위한 가이드 및 관리자들의 정확한 의사결정 도구로 활용될 것으로 기대한다 .

▸주제어: 기능 점수 기법, 소프트웨어 규모 산정, 몬테카를로 시뮬레이션, 정량적 관리, 확률 분포

∙First Author: Sung Ryong Do, Corresponding Author: Sung Ryong Do

*Sung Ryong Do ([email protected]), Industry Academy Cooperation Foundation, SangMyung University

∙Received: 2020. 05. 06, Revised: 2020. 06. 16, Accepted: 2020. 06. 19.

Copyright ⓒ 2020 The Korea Society of Computer and Information http://www.ksci.re.kr pISSN:1598-849X | eISSN:2383-9945
(2)

I. Introduction

All of the software development processes must deal with intangibility and invisibility; for instance, in scope, size, cost, effort, schedule, and quality.

For that reason, project quality can only be checked at the end of the project development phase. Due to these characteristics, project managers and leaders incorrectly can make decisions. Thus, they must consider these six variables in stochastic values rather than in deterministic values[1].

For successful software development projects, they systematically have to manage and balance the six variables based on stochastic distribution.

Especially, software size and cost estimation require a sufficient amount of historical data because incorrect estimation may lead the project to be a failure.

Although software size estimation has uncertainty in an initial software development phase, it has been traditionally performed by using the following methods: LOC, COCOMO, FP, SLIM, etc. However, these methods may fail to deal with the numbers of variable factors in the software development process[1]. Thus, it is necessary to introduce a stochastic approach to improve the accuracy of the estimation, in consideration of process variations.

Review of literature reveals widespread use of stochastic methods like Monte Carlo simulation, Bayesian Belief Networks, and Sensitivity Analysis in different fields of work, such as in financial[2]

and construction projects, etc. However, the use of Monte Carlo simulation in software project estimation is relatively much less[3].

We suggest a function point method applying on Monte Carlo Simulation and introduce a case study that applies an automotive electrical and electronic system software development. The difference between the traditional function point method is that the stochastic distribution of existing historical data is utilized in counting data functions,

transaction functions, and value adjustment factors. We present a case applied to an automotive electrical and electronic software vendor to verify the findings.

For comparison with the traditional function point method, we performed the statistical analysis in parallel with the traditional method and compared the results. In paired T-Test, the proposed method showed higher accuracy of estimation, and a high correlation was also proven through the correlation analysis with LOC.

The result of this paper is expected to be used as guidance for establishing a function point method and tools to help project managers and leaders make the right decisions.

Section 2 describes background theories and related works. Section 3 mentions a function point method applying to Monte Carlo Simulation.

Section 4 shows the research result of applying the proposed method on an automotive electrical and electronics system software development. Finally, the conclusion and future works are described in Section 5.

II. Related Works

1. Estimation and Function Point

Size and effort estimation activities in software development have been a controversial issue in software engineering. LOC, COCOMO, FP, SLIM, and many other techniques are being studied and researched for further improvement.

Function Point method denotes a family of

algorithmic methods for size estimation. This method

separately evaluates two classes of software system

attributes: size factors and influence factors. The first

version of FPA, invented by Albrecht at IBM in 1979,

proposed a new metric (i.e., function point) for

software size other than lines of code. The

International Function Point User Group (IFPUG)

adopted a revised method, defining function point as

a means to measure software size by quantifying the

(3)

functionality provided to the user based solely on logical designs and functionality specifications.

Because the functionality of a software system, from the user’s perspective, usually emerges early in a project, this method offers the unique advantage of being applicable during the early stage, when other approaches to size measurement are not appropriate.

This method classifies the functions of a software system into five types: internal logical files (ILF), which are internally maintained logical groups of data; external interface files (EIF) that are passed or shared among applications; external inputs (EI), which refer to the unique user data or control inputs that add to or change the data; external outputs (EO), which are the unique user data or control outputs that fall outside the boundaries of the system; external inquiries (EQ), which are the unique input that generates immediate output.

Furthermore, IFPUG groups these functions into either data functions (ILFs and EIFs) or transaction functions (EIs, EOs, and EQs)[4].

Existing research related to function points are as follows: Reference proposed function point method where a regression model is applied for the adjustment factor[5]. Reference proposed a scheme for optimizing the 14 general system characteristics based on existing data[6]. Reference suggested a software size estimation method based on function points and proposed a method for predicting the productivity of specific development stages based on the results[7].

Several studies are in progress with relation to function points, but previous studies have proposed methods that estimate software size using a representative value. In other words, they are conducted on a deterministic basis, which holds the problem of not considering the variability of the estimation factors. Therefore, it is necessary to consider variability based on the simultaneous variation of different parameters that affect the results, which is something that can be considered in a stochastic method.

2. Quantitative Management and Monte Carlo Simulation

Quantitative management is to manage a project using statistical techniques to build an understanding of the predicted performance of processes in comparison to the processes performance objectives and identifying corrective action that may need to be taken[8]. Statistical techniques used in quantitative management include analysis, creation, or use of process performance model; analysis, creation, or use of process performance baselines; use of control chart; analysis of variance, regression analysis;

and use of confidence intervals or prediction intervals, sensitivity analysis, simulations, and tests of hypotheses.

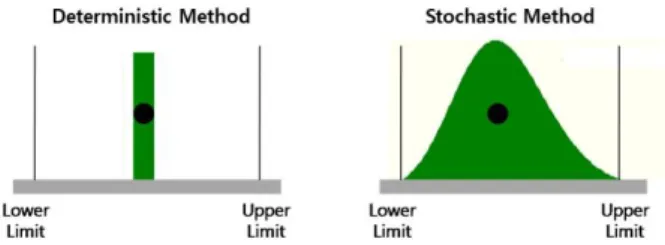
Quantitative management is classified into a deterministic and stochastic methods, such as in Fig. 1. The deterministic method is used to determine a representative value such as an average and maximum value. The deterministic method is easy to use and understand but is not suitable in the field requiring accurate analysis, as it does not take diversity and variability of variables into account. On the other hand, the stochastic approach is more focused on the uncertainty of variables because it depends on the stochastic distribution extracted from historical data[1]. One of the typical methods for the stochastic approach is the Monte Carlo simulation technique.

Fig. 1. Deterministic Method and Stochastic Method

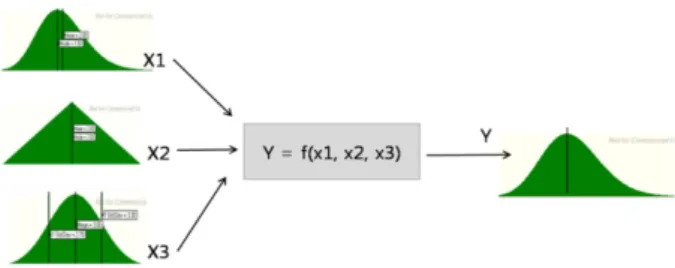
Monte Carlo simulation is a technique in which

values are arbitrarily selected from the probability

distribution of values for use in the simulation, as

shown in Fig. 2. also referred to as the simulated

(4)

sampling technique. The advantage of this method is that the generated input can be any random number in any condition given the number of all cases and that distribution and statistics are generated from the results to support further decision-making[9].

Fig. 2. Concept of Mente Carlo Simulation

Typical studies that use Monte Carlo simulations on software development are as follows: Reference presented a case applying the Monte Carlo simulation technique for sensitivity analysis of the COCOMO II model[10]. The reference proposed a Monte Carlo simulation-based risk management process and presented the simulation results for project schedule prediction[9]. Reference presents the development of a probabilistic model for process variations notation to estimate the amount of effort needed for each software development step and proposed a verification method that utilizes the Monte Carlo simulation[3].

Although a variety of statistical techniques and guidelines, including the Monte Carlo simulation and quantitative management for SEI(Software Engineering Institute) of the United States, are recently more proposed and utilized, the software sector is still in a fairly early stage of an application, and in particular, further studies are required for application of such techniques on estimation activities.

III. Function Point Method applying on Monte Carlo Simulation

This study deals with an improved function point method that applies the stochastic theory to the

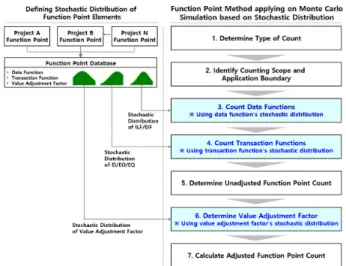
existing function point estimation. The key point of the process is to apply the Monte Carlo Simulation based on stochastic distribution theory to the main estimation elements such as data functions, transaction functions, and value adjustment factors. It is proposed that the statistics of the main estimation elements should be extracted from the same type of domain.

1. Construct Stochastic Distribution of Data Functions

Extract data function on the same type of domain from the existing function point results.

Classify data function into ILF and EIF. Construct stochastic distribution based on the result of classification.

2. Construct Stochastic Distribution of Transaction Functions

Extract transaction function on the same type of domain from the existing function point results.

Classify transaction function into EI, EO, and EQ.

Construct stochastic distribution based on the result of classification.

3. Construct Stochastic Distribution of Value Adjustment Factors

Measure general system characteristics influencing the performance of software, such as data communications, distributed data processing, complex processing, reusability and facilitate change. Construct stochastic distribution based on the result of a measurement.

The steps for the function point method based

on stochastic distribution are as in Fig. 3. The

difference from the existing function point method

is that the stochastic distribution theory is applied

to the decisions on data functions, transaction

functions, and value adjustment factors.

(5)

Fig. 3. Function Point Method applying on Monte Carlo Simulation based on Stochastic Distribution

IV. Research Result

1. Case Study Overview

1.1 Feature of Automotive Electrical and Electronics System Software Development

To verify the effect of the research, we applied the function point method based on stochastic distribution to a domestic automotive electrical and electronic control system software development.

A key characteristic of automotive software development is that when new automotive and systems are developed, most projects are developed as enhancing functions on existing software that is already implemented. For example, when an Engine Control Unit software embedded on a light-weight vehicle is developed, most of the functions (torque, fuel, air, etc.,) on a middle size vehicle are commonly reused and only some parts of the functions are modified. Due to the high-reusability of functions, historical data extracted from past similar projects and stochastic distribution play a significant role in function estimation.

1.2 Introduction to Case Study Project

We analyzed the historical data from 19 Engine Management System projects to define the stochastic distribution for the function point estimation elements. Target projects were Engine Management

System for the light-weight vehicle with 83%

reusability. Engine Management System is the system that controls the amount of air intake, fuel, and ignition timing so as to generate the requested torque. The Engine Management System structure is as shown in Fig. 4 and is separated into several functions such as torque, air, fuel, monitoring, etc.

Fig. 4. System Structure of Engine Management System

2. Case Study Result

In this case study, Monte Carlo simulation was used to apply the function point method based on stochastic distribution. Crystal Ball based on Microsoft Excel was used as a supporting tool.

2.1 Determine Type of Count

Project A is a new development project for an Engine Management System software that will be loaded on a light-weight vehicle.

2.2 Identify Counting Scope and Application Boundary of Engine Control Unit

The counting scope of project A includes Engine Management System software and driver and external Engine Control Unit software as in Fig. 5.

The application boundary is limited to the Engine Control Unit.

Fig. 5. Counting Scope and Application Boundary of ECU

(6)

2.3 Count Data Functions

Data functions of project A is measured by using stochastic distribution in Table 1, defined by existing Engine Management System software data functions. Respective measured data is summed according to formula, as in (1):

              (1)

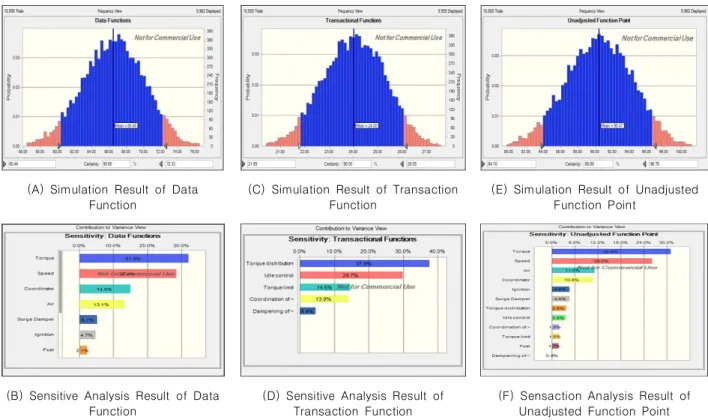
Equation (1) is defined as a formula in Crystal Ball and simulation is Engine Control Unit. As a result, it showed that the data function of the engine torque component is from a minimum of 60.44 to a maximum of 72.33 in 90% chances with an average of 66.48 as described in Fig. 6(a). In terms of sensitivity, as described in Fig. 6(d), the influence of ILF is higher than the influence of EIF, and data function ‘Torque’ and ‘Speed’ had the most powerful influence.

2.4 Count Transaction Functions

Transaction functions of project A are measured using stochastic distribution in Table 2, defined by the existing Engine Management System software transaction functions. Respective measured data is summed according to formula, as in (2):

                 (2)

Equation (2) is defined as a formula in Crystal Ball and simulation is executed. As a result, it showed that the transaction functions of the engine torque component are from a minimum of 21.89 to a maximum of 26.05 in 90% chances with an average of 24 as described in Fig. 6(b). In terms of sensitivity, as described in Fig. 6(e), there are no significant differences among EI, EO, and EQ.

Torque distribution and Idle control transaction function have the highest amount of influence.

2.5 Determine Unadjusted Function Point

Unadjusted function point of project A is measured with the sum of data functions and transaction functions, as in (3):

                  (3)

Equation (3) is defined as a formula in Crystal Ball and then the simulation is executed. As a result of execution, it showed that the unadjusted function point is distributed from 84.10 to 96.70 in 90% chances with an average of 90.47 as described in Fig. 6(c). In terms of sensitivity, as described in Fig. 6(f), the influence of data functions is higher than the influence of transaction functions, with data function ‘Torque’ and ‘Speed’ holding the highest influence.

2.6 Determine Value Adjustment Factors

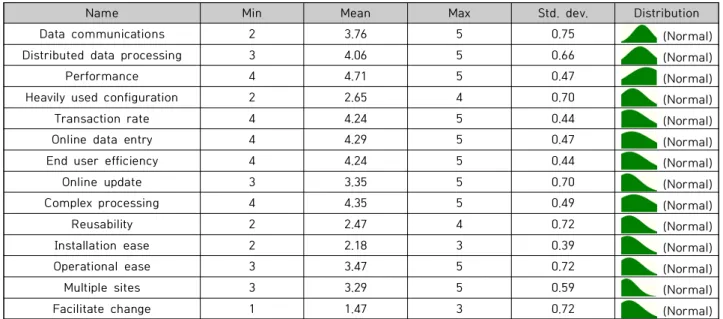
Value adjustment factors refer to the influence of general system characteristics and are determined in a subjective manner. In order to minimize such subjectivity, experts have determined value adjustment factors through brainstorming activities. However, as subjectivity still remains, value adjustment factors of project A are measured with the stochastic distribution in Table 3, defined from the existing adjustment factors of Engine Management System software. Respective measured adjustment factors are summed according to the formula in (4). Equation (4) is defined as a formula in Crystal Ball and then the simulation is executed.

As a result of execution, it showed that the value adjustment factor is distributed from 1.13 to 1.18 in 90% chances with an average of 1.16 as described in Fig. 7(a). In terms of sensitivity, as described in Fig. 7(c), data communications, and distributed data processing have the highest amount of influence.

          ×    (4)

(7)

2.7 Calculate Adjusted Function Point Count The way to measure the adjustment function point of project A is to multiply unadjusted function points and adjustment factors. Equation (5) is defined as a formula in Crystal Ball and then the simulation is executed. As a result of execution, it showed that the adjustment function point for engine torque component is distributed from 96.67 to 112.11 in 90% chances with an average of 104.66 as described in Fig. 7(b). In terms of sensitivity, as described in Fig. 7(d), the influence of data function is higher than the influence of transaction function or adjustment factor, and the influence of data functions ‘Torque’ and ‘Speed’ had the highest amount of influence.

   ×  (5)

3. Verification of Case Study

To verify the effectiveness of the case study, we conducted statistical analyses for differences and correlation comparisons.

3.1 Verification of Difference with Final Function Point

In general, there is a difference between function point measured at the beginning and function point derived at the end of the project. As described in Table 4, through the paired t-test, we could verify the difference among function point measured by the traditional method, function point measured by the method proposed in this study, and function point determined at the end of the project. We measured the statistical significance of the function point determined at the end of the project and the function point measured by the traditional method, and the result illustrated a difference with t-value 3.366 and significance probability 0.008 in the significance level of .05 as described in Table 5. On the contrary, as described in Table 5, there was no significant difference in the comparison between the function point determined at the end of the project and the function point measured by the

stochastic distribution, with the resulting t-value being -2.150 and significance probability .069 in the significance level of .05. Consequently, the method suggested by this study was proven to be more accurate in estimating the final function point than the traditionally used method.

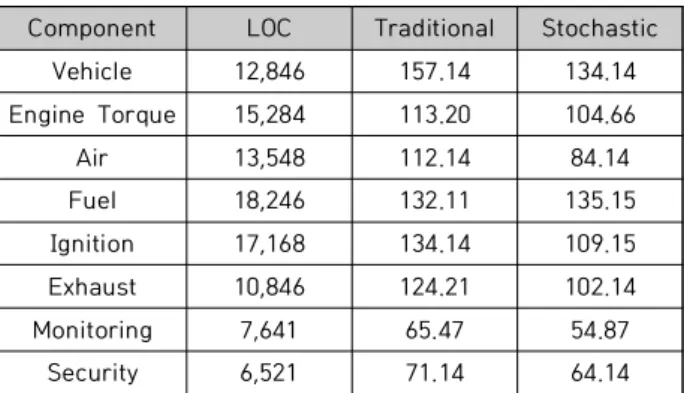
3.2 LOC Correlation Comparison Verification In terms of data collected in Table 6, we indirectly evaluated them by comparing the correlation between LOC and function point measured by the traditional method, and the correlation between LOC and function point measured by the method proposed in this study.

The correlation coefficient between LOC and

function point measured by the traditional method

is .737 and the correlation coefficient between LOC

and function point measured by the method using

stochastic distributions is .787 in the significance

level .05 as described in Table 7. It is confirmed

that both correlation coefficients are high, but the

correlation coefficient between LOC and function

point measured by the latter method is slightly

higher. However, it is unreasonable to generalize

the result of the LOC correlation comparison as the

data used is confined to the projects included in

this study.

(8)

Name Type Min. Mean Max. Std. dev. Distribution

Torque ILF 7 12.29 15 3.10 (Normal)

Surge Damper ILF 7 8.06 10 1.48 (Normal)

Speed ILF 7 12.76 15 2.84 (Normal)

Coordinator ILF 10 13.53 15 2.35 (Normal)

Air EIF 5 7.12 10 1.87 (Normal)

Fuel EIF 5 5.47 7 0.87 (Normal)

Ignition EIF 7 9.12 10 1.41 (Normal)

Table 1. Function Point and Stochastic Distribution of Data Function

Name Type Min. Mean Max. Std.

dev. Distribution Torque distribution to the path: air, fuel, ignition EO 4 6.06 7 1.20 (Normal) Dampening of load alternation via limitation

of torque gradient EO 4 4.24 5 0.44 (Normal)

Coordination of vehicle and engine torque demands EQ 4 5.65 6 0.79 (Normal)

Torque limit (max. speed) EI 3 3.29 6 0.77 (Normal)

Idle control EI 3 5.18 6 1.01 (Normal)

Table 2. Function Point and Stochastic Distribution of Transaction Function

Component Final Traditional Stochastic

Vehicle 141.95 157.14 134.14

Engine Torque 106.25 113.20 104.66

Air 96.18 112.14 84.14

Fuel 137.12 132.11 135.15

Ignition 129.82 134.14 109.15

Exhaust 109.28 124.21 102.14

Monitoring 52.76 65.47 54.87

Security 62.18 71.14 64.14

Table 4. Result of Final, Traditional and Stochastic FP

Division Final Traditional Final Stochastic

Mean 104.44 113.69 104.44 98.55

Std. dev. 33.10 31.38 33.10 29.44

Sample 8 8 8 8

t-value 3.366 -2.150

Sig. Pro. .008 .069

Table 5. Paired T-Test of Final, Traditional and Stochastic FP

Name Min Mean Max Std. dev. Distribution

Data communications 2 3.76 5 0.75 (Normal)

Distributed data processing 3 4.06 5 0.66 (Normal)

Performance 4 4.71 5 0.47 (Normal)

Heavily used configuration 2 2.65 4 0.70 (Normal)

Transaction rate 4 4.24 5 0.44 (Normal)

Online data entry 4 4.29 5 0.47 (Normal)

End user efficiency 4 4.24 5 0.44 (Normal)

Online update 3 3.35 5 0.70 (Normal)

Complex processing 4 4.35 5 0.49 (Normal)

Reusability 2 2.47 4 0.72 (Normal)

Installation ease 2 2.18 3 0.39 (Normal)

Operational ease 3 3.47 5 0.72 (Normal)

Multiple sites 3 3.29 5 0.59 (Normal)

Facilitate change 1 1.47 3 0.72 (Normal)

Table 3. Degree of Influence and Distribution of Value Adjustment Factor

(9)

(A) Simulation Result of Data Function

(C) Simulation Result of Transaction Function

(E) Simulation Result of Unadjusted Function Point

(B) Sensitive Analysis Result of Data Function

(D) Sensitive Analysis Result of Transaction Function

(F) Sensaction Analysis Result of Unadjusted Function Point

Fig. 6. Monte Carlo Simulation Result of Data, Transaction Function and Unadjusted Function Point

(A) Simulation Result of Value Adjustment Factor (C) Simulation Result of Adjusted Function Point

(B) Sensitive Analysis Result of Value Adjustment Factor (D) Sensitive Analysis Result of Adjusted Function Point

Fig. 7. Monte Carlo Simulation Result of Value Adjustment Factor and Adjusted Function Point

(10)

Component LOC Traditional Stochastic

Vehicle 12,846 157.14 134.14

Engine Torque 15,284 113.20 104.66

Air 13,548 112.14 84.14

Fuel 18,246 132.11 135.15

Ignition 17,168 134.14 109.15

Exhaust 10,846 124.21 102.14

Monitoring 7,641 65.47 54.87

Security 6,521 71.14 64.14

Table 6. LOC and Result of Traditional and Stochastic FP

Division Traditional Stochastic Sig. Level

LOC .737* .787* *p < .05

Table 7. Correlation Coefficient(R2) between LOC and Traditional and Stochastic FP

V. Conclusion and Future Works

In this work, we proposed a process for estimating function points using stochastic distribution. We applied our approach to an automotive electrical and electronics software development and demonstrated a comparison of our method with the original process through statistical analysis. Effects of the study are as follows:

First, project managers and leaders can make more correct decisions based on the stochastic distribution, which takes into consideration the variations within the process. It is difficult to understand the number of variations that may occur at the beginning of the project lifecycle.

However, it is possible to increase the accuracy of the estimation at the beginning of the project, when one defines a stochastic distribution for the process variation factors.

Second, project managers may be able to prepare various alternatives in advance through simulation. The function point results highly affect the overall cost and effort. If the function point is high or low as a result of the simulation, it can be used as a base material for proper cost and effort

adjustments. In addition, through the sensitivity analysis, the project manager would identify significant factors to the measurement result and they can be used as objects for priority control in implementation and verification.

Third, project managers can reduce the effort in estimating project size and cost. In organizations that develop a similar systems for each domain, such as automotive electrical and electronics control areas, it can improve efficiency in measurement by using stochastic distribution derived from past projects.

In order to increase the completeness of the results of this study, it is necessary to expand and validate this method in different projects in various domains such as body, chassis, and multimedia. In addition, the result of the function point is meaningful when it is used as monitoring indicators during the project period and when project managers use it to estimate cost and effort. We will therefore further extend this study to a quantitative project management system based on the stochastic distribution associated with EVM (Earned Value Management) based on function point.

REFERENCES

[1] U. S. Rao, K. Srikanth and P. Chinmay, "Stochastic Optimization Modeling and Quantitative Project Management," IEEE Software, Vol. 25, No. 3, pp. 29-36, May-June 2008. DOI: 10.1109/MS.

2008.77

[2] W. Tysiak and A. Sereseanu, "Monte Carlo simulation in risk management in projects using Excel," 2009 IEEE International Workshop on Intelligent Data Acquisition and Advanced Computing Systems: Technology and Applications, pp. 581-585, Rende, Italy, Dec 2009. DOI: 10.1109/IDAACS.2009.5342913 [3] J. Dasgupta, G. Sahoo and R. P. Mohanty, "Monte carlo simulation

based estimations: Case from a global outsourcing company,"

International Technology Management Conference, IEEE International, pp. 619-624, CA, USA, Aug 2011. DOI:

10.1109/ITMC.2011.5996034

[4] B. Ergashev, "Estimating the lognormal-gamma model of

operational risk using the Markov chain Monte Carlo method,"

(11)

The Journal of Operational Risk, Vol. 4, No. 1, pp. 35-57, March 2009. DOI: 10.21314/JOP.2009.056

[5] I. Y. Jung, D. J. Woo, J. H. Park and C. S. Jeong, "Improved Function Point Measurement Model for Software Size Estimation,"

Korea Society for Internet Information, Vol. 10, No. 4, pp.

115-125, 2009.

[6] S. G. Park and J. Y. Park, "A Study for Software Sizing Method,"

The Korea Computer Industry Education Society, Vol. 5, No. 4, pp. 471-480, 2004.

[7] J. S. Srivastava and G. Singh, "Optimized GSCs in Function Point Analysis - A Modified Approach," International Journal of Research and Reviews in Applied Sciences, Vol. 17, No. 1, pp.

97-104, Nov 2013.

[8] H. K. Raju, Y. T. Krishnegowda, "Software Sizing and Productivity with Function Points," Lecture Notes on Software Engineering, Vol. 1, No. 2, pp. 204-208, January 2013. DOI:

10.7763/LNSE.2013.V1.46

[9] CMMI Product Team, "CMMI® for Development, Version 1.3, Improving processes for developing better products and services,"

Software Engineering Institute, pp. 433-454, 2010.

[10] C. Y. Kim "Applying Monte Carlo Simulation for Software Project Risk Management Method," Master's Dissertation, Sangmyung University, 2011.

[11] P. Musilek, W. Pedrycz, N. Sun and G. Succi, "On the sensitivity of the COCOMO II Software Cost Estimation model," IEEE International Symposium on Software Metrics, IEEE Computer Society, Vol. 1, Ottawa, CANADA, Feb 2002. DOI:

10.1109/METRIC.2002.1011321

Authors

Sung Ryong Do received the B.S., M.S. and

Ph.D. degrees in Computer Science from

SangMyung University, Korea, in 2008, 2010

and 2016, respectively. Dr. Do worked at

Hyundai Autron in Hyundai Motor Group

from 2012 to 2017. He is currently a Professor in the

Industry Academy Cooperation Foundation, SangMyung

University. He is interested in software engineering, software

process, and software safety.

수치

Fig.  1.  Deterministic  Method  and  Stochastic  Method
Fig.  2.  Concept  of  Mente  Carlo  Simulation
Fig.  3.  Function  Point  Method  applying  on  Monte  Carlo  Simulation  based  on  Stochastic  Distribution
Table 4. Result of Final, Traditional and Stochastic FP
+3

참조

관련 문서

Therefore, in this paper, Forward scattering rate and Scattered to primary ratio analysis were performed through Monte Carlo simulation in order to consider

In this study, the calculation of the effective spatial dose distribution of the diagnostic imaging laboratory of K university was performed by the Monte Carlo simulation..

In this study, through the simulation using the Monte Carlo technique, we will analyze the exposure dose by cone beam computed tomography and present the

Thus, the purpose of this study is to present a case study on how to apply function point analysis technique to sizing of the software systems based on UML.. The

0.25mm and 0.5mm thick lead and 0.1mm and 0.2mm thick water shielding materials were configured in Monte Carlo Simulation for this study. Only lead shielding method and water plus

양성자 전산화 단층 촬영 장치 개발에 관한 전산모사 연구 ― Development of a Proton Computed Tomography System with Monte Carlo Simulation ― 대원대학 방사선과..

A Study on the Product Qualification Criteria through Monte-Carlo Simulation and Association Rule Analysis.. Namsu Ahn † ・

Under the given conditions in this study, the risk analysis method using Monte Carlo simulation is the more effective way to evaluate the accurate value of mines than the