토지이용-교통 통합 모형을 활용한 도시 환경 영향 예측 방법론 개발
허혜정1*⋅양충헌1,2⋅윤천주1⋅김인수1⋅성정곤1
1한국건설기술연구원 도로연구소, 2과학기술연합대학원대학교 교통물류 및 ITS공학과
Developing a Method for Estimating Urban Environmental Impact Using an Integrated Land Use-Transport Model
HU, Hyejung1*⋅YANG, Choongheon1,2⋅YOON, Chunjoo1⋅KIM, Insu1⋅SUNG, Junggon1
1Highway Research Institute, Korea Institute of Civil Engineering and Building Technology, Gyeonggi 411-712, Korea
2Logistics System & ITS Engineering, University of Science & Technology, Daejeon 305-350, Korea
Abstract
This paper describes a method that can be used for estimating future carbon emissions and environmental effects. To forecast future land use and transportation changes under various low carbon policies, a DELTA and OmniTRANS combination (a land use-transport integrated model) was applied. Appropriate emission estimation methods and dispersion models were selected and applied in the method. It was designed that the estimated emissions from land use and transportation activity as well as the estimated concentrations of air pollutants and comprehensive air quality index (CAI) are presented on a GIS-based map. The prototype was developed for the city of Suwon and the outcome examples were presented in this paper; it demonstrates what kinds of analysis results are presented in this method. It is expected that the developed method will be very useful for decision makers who want to know the effect of environmental policies in cities.
이 논문은 도시의 장래 탄소 배출량과 환경적 영향을 예측하는 방법론에 대하여 설명하고 있다. 다양한 저탄소 도시/교통 정책의 시행으로 인한 장래의 토지이용과 교통의 변화를 예측하기 위하여 토지이용 통합 모형인 DELTA, OmniTRANS 조 합을 적용하였다. 또한, 이러한 모형과 통합하기에 적합한 배출량 산정 모형과 확산모형을 선정하여 사용하였다. 개발 방법 론의 결과 값인 토지이용과 통행 활동으로 인한 이산화탄소 및 대기오염 물질의 배출량, 오염 물질의 농도, 통합 대기질 지수 등이 GIS 기반의 지도에 표출되도록 하였다. 수원시를 대상으로 프로토타입을 개발하고 결과 값의 표출 사례를 논문에 예시 하였다. 개발 방법론은 환경 친화적인 도시 정책의 효과를 알고자 하는 정책 결정자들에게 유용하게 사용될 수 있을 것으로 기대된다.
Keywords
air pollutions, carbon emissions, GIS, land use transportation integrated model, urban policy evaluation 대기 오염물질, 탄소배출량, GIS, 토지이용 교통 통합 모형, 도시 정책 평가
* : Corresponding Author Received 28 October 2014, Accepted 3 April 2015
[email protected], Phone: +82-31-910-0761, Fax: +82-31-910-0161
Ⓒ Korean Society of Transportation
This is an Open-Access article distributed under the terms of the Creative Commons Attribution Non-Commercial License (http://creativecommons.org/licenses/by-nc/3.0) which permits unrestricted non-commercial use, distribution, and reproduction in any medium, provided the original work is properly cited.
Article
INTRODUCTION
As global warming and climate change became a global issue, many countries have been making big efforts to reduce greenhouse gas emissions;
the Republic of Korea is one of those countries.
The Korean government declared “Low-Carbon Green Growth” as a main national strategy from 2008 to 2012 and supported the strategy by mak- ing regulations such as: giving incentives to businesses developing green technologies and products, using public information tools to in- crease awareness and demand for green products to reduce greenhouse gas emissions from various industries.
As part of the efforts to achieve the goal for re- alizing low-carbon cities, urban and trans- portation planners in Korea have suggested vari- ous policies such as: ‘Transit Oriented Develop- ment’, ‘High-Density Development’, ‘Expansion of Green Space’, ‘Expansion of Green Transporta- tion System’, and so on. However it was difficult to assess these policies because there was no ap- propriate evaluation method.
The main goal of this research is developing a method that can be used for estimating future carbon emissions and environmental effects by land use and transportation policies in a specific area. This research covers CO2 and some air pol- lutants such as CO, PM10, and NOx.
First of all, to achieve the goal it was required to forecast future land use and transportation changes under various low carbon policies. There- fore, a land use transportation integrated models DELTA (Simmonds, 1999) and OmniTRANS (2013) were selected and applied. Secondly, ap- propriate emission estimation methods and dis- persion models were selected and applied. These models use the outputs from the land use trans- portation forecasting models as inputs.
The developed method will be useful for deci- sion makers who want to know the effect of poli-
cies for realizing a low-carbon city. For ease of use it was designed so that the estimated CO2,
CO, PM10, and NOx emissions from land use and transportation activity as well as the estimated concentrations of air pollutants and Compre- hensive Air quality Index are presented on a GIS-based map.
In this paper, the features of the models which are included in the method were explained briefly with the framework of the method and examples of outcomes were presented as well.
LITERATURE REVIEW
Although it is well known that land use and transportation systems interact with each other, the simulation models for the two systems have been studied separately until the 1970s. Various methodologies and models have been developed for each field. However, many researchers real- ized the need for the integration of the land use and transportation simulation model from the 1980s. Research for developing and applying land use transportation integrated models are now ac- tively underway in many countries. ILUTE(Miller and Paul(2014), Miller(2006)), TLUMIP(Weidner et al., 2006), ALBATROSS(Arentze and Timmer- mans(2000), Arentze and Timmermans(2004)), PUMA (Ettema and Timmermans, 2006), IRPUD (Wegener, 2004), and PROPOLIS(Lautso et al., 2004) are good examples of those.
Recently, as the importance of environmental problems are getting highlights, various models were developed to estimate carbon emissions and air pollutants from human activities in cities.
Human activities in cities are distinguished into land use activities and travel activities. However, most emission estimation tools were linked with one category. For example, INDEX (Allen, 2009) and I-PLACE³S(Czachorski, 2008) are tools for the land use side and calculate the emissions ac- cording to land use plans. MOVES(2013), MODEM
(Jost et al.,(1992), Joumard et al.(1995)), PHEM(Rexeis et al., 2005), VeTess(Pelkmans et al., 2004), and CMEM(2001) are tools for the travel activity side and calculate the emissions according to travel properties(vehicle speed, number of trips, and travel lengths).
Land use transportation integrated models can simulate changes of cities more realistically be- cause these models emulate the interaction be- tween land use and transportation and provide the both activity data. However, these models are complex and require lots of input data.
There are very few studies applying a land use transportation integrated model for environ- mental assessment in Korea. The Kim et al.(2010)’s study is one of those: they applied DELTA and OmniTRANS combination as a land use transportation integrated model to Delft, Netherlands to forecast future city changes by various land use and transportation policies.
Then they estimated energy consumption and carbon emissions using the simulation results.
This is the first application of a land use trans- portation integrated model in Korea. Even though the case study’s site is not in Korea the research introduced the capabilities of the model to Korea.
The goal of the research is to develop a method that can be used for estimating future carbon emissions and environmental impact by land use and transportation policies. To forecast future land use and transportation changes under vari- ous low carbon policies, the DELTA and Omni TRANS combination was selected. The proposed method also includes emission estimation models and air quality analysis models and additional functions of visualizing estimated results on a GIS-based map.
The developed method is distinguishable with other existing methods. Emissions were usually calculated according to planned amounts in ur- ban plans and policies by using existing calcu-
lation methods. Since cities has not been devel- oped as our plan, the emission estimation should have big gap with actual emissions. In order to addressed this problem, the authors proposed to use the simulation results from a land use trans- portation integrated models which can simulate changes of cities more realistically.
METHODOLOGY
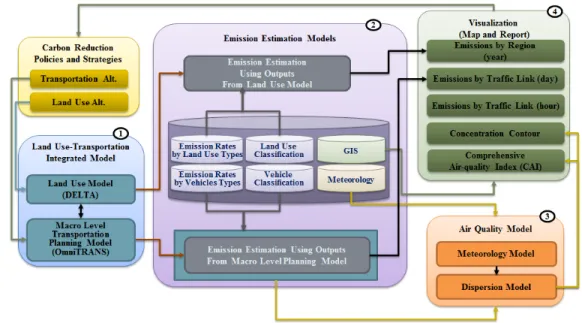
1. Method FrameworksFigure 1 depicts the method frameworks. The method consists of four main parts. The first part is the land use transportation integrated model to forecast future land use and transportation changes. DELTA and OmniTRANS were selected for the first part.
The second part includes emission estimation models. Those models use the outputs from the land use and transportation modeling results as inputs in order to calculate emissions. Using forecasted space by land use type which are pro- vided from DELTA, CO2 emissions from land use are estimated. Since emissions from land use ac- tivity are mostly indirect emissions, air quality impact analysis is not performed.
Estimated link travel speed and volumes from OmniTRANS are used for estimating emissions such as CO2, CO, PM10, and NOx emissions from traffic. Because the emissions from traffic are mostly direct emissions, air quality impact anal- ysis need to be performed. This is the third part.
The traffic link based emissions are inputs for the dispersion model to estimate pollutant con- centrations.
The estimated concentrations of CO, PM10, and NOx are used for calculate Comprehensive Air-quality Index(CAI, Seoul Air Quality Informa- tion, 2013). CAI helps the user to judge how harmful the air-quality is by comparing the esti- mated concentration and the significant concen-
Figure 1. Method frameworks
tration level of each pollutant.
The last part is designed for visualizing analy- sis results. The estimated emissions from land use and transportation activity as well as the es- timated concentration and CAI are visualized on a GIS-based map.
2. Analysis Method
1) Land Use-Transportation Integrated Model
In order to reduce carbon and air pollutants emissions in cities, many urban and trans- portation policies can be suggested: ‘Transit Oriented Development’, ‘High-Density Develop- ment’, ‘Expansion of Green Space’, ‘Expansion of Green Transportation System’, and so on. According to a selected policy, land use and transportation alternatives are made up. Land use alternatives consist of change of developing space by housing and work and land use restrictions. Transporta- tion alternatives include the change of trans- portation networks and policy for travel related fare.
DELTA and OmniTRANS combination is for forecasting future land use and transportation
changes by these various low carbon policies.
The DELTA and OmniTRANS modeling process was designed to make the two models constantly refer each other’s simulation results to reflect in- teractions of land use and transportation change.
Land use changes from DELTA effects on travel demand modeling in OmniTRANS and accessi- bility estimated from OmniTRANS effects on forecasting location of housing and work in DELTA.
DELTA has been applied in many European cities for forecasting economy and land used change. DELTA has several sub models: Develop- ment submodel, Employment submodel, Location submodel, Transition and Growth submodel, and Area quality submodel. Each submodel requires various input data, i.e. population, number of employee, current land use, car ownership, house income, developing cost, and so on. These data can be prepared using socioeconomic statistics of a subjected city. Each submodel also has lots of parameters. Many of them need to be calibrated for a subjected city.
OmniTRANS is a traditional four step trans- port planning tool which has the big strength of a
Land Use Total Gross Floor Area(m2)
Total GHG Emissions (tCO2eq/year)
Emission Factors(tCO2eq
/m2/year) 1 Residential 346,331,548.50 12,411,827.89 0.0358 2 Industrial 9,766,600.89 1,105,671.12 0.1132 3 Education/
Research
28,234,085.38 1,282,679.98 0.0454
4 Medical/
Welfare
15,718,824.29 991,788.41 0.0631
5 Retail 79,214,392.71 6,888,589.04 0.0870 6 Office 47,909,582.83 3,553,728.18 0.0742 7 Service 9,378,412.47 857,688.84 0.0915 Table 1. Emission factors by land use type
multi-modal network simulation. Similar to oth- er tools, input data are transport network data, travel OD, and socioeconomic data. Socioeconomic data are adjusted by DELTA results to reflect travel demand change.
Calibration steps are essential for the both models to get reliable results. Calibration steps are followings
‧ Step 1. Build a past point simulation data set
‧ Step 2. Investigate the actual changes by near present time point
‧ Step 3. Estimate the change by the near pres- ent time point using the simulation tools
‧ Step 4. Adjust model parameters by comparing the estimated results and actual val- ues
Simulation outputs from the land use and transportation models are used for calculating emissions.
‧ DELTA: forecasted space(m2) by each land use type are used for CO2 emission estima- tion
‧ OmniTRANS : forecasted link travel speed(km/h) and volumes are used for CO2, CO, PM10, and NOx emission estimation
2) Emission Estimation Model and Emission Rates (1) Emissions from Land use
The emissions from land use activities are cal- culated by multiplying the amount of land use space and yearly emission rates by land use type by Equation (1). Carbon dioxide(CO2) emission rates by land use type were investigated from the energy use statistics of Seoul in 2012(Seoul Statistics, 2014) and presented in Table 1.
Electric use, fuel use from building for lighting, power, cooling, heating, cooking, washing, etc.
were considered.
× (1)Where,
: CO2 emissions from land use in zone z
: Area(m2) of land use type in zone
: Emission factor of land use type
(2) Emissions from Travel activity
Emissions from vehicles were calculated. The Korea National Institute of Environmental Research (NIER, 2010) investigated the average speed- based emission rates for various car types in Korea. Link traffic volumes need to be assigned by vehicle types defined in NIER emission rates according to Equation (2). Proportion of vehicle type was acquired from the vehicle registration management system.
× (2)
Where,
: Link volume of vehicle type in link
: Link volume of link
: Proportion of vehicle type
The emissions are calculated by multiplying driving length, link volume by vehicle type, and emission rates by vehicle types. Equation (3) ex- plains how to estimate CO2, CO, PM10, and NOx emissions from traffic.
×× (3)Where,
: Emissions of pollutant type from
Figure 2. Land use and vehicle composition of Suwon traffic in link
: Driving length of link
: Emission factor of pollutant type , ve- hicle type , and average speed
3) Air Quality Model
The traffic link based emissions are used as in- puts for the dispersion model to estimate pollu- tant concentrations. Air pollutant emissions from vehicles on roads are dispersed to areas around the roads. Measuring scale of dispersed air pollu- tants are concentration. Health impact and haz- ardousness are checked based on the estimated concentration.
CALINE3(Benson, 1979) and AERMOD(2004) can be selected in the method to estimate concen- trations by analysis section. An analysis region is divided to analysis sections in the unit of 1km by 1km grid. Because dispersion is depending on location characteristics and meteorology, these model also ask the following input data: surface roughness(cm), settling velocity(cm/s), deposition velocity(cm/s), source height(meter), mixing zone width(meter), wind speed(m/s), wind an- gle(0-360), atmospheric stability class(A-F), mix- ing height(meter).
Based on the CO, PM10, and NOx concen- trations of each analysis section, Comprehensive Air-quality Index(CAI) was calculated. The equa- tion for CAI is presented in the Korea air quality monitoring site(Seoul Air Quality Information, 2013). CAI helps the user to judge how harmful the air-quality. CAI definitions are followings; A is good, B is moderate, C is unhealthy for sensitive groups, D is unhealthy, and E is very unhealthy.
4) Visualization
For convenience of users, the method includes a function of presenting following estimated re- sults on a GIS-based map. The following items are depicted on the map by user selection.
‧ Emissions by Region(year)
‧ Emissions by Traffic Link(day)
‧ Emissions by Traffic Link(hour)
‧ Concentration Contour
‧ Comprehensive Air-quality Index(CAI)
PROTOTYPE DEVELOPMENT
1. Site DescriptionThe city of Suwon was designated as an appli- cation test bed. The population of Suwon is 1.2 million totaling 10% of Gyeonggi-Do, the total area of Suwon is 102.04 km2, and the total num- ber of vehicles registered in Suwon is 394,885 (Statistics Suwon, 2014). Proportions of land use types and vehicle types are presented in Figure 2(a) and (b). Figure 2(c) is the 2020 land use plan of Suwon(Suwon urban planning history, 2014). Detailed statistics such as number of households, land use space, land prices, building usage information, household income, car owner- ship, car operation cost, and so on were collected and used as DELTA simulation inputs.
2. Network Data
Transportation network was built using the Korea Transportation Network Database(KTDB,
Scenario Population (person)
Travel Length (1,000km-veh/day)
Carbon Emission(1,000 ton/year) Air Pollutant Land use Traffic Total NOx(ppm) PM10(gm) CAI
BAU 1,195,200 2,050 3,306 2,494 5,800 0.0425 49.2 D
Scenario A 1,302,768 2,066 3,343 2,521 5,864 0.0425 50.1 D
(+9%) (+0.8%) (+1.1%) (+1.1%) (+1.1%) (+0%) (+1.8%)
Scenario B 1,183,248 2,031 3,292 2,485 5,777 0.0418 49.5 C
(-1%) (-0.9%) (-0.4%) (-0.4%) (-0.4%) (-1.6%) (+0.6%)
Table 2. Changes by the scenarios in 2020 using the proposed method 2014). KTDB provided 2010 transportation net- work data and trip related properties. The trans- portation network improvement plans decided to implement was reflected in the future year trans- portation network.
3. Scenarios
There are four counties in Suwon; Paldal-Gu (center), Jangan-Gu(North part), Gwonsun-Gu (left side), and Youngtong-Gu(right side).
Application test scenarios were designed to evaluate the effect of extension of the developed area during 2010-2020 by two development plans. Those two development plans were re- flected in the following scenarios A and B.
‧ BAU (Business as Usual): No extension
‧ Scenario A: Redevelopment of resident area in Gwonsun-Gu. Add 587,228 m2
‧ Scenario B: Development of commercial area in Jangan-Gu. Add 179,686 m2.
RESULTS
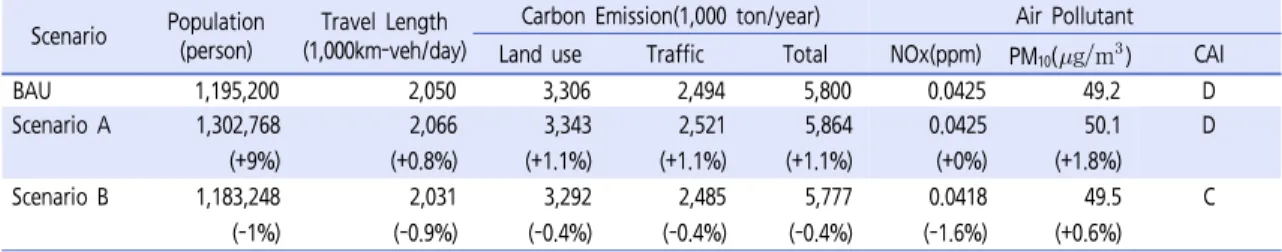
1. Analysis ResultsTable 2 summarizes the preliminary results of the three scenarios. The changes in population, travel, and emissions by the scenarios were compared.
Scenario A shows 9% of the population increasing. Travel lengths, carbon emissions, and air pollutant concentrations were raised up a little bit.
In scenario B: population was decreased a little bit even though the scenario is for in- creasing space of the total commercial area.
Possible reason is that employees of this area may commute from outside of the city of Suwon because the new commercial area locates in the northern part of Suwon. Total travel lengths and total carbon emissions were decreased. By decreasing NOx concentration, CAI changed from D to C.
Figure 3 shows some outputs visualized on a GIS map. Figure 3(a) depicts the total developed area by land use type, region, and scenario.
Figure 3(b) shows the total CO2 emissions by scenario. It helps the user to compare changes by scenario. Figure 3(c) through Figure 3(f) are maps presenting BAU scenario results; CO2
emissions by region, CO2 emissions by road, NOx concentrations, and CAI by grid respectively. CO and PM10 concentration maps are not shown here but those are possible to be depicted. Figure 3(c) to Figure 3(f) can be created by scenario. Those are very useful to examine which specific location is good or bad in terms of CO2 emissions and air pollutions.
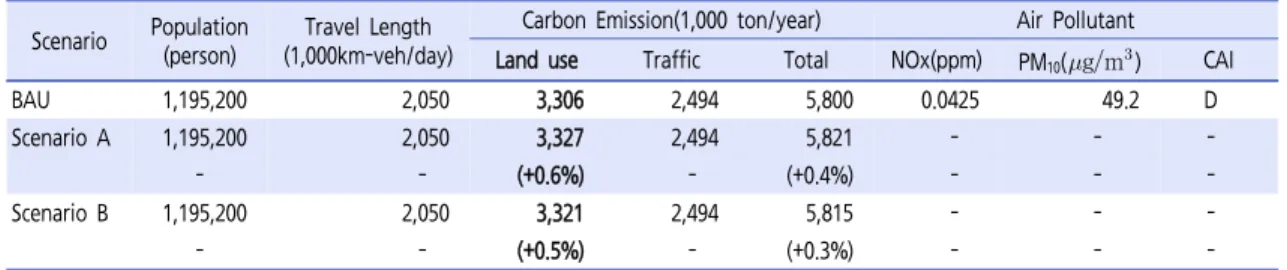
2. Comparison with Existing Method
The emissions changes by the scenarios A and B were estimated an existing method. By the se- lected existing method, interaction between land use and transport were not considered. Only changed amounts of land use were counted for emission changes.
Figure 3. Some outputs visualized on a GIS map
Scenario Population (person)
Travel Length (1,000km-veh/day)
Carbon Emission(1,000 ton/year) Air Pollutant Land use Traffic Total NOx(ppm) PM10(gm) CAI
BAU 1,195,200 2,050 3,306 2,494 5,800 0.0425 49.2 D
Scenario A 1,195,200 2,050 3,327 2,494 5,821 - - -
- - (+0.6%) - (+0.4%) - - -
Scenario B 1,195,200 2,050 3,321 2,494 5,815 - - -
- - (+0.5%) - (+0.3%) - - -
Table 3. Changes by the scenarios in 2020 using an existing method
The analysis results by the existing method were shown in Table 3. Because the scenarios does not include any transportation system change, emissions by traffic activity is same. The emissions by land use plan were simply calcu- lated by multiplying increased land use amount of the each scenario and the corresponding emis- sion factors in Table 1. CO2 emissions are slight- ly increased in the both Scenario A and B.
The results of Scenario B in Table 2 and Table 3 show the big difference between existing meth- od and the proposed method. In other words, forecasted amount of land use change is not sim- ply increased by land use plan in the proposed model. Cities are not changes as our plan and policy. Therefore, it would be better to use the proposed model to forecast future city change and estimate carbon emissions.
CONCLUSIONS
In order to reduce carbon emissions in urban areas where many people live and work, the re- search team developed a method for estimating future environmental effects of land use and transportation plan and policies through apply- ing land use transportation integrated models.
The method overcame the limitations of the existing methods; urban land use prediction and traffic demand analysis had to be separately conducted. Also, the method can produce esti- mated emissions, concentration, and CAI using embedded emission estimation models and air quality analysis models. By giving a function of presenting estimated results through a GIS-based map to users, city policy decision makers have a big convenience when they com- pare their low carbon alternatives.
The outcome examples of the three scenarios for the city of Suwon were presented in this paper. Because the scenarios contain only simple land use change, those were not enough to suffi- ciently explain the strength of the proposed method. Therefore, scenarios include plans of land use and transport change over the years need to be prepared and simulated in future studies. Calibration processes and related results also need to be provided for proving the reli- ability of the proposed model.
The developed method could be applied for fol- lowing purposes;
‧ Use the developed land use transportation integrated model as a methodology for pre- dicting effects of land use planning and transportation policies.
‧ Use the developed method to predict carbon emissions according to the changes of urban space layout and travel behavior.
‧ Use the developed method in a decision mak- ing process in developing policies for low-car- bon city planning.
‧ Use the developed method as a tool for dem- onstrating the effectiveness of a low-carbon
green city model.
The developed method will be very useful for decision makers who want to know the effect of policies for realizing a low-carbon city. However, the person who is applying this method needs to understand following characteristics. First, the developed method requires huge amount of data and time to build the simulation network for a BAU scenario. However, once a BAU scenario for a city is built, it is much easier to make any al- ternative scenarios for the city. Second, there are many factors needed to be calibrated in the proc- ess of building a simulation network. Also, be- cause there are many factors such as emission factors need to be periodically updated, manage- ment work is very important.
ACKNOWLEDGEMENT
This research was supported by a grant from the High-Tech Urban Development Program funded by the Ministry of Land, Infrastructure, and Transport of Korea.
REFERENCES
AERMOD: Description of Model Formulation (2004), USEPA.
Allen E. (2009), Designing a Cool Spot Neighborhood: An Urban Planning Technique to Reduce GHG Emissions, in Policy, Urban Form, and Tools for Measuring and Managing Greenhouse Gas Emissions, Lincoln Institute of Land Policy.
Arentze T., Timmermans H. (2000), ALBATROSS - A Learning-Based Transportation-Oriented Simulation System, Eindhoven: European Institute for Retailing and Services Studies (EIRASS).
Arentze T., Timmermans H. J. P. (2004), A Learning- Based Transportation-Oriented Simulation System, Transportation Research Part B, 38(7), 613-633.
Benson P. E. (1979), CALINE3 - A Versatile Dispersion Model for Predicting Air Pollutant Levels Near Highways and Arterial Streets, FHWA, Report No.
FHWA/CA/TL-79/23.
Comprehensive Air-quality Index, Seoul Air Quality Information, http://cleanair.seoul.go.kr/inform.htm?
method=ca, 2013. 12. 15.
Comprehensive Modal Emissions Model (CMEM) User’s Guide (2001), University of California Riverside Center for Environmental Research and Technology.
Czachorski M. (2008), Development of an Energy Module for I-PLACE³S : PIER Final Project Report, California Energy Commission.
Ettema D., Timmermans H. (2006), Multi-agent Modelling of Urban Systems: A Progress Report of PUMA System, Stadt Region Land 81, Aachen: Institut fur Stadtbauwesen und Stadtverkehr, RWTH Aachen, 165-171.
Jost P., Hassel D., Webber F. J., Sonnborn K. S. (1992), Emission and Fuel Consumption Modelling Based on Continuous Measurements, DRIVE Project V 1053.
Joumard R., Jost P., Hickman J. (1995), Influence of Instantaneous Speed and Acceleration on Hot Passenger Car Emissions and Fuel Consumption, SAE Paper 950928, Society of Automotive Engineers, Warrendale, Pennsylvania.
Kim K. I., Yi C., Lee S. (2010), A Scenario Analysis on Transport Energy Consumption and Carbon Emission Using DELTA, Journal of Korea Planners Association, 45(6), 117-135.
Korea Transporation Database, Korea Transportation Institute, http://www.ktdb.go.kr, 2014.7.15.
Lautso K., Spiekermann K., Wegener M., Sheppard I., Steadman P., Martino A., et al. (2004), Planning and Research of Policies for Land Use and Transport for Increasing Urban Sustainability, DG Research.
Miller E. J. (2006), Integrated Urban Modelling: Some Theoretical Considerations, Stadt Region Land 81, Aachen: Institut fur Stadtbauwesen und Stadtverkehr, RWTH Aachen, 71-79.
Miller E. J., Paul A. S., Integrated Land Use, Transporta- tion, Environment (ILUTE) Modelling Systems, Salvini University of Toronto, http://www.civ.
utoronto.ca/sect/traeng/ilute/downloads/conference_p apers/miller-salvini_iatbr-00.pdf. 2014.7.15.
MOVES (Motor Vehicle Emission Simulator, US Environmental Protection Agency, http://www.epa.gov/
otaq/models/moves/index.htm, 2013.12.15.
National Air Pollutant Emission Calculation Method Manual II (2010), National Institute of Environmental Research.
OmniTRANS Product Overview, OmniTRANS Interna- tional. http://www.omnitrans-international.com/en/
products/omnitrans/product-overview. 2013.12.15.
Pelkmans L., Debal P., Hood T., Hauser G., Delgado M. R.
(2004), Development of a Simulation Tool to Calculate Fuel Consumption and Emissions of Vehicles Operating in Dynamic Conditions, SAE Paper 2004- 01-1873, Society of Automotive Engineers.
Rexeis M., Hausberger S., Riemersma I., Tartakovsky L., Zvirin Y., Erwin C. (2005), Heavy-duty Vehicle Emissions, Final Report of WP400 in ARTEMIS (Assessment and Reliability of Transport Emission Models and Inventory Systems), University of Technology, Graz.
Seoul Climate – Energy Map Development – Year 2 (2012), Seoul City Government.
Simmonds D. C. (1999), The Design of the DELTA Land- Use Modeling Package, Environment and Planning B:
Planning and Design, 26, 665-684.
Seoul Statistics, http://stat.seoul.go.kr, 2014.7.15.
Statistics Suwon, http://stat.suwon.go.kr/stat/index.do.
2014.7.15.
Suwon Urban Planning History, City of Suwon, http://oui.
suwon.ne.kr/ebook/cityplan200/main.html.
2014.7.15.
Wegener M. (2004), Overview of Land-use Transport Models In: Hensher, D.A., Button, K.J.(Eds.): Transport Geography and Spatial Systems, Handbook 5 of Handbook in Transport, Kidlington, UK: Pergamon/
Elsevier Science, 127-146.
Weidner T., Donnelly R., Freedman J., Abraham J. E., Hunt J. D. (2006), TLUMIP - Transport Land Use Model in Portland - Current State, Stadt Region Land 81, Aachen: Institut fur Stadtbauwesen und Stadtverkehr, RWTH Aachen, 91-102.
알림 : 본 논문은 94th TRB Annual meeting (2015.1.13)에서 발표된 내용을 수정‧보완하 여 작성된 것입니다.
♧ 주 작 성 자 : 허혜정
♧ 교 신 저 자 : 허혜정
♧ 논문투고일 : 2014. 10. 28
♧ 논문심사일 : 2014. 11. 19 (1차) 2015. 2. 27 (2차) 2015. 4. 3 (3차)
♧ 심사판정일 : 2015. 4. 3
♧ 반론접수기한 : 2015. 10. 31
♧ 3인 익명 심사필
♧ 1인 abstract 교정필