for Marine Environmental Engineering
Vol. 15, No. 2. pp. 111-117, May 2012111
VOF 기반의 수치조파수조를 이용한 OWC 통합시스템 성능연구에 대한 고찰
류 진1·김길원2·현범수2,†·홍기용3
1중국해양대학교 산동성중점해양공학실험실
2한국해양대학교 조선해양시스템공학부
3한국해양연구원 해양시스템안전연구소
Review of Application of VOF-Based NWT on Integrated OWC System
Zhen Liu1, Ji-yuan Jin2, Beom-soo Hyun2,† and Keyyong Hong3
1Shandong Province Key Laboratory of Ocean Engineering, Ocean University of China, Qingdao 266-100, China
2College of Ocean Science and Technology, Korea Maritime University, Busan 606-791, Korea
3Maritime and Ocean Engineering Research Institute, KORDI, Daejeon 305-343, Korea
요 약
진동수주형 파력발전장치는 가장 널리 사용되는 파력에너지 변환장치이다. 시스템의 작동성능은 1차 변환장치인 공기 실 성능과 2차 변환장치인 터빈의 성능에 지배적인 영향을 받는다고 볼 수 있다. 본 연구에서는 터빈의 영향을 시스템 에 적용하기 위하여 오리피스 모델을 채택하여 성능을 검증하였고 공기실 성능예측을 위하여 VOF 기반의 수치조파수 조가 사용되었다. 터빈의 영향을 고려했을 때, 공기실 내부에서 일어나는 공기와 물의 복잡한 상호작용을 수치적인 방 법을 이용하여 예측하였다. 입사파 조건 및 다양한 공기실 형상이 시스템 성능에 미치는 영향에 대하여 고찰하였고, 터 빈의 영향을 고려한 공기실 내의 수면, 압력, 유량의 변화를 실험적 및 수치적으로 고찰하여 비교분석을 수행하였다.
Abstract - Oscillating water column is the most widely used ocean energy converting systems all over the world. The operating performance is influenced by the efficiencies of the two converting stages in the OWC chamber-turbine integrated system. In order to consider the effects of the turbine, the orifice model are carried out. The VOF based Numerical Wave Tank (NWT) is utilized to simulate the water column oscillation inside the chamber and the results are compared with corresponding experimental data. This paper reviews the state of the art in interaction among wave elevation inside the chamber and air flow rate in the duct, which are con- sidered the turbine effects. Effects of incident wave conditions and several shape parameters on the operating performance of OWC chamber are investigated numerically. The effects of the impulse turbine on the integrated system and interaction among the wave elevation, pressure and air flow velocities variations are investigated.
Keywords: Integrated System(통합시스템), Numerical Wave Tank(수치조파수조), Orifice(오리피스), Oscillating Water Column(진동수주), Wave Energy Conversion(파력에너지변환)
1. INTRODUCTION
The oscillating water column wave energy converting system includes three energy converting stage: 1) Oscillating water
column inside the chamber forces air alternately into and from the atmosphere thro ugh the duct. 2) Turbine with symmetric blades transforms the bi-directional air flow energy to torque.
3) The electricity generator linked to the turbine transform torque into electrical power. The third stage of energy convert- ing is not considered in this study.
†
Corresponding author: [email protected]
This paper was selected and reviewed for publication from EAWOMEN2
2011
A number of efforts have been put into the research of wave energy converting efficiency and operating performance of the oscillating water column system. Physical model with differ- ent bottom slopes was constructed and tested in a wave tank under regular wave conditions by Wang et al. [2002]. Hong et al. [2007] performed an experiment concentrating on the effects of several shape parameters of OWC chamber in wave energy absorbing capability. Marjani et al. [2008] presented a numerical model to predict the flow characteristics in the com- ponents of an oscillating water column (OWC) system used for the wave energy capture.
In turbine system area, Setoguchi et al. [2001] reviewed the investigation on the impulse turbines for wave energy conver- sion with different shape parameters experimentally and numeri- cally and comparison with the wells turbines. Takao et al.
[2007] studied the performance of Wells turbine with end plates effects experimentally by the modeling test. Thakker and Abdulhadi [2008] investigated the performance of the Wells turbine under unsteady bi-directional airflow conditions. The comparative analysis between the experiments and numerical simulation was also carried out. Jayashankar et al. [2009] designed and studied the twin unidirectional impulse turbine topology for OWC based wave energy plants through the field test in India.
The objective of this paper is to show art of stage of inte- grated OWC system, which is considered the turbine effects.
The numerical wave tank based on VOF model has been employed to study the operating performance of OWC cham- ber. Experimental and numerical study focus on the relation- ship between the air flow velocity and the pressure drop induced by the impulse turbine are presented. The interaction between the elevation of the water column and the pressure drop induced by turbines are also studied to demonstrate effects of the air turbine on the performance of the integrated system.
2. NUMERICAL ANALLYSIS OF OWC CHAMBER
2.1 Numerical Wave Tank based on VOF Model In this study, the fluids are incompressible and immiscible.
At the interface of two fluids, we assume that no phase transi-
tion and no slip between fluids. The regular incident waves are generated by the piston motion of the wave maker at the end of the flume. The schematic of the NWT and the coordinate sys- tem are show in Fig. 1, where the d is the still-water depth.
More description about NWT and validation of NWT are pre- sented in Liu et al. [2010].
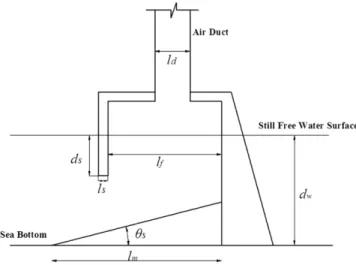
2.2 Effects of Shape Parameter for OWC Chamber The schematic of the OWC air chamber with a cylinder duct installed at the center of the top of cover is shown in Fig. 2.
Where lf denotes the chamber width, ds the draft of the cham- ber skirt, ls the thickness of the chamber skirt, ld the diameter of the cylinder duct, hd the length of the duct. The still water depth is dw=16 m. The slope angle of bottom and the base length of the slope lm are fixed as 26° and 23 m, respectively.
Five cases with various test conditions are summarized in
Fig. 1. Schematic of the numerical wave tank.
Table 1. Calculating Cases with various test conditions
Case l
f(m) l
s(m) d
s(m) l
d(m) A h
d(m) a
0(m) NWT
1 1.5 1.0 2.5 1.5 1.0 0.0 0.38 2D
2 6.0 1.0 3.5 6.0 1.0 0.0 0.5 2D
3 6.0 1.0 2.5 2.5 2.4 13.7 0.5 2D, 3D
4 6.0 1.0 2.5 1.5 46.6 13.7 0.5 2D, 3D
5 6.0 1.0 3.5 1.5 46.6 13.7 0.5 2D, 3D
Fig. 2. Schematic of OWC System.
Table 1. Where a0 is the incident wave amplitude. The con- tents in last column represents which type of the numerical wave tank will be applied in this case. In the first two cases, ld
equals to lf, and hd is zero, which means the top of the cham- ber is totally open with any covers. For case 3, the top of the chamber is partially open along the whole length. The dimen- sionless nozzle area ratio A employed in the investigation is defined as: A=AC/AD.
Where AC is the area of the chamber, and AD is the area of the duct.
The computational oscillating amplitudes of the water col- umn in the chamber with respect to incident wave periods for Case 1 and Case 2 are calculated. The experimental data are carried out in KORDI which was performed with 1/23 scale ratio of the chamber model. The relative wave amplitude vari- ation against the dimensionless number, wave length ratio λ/lf
is shown in Fig. 3. λ is the incident wave length, which varies within the incident wave periods. For Case 1(a), the resonant wave length ratios are obvious where the peak values of the relative wave amplitudes occur. It will converge to around 2 when the wave length ratio increases, because the standing waves are formed in front of the chamber. The numerical pre-
dictions agree well with the experimental data, except that the distribution shows a little shift to the larger incident wave length. For Case 2(b), It can be seen that the peak are not iden- tical when the air chamber has a larger width. The relative amplitudes also converge to about 2 when the wave length ratios are larger than 8. The good agreement between the numerical and experimental results indicates that the present numerical model can predict the variation of the a/a0 distribu- tion of the chamber without any covers.
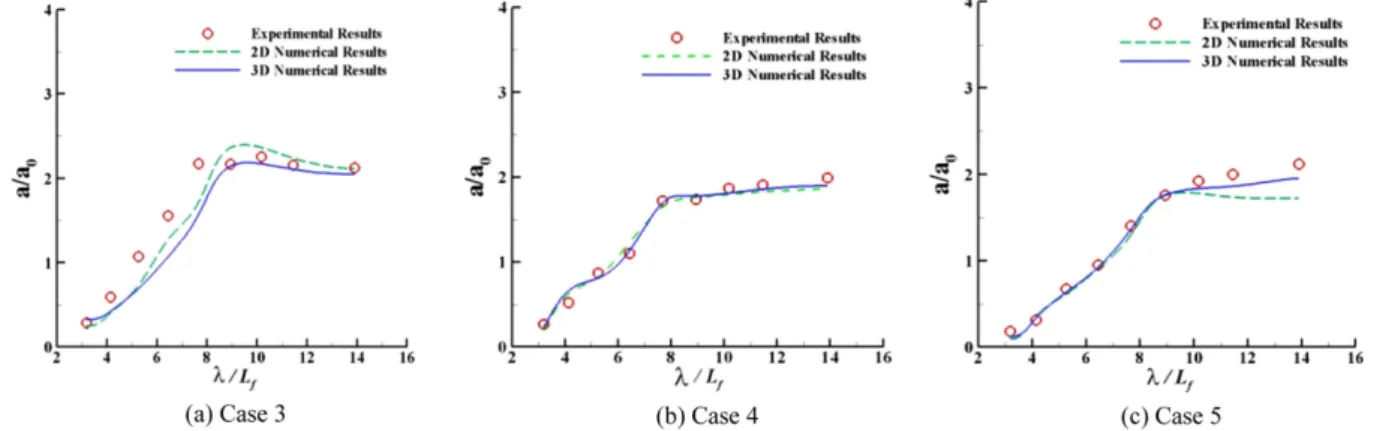
In the study of the chamber with an air duct, the system can be simplified to 2D dimension directly for Case 3 and the area ratios for the duct diameters are considered in Case 4 and 5, when the 2D NWT are utilized. In the 3D calculation, the chamber length is 13.72 m. The numerical and experimental results of relative wave amplitudes when the monitor point is at the center of the chamber for Case 3~5 are displayed in Fig. 4.
Generally, 2D and 3D simulations show little difference on the predicting capability of the free surface elevations at the center of the chamber. Furthermore, the calculated results agree well with the experimental data, except the 3D flume is superior to the 2D model in the larger wave length ratio’s domain for Case 5. The results also show that all the relative amplitudes con- verge to around 2 when the wave length ratios increase to infin- ity, and it indicates that the chambers with large scales and more air volumes inside have wide bands for the effective wave energy converting wave length ratios.
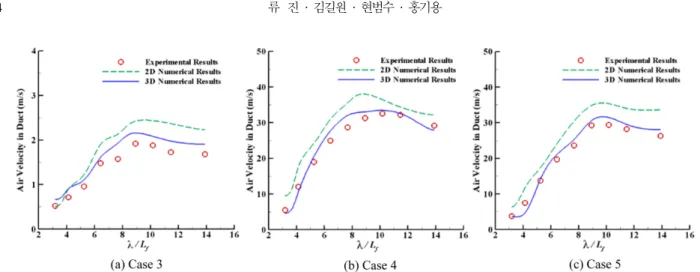
The positive amplitude distributions of the air flow velocity in the duct with respect to the wave length ratios are shown in Fig. 5. It can be seen that most of the numerical predicted val- ues are larger than the corresponding experimental data. How- ever, the results obtained by the 2D model are obviously overestimated, and the 3D calculated air flow velocities satis- factorily agree with the experimental results. The overestima- tions in the 2D calculation are induced by the simplification of
Fig. 3. Relative Wave Amplitude distribution with length ratio vari-
ation.
Fig. 4. Comparison of Relative Wave Amplitude Distribution with Length Ratio Variation.
the chamber-duct system. It cannot predict accurately the com- plicated free water surface elevation including the standing waves formation and sloshing motion of the water column.
The above comparisons illustrate that both 2D and 3D numeri- cal models are capable of simulating the water column oscilla- tion inside the chamber. Comparing with the overestimation of 2D NWT, the 3D model has the good performance on the pre- diction of the air flow motion, which indicates that it also can accurately calculate the air pressure variation in the chamber- duct system.
3. STUDY ON INTEGRATED OWC SYSTEM WITHIN TURBINE EFFECTS
3.1 Pressure Drop Induced by Turbine Effects
The experimental studies are performed at MOERI, KORDI using wave simulator test rig. The test-turbines and orifice devices are all placed at the center of the test section, as shown in Fig.
6. The pressure distributions in the wave simulator test rig are measured by the pressure transducers installed along the flow path of the air flow. Eight sets of transducers are employed in the experiments including a set of two transducers to measure the pressure drop directly at the two sides of the turbine and
orifice device. More description about experimental set-up and dimension of facilities are presented in Liu et al. [2010].
In order to embed the orifice modules into the 3D numerical wave tank to investigate the integrated OWC system, it is nec- essary to validate the accuracy of orifice modules using the above corresponding experimental data.
The prototype wave simulator model (WSM), which has the same configuration and shape parameters, is set up to finish all the numerical simulation. The WSM consists of the piston plate, air chamber and test section.
The sinusoidal air flow will be generated by the piston plate motion at the end of the air chamber. The piston oscillation is realized by the dynamic mesh technology in CFD software Fluent. It can be imaged that the desired air flow rate can be generated by giving the corresponding periods and amplitudes of the piston. Due to the continuity theory, the time averaged air flow rate also can be calculated analytically.
In this simulation, the pressure drops are induced by the blocking effects of the orifice device because of the physical effects. The configuration of the orifices will be set up as same as the experiments.
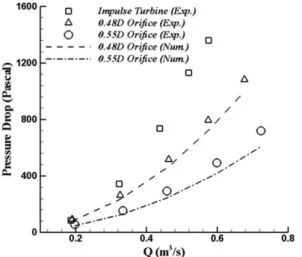
The pressure drop induced by different facilities against the air flow rates are shown in Fig. 7. The oscillating amplitude for every device is fixed as 0.5 m and the oscillating frequencies vary to generate different time averaged air flow rate. It can be seen that the pressure drops will increase when the air flow passes through the facilities. If the inner diameter of the orifice is proper, it is quite easy to make it possible that the pressure drop variation and values are same with the impulse turbine.
The comparison of pressure drops against the variation of air flow rates between the experimental data and numerical results for the orifice cases are also shown in Fig. 7. The computa- tional predictions show good agreements with the laboratory
Fig. 5. Comparison of Positive Amplitude Distributions of the Air Flow velocity in the Duct with the Incident Wave Period Variation.
Fig. 6. Experiment Set-up of wave simulator test rig.
results for the orifice devices within different inner diameters.
It also can be seen that higher pressure loss is induced by the smaller inner diameters of the orifice plate because of more intense blocking effects, which is also evident in the corre- sponding numerical simulation.
From the above experimental results, it can be seen that the orifice device can be utilized as the substitute of the impulse turbine in the corresponding investigation of the pressure drop induced by the turbine effects, only where the diameters need to be modified. The pressure drops against the variation of flow rate for different orifice diameter are shown in Fig. 8. The vari- ation of orifice diameter is from 0.4D to 0.55D. The pressure drop symbol for turbine is not match with curves for orifice. It is means that the orifice diameter should be variable with dif- ferent air flow rate.
3.2 Numerical Prediction on the Performance of Inte-
grated OWC System
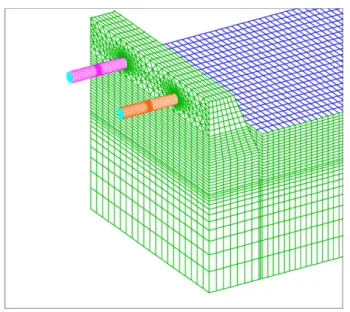
The configuration of the OWC system in the present study is shown in Fig. 9. There are two same duct installed at the end- ing wall of the chamber. The orifice devices with various inner diameters are equipped in both ducts, the thickness of the devices are all fixed as 0.25 m. The still water depth is dw= 20.0 m, the chamber width is lf=9.1 m. ls=0.6 m, ld=1.8 m, lc=35.0 m, ds=3.0 m, he=33.0 m, hd=10.0 m represent the skirt thickness, duct diameter, chamber length, draft of the chamber skirt, total height of the chamber and duct length, respectively.
da=2.0 m is the vertical height of the chamber height above chamber, hc=11.0 m is the projected height on the vertical direction of the sloping wall and lft=4.45 m is the top width of the chamber. la=10.0 m and li=0.86 m (0.48D) represent the distance of the duct center away from the chamber side and inner diameter of the orifice device. The geometry and grid structure of the chamber are shown in Fig. 10.
In order to show the predicting accuracy of the present numerical model, the time histories of wave elevation, air pres- sure variation and air flow velocity in the duct are compared between the numerical simulation and the results derived from the wave basin experiments carried out in MOERI, KORDI. It is hoped to find out more physics in the wave energy conversion of the integrated OWC system through the comparisons.
The comparison of time histories of wave elevations in the
Fig. 7. Comparison of Pressure Drop against the Flow Rate for Dif-
ferent Facilities.
Fig. 8. Comparison of Pressure Drop against the Flow Rate for Dif- ferent Orifice Diameter.
Fig. 9. Schematic of OWC chamber.
chamber at the center point for (T=1.89s, Prototype T=5.0s) is shown in Fig. 11. It can be seen that the profiles of the wave crest are quite different from that of the wave trough in the experiments. The profiles of wave crest show the irregular characteristics, which may be induced by the irregular distribu- tion of the air pressure suppressing on the free surface. On the other hand, the profiles of the wave trough are more regular, and the amplitude is much higher than that of the wave crest.
Not only the profiles but also the amplitude, the wave eleva- tions derived from the numerical simulation are different from the experimental results. The amplitudes of the crest and trough show minor difference, and the positive amplitude are larger than the negative one. The profile shapes are more uniform than the experimental results.
Fig. 12 gives the comparison of time histories of air pres- sure difference in the chamber. The computational predictions show good agreement with the laboratory results. The negative amplitude is about 3 times of the positive amplitude. Comparing
with experimental results the variation of the positive ampli- tude contains a sharp peak in the numerical simulation and the negative profiles are similar with the experimental data. It also can be seen that the phase difference between two curves and the numerical result shift to the smaller λ/lf.
The comparison of time series of air flow velocity in the duct is illustrated in Fig. 13. It can be seen that the good agree- ment between the numerical and experimental results. Compar- ing with the pressure distribution, the positive amplitude is much larger than the negative amplitude. The phase shift phe- nomenon in the velocity variation also shows similar behavior with the air pressure variation, because the bi-directional air flows in the exhalation and inhalation are induced by the pos- itive and negative pressure difference.
All the above results demonstrate the evident effects of the orifice device which can induce the pressure drop, also can be utilized to show the effects of the air turbine on the operating performance. The effects of the pressure drop on the oscillat- ing amplitude of the wave elevation, the air pressure variation and bi-directional air flow should be seriously considered dur- ing the design and engineering applications.
Fig. 10. Geometry and grid structure.
Fig. 11. Comparison of time histories of wave elevation.
Fig. 12. Comparison of time histories of air pressure difference between two sides of the orifice device.
Fig. 13. Comparison of time histories of air flow velocity in the duct.
4. CONCLUSIONS
A numerical wave tank based on VOF model was estab- lished to generate the propagating waves. The OWC air chamber was than fixed at the end of the NWT. The present numerical model can predict the oscillation of the free surface, the varia- tion of the air pressure in the chamber, and air flow rate in the duct. It was concluded in general that the 3D numerical wave tank is a reasonably good prediction tool in the analysis of the OWC air chamber especially in the investigation of chamber- duct system.
The operating performance of the integrated OWC wave energy convertor system with the pressure drop induced by the air turbines are investigated in this paper.
The experimental investigation of the wave simulator dem- onstrates that the orifice devices can simulate the pressure drop effects induced by the impulse turbine. The corresponding results of the numerical simulation show that the present numeri- cal model using the orifice module can be embedded in the numer- ical wave tank to generate the pressure drop of the turbine.
The comparison between the numerical and experimental results of the OWC chamber with 0.48D illustrate that the numerical wave tank embedded with the orifice module can be employed to simulate the orifice effects on the OWC chamber operation. However, whether the orifice devices can be applied to investigate the real operation performance still needs more efforts and studies.
The numerical simulation within the orifice module will be performed to compare with the experimental data and validate its capability on the prediction of the real operating perfor- mance of the integrated OWC system. It can provide more valuable information for the engineers to design and optimize the OWC electricity plants.
ACKNOWLEDGMENTS
This research is financially supported by Korea Ocean Research
& Development Institute (Development of Wave Energy Utili-
zation System), and MKE of Korea through New & Renewable Energy R&D Program (No.20093021070010 and No.2009- 3020070020). All the support is gratefully acknowledged.
REFERENCES