Comparison of optical reflectance spectrum at blade and vein parts of cabbage and kale leaves
Viet-Duc Ngo
1, Dong-Ki Ryu
1, Sun-Ok Chung
1*, Sang-Un Park
2, Sun-Ju Kim
3, Jong-Tae Park
41
Department of Biosysytem Machine Engineering, Chungnam National University, Dajeon 305-764, Korea,
2Department of crop scienc, Chungnam National University, Dajeon 305-764, Korea,
3Department of Bio Environmental Chemistry, Chungnam National University, Dajeon 305-764, Korea,
4Department of Food Science and Technology Chungnam National University, Dajeon 305-764, Korea
Received on 30 December 2012, revised on 10 June 2013, accepted on 10 June 2013
Abstract : Objective of the study was to compare reflectance spectrum in the blade and the vein parts of cabbage and kale leaves. A total 6 cabbage and kale leaves were taken from a plant factory in Chungnam National University, Korea.
Spectra data were collected with a UV/VIS/NIR spectrometer (model: USB2000, Ocean Optics, FL, USA) in the wavelength region of 190 – 1130 nm. Median filter smoothing method was selected to preprocess the obtained spectra data. We computed reflectance difference by subtraction of averaged spectrum from individual spectrum. To estimate correlation at different parts of cabbage and kale leaves, cross - correlation method was used. Differences between cabbage and kale leaves are clearly manifested in the green, red and near – infrared ranges. The percent reflectance of cabbage leaves in the NIR wavelength band was higher than that of kale leaves. Reflectance in the blade part was higher than in the vein part by 18%. Reflectance difference in the different parts of cabbage and kale leaves were clear in all of the wavelength bands. Standard deviation of reflectance difference in the vein part was greater for kale, while the value in the blade part was greater for cabbage leaves. Standard deviation of cross – correlation increased from 0.092 in the first sensor (UV/VIS) and 0.007 in the second sensor (NIR) to 0.099 and 0.015, respectively.
Key words : Cabbage, Kale, Reflectance, Spectrometer, Reflectance Difference
*Corresponding author: Tel: +82-42-821-6712 E-mail address: [email protected]
I. Introduction
Remote sensing techniques are well–established non–instructive tools in assessing changes in the structure and function of ecosystems. Remote sensing of the optical properties of different cultural plant species subjected to stress factors gives the possibility to distinguish symptoms below the subjective level of detection and timely to mitigate the risk of their action. The spectral characteristics of vegetation are determined mainly by scattering and reflectance characteristics of the internal leaf structure and biochemical constituents (Krezhova et al., 2005).
A green leaf contributes photosynthesizing and yields a typical healthy green reflectance spectra with
strong leaf pigments in the blue and red regions, and a peak in reflectance in the green region of the visible spectrum. The high diffuse reflectance of the near – infrared (700 – 1200 nm) energy from plant leaves is due to the internal scattering at the cell wall – air interfaces within the leaf. A water vapor absorption band exists at 920 – 980 nm. Therefore, the optimum spectral region for sensing in the near – infrared region is believed to be 740 – 900 nm (Jensen, 2000).
Several studies have related spectral reflectance
with different crops (Gates et al., 1995; Liu et al.,
2011) evaluated the effect of difference in crop species
on singularity parameters. They selected rice, maize,
soybean and cabbage at mature growth stage. They
found that the spectral reflectance of different species
at a same growth stage showed different percentages
of reflectance. The difference between cabbage and
Fig. 1. Chinese cabbage and kale planted in a plant factory. Fig. 2. Photo of leaf measurement using the spectrometer.
kale leaves can be used to distinguish if the difference between the spectral reflection in certain wavelength regions from different plants can be recognised (Zwiggelaar, 1998).
Objective of the paper was to compare reflectance spectra in different parts between Chinese cabbage and kale leaves in visible and near – infrared wavelength bands.
II. Materials and Method
1. Cabbage and kale samples
Chinese cabbage and kale samples were taken from a plant factory in Chungnam National University, Korea. The number of samples used in spectra meas- urements were 6 including 3 cabbage leaves and 3 kale leaves. The samples were planted and cultivated under a 16/8-h day/night cycle and the same conditions of light source (Red : Blue : White = 11 : 4 : 3), CO
2(1000
± 100 ppm), temperature (20 ± 1℃), humidity (65 ± 5%), pH (6.0 ± 5) and (EC) electrical conductivity (1,200 ± 90 μS/cm). The samples selected for spectra measurements were healthy.
2. Spectra measurements
Reflectance spectra were measured at evenly dis- tributed 18 points (9 points in each blade and vein parts)
using a Jaz spectrometer (model: USB2000, Ocean Optics, FL, USA) in a dark external condition. Fig.
2 shows photo of leaf reflectance measurement using the spectrometer. The measured leaves did not remove from the plants. A light source constructed with a Deuterium – Tungsten Halogen (200 – 1000 nm) lamp was used for the spectra measurement. The spectrometer was consisted of two CCD detectors with the meas- urement ranges of 190 – 890 nm (UV/VIS) and 470 – 1130 nm (NIR), respectively. The resolution of reflectance spectra was about 0.38 nm. The spectra were collected using the software provided by the manufacturer. The spectra in the range of 400 – 1050 nm were used to build reflectance difference and correlation models due to excessive noise in other wavelength ranges.
The spectra measured at the 9 points on each part of each sample were averaged and then the mean spectrum was used as a representative spectrum of each sample leaf.
3. Data analysis
To reduce the noise, the original spectral data were preprocessed by median filter method with a 7 segment - size using the Unscrambler (ver. 9.7, CAMO Process AS, Norway) software package based on preliminary data analysis and results suggested by Suh et al.
(2012). Reflectance difference was computed by subtraction
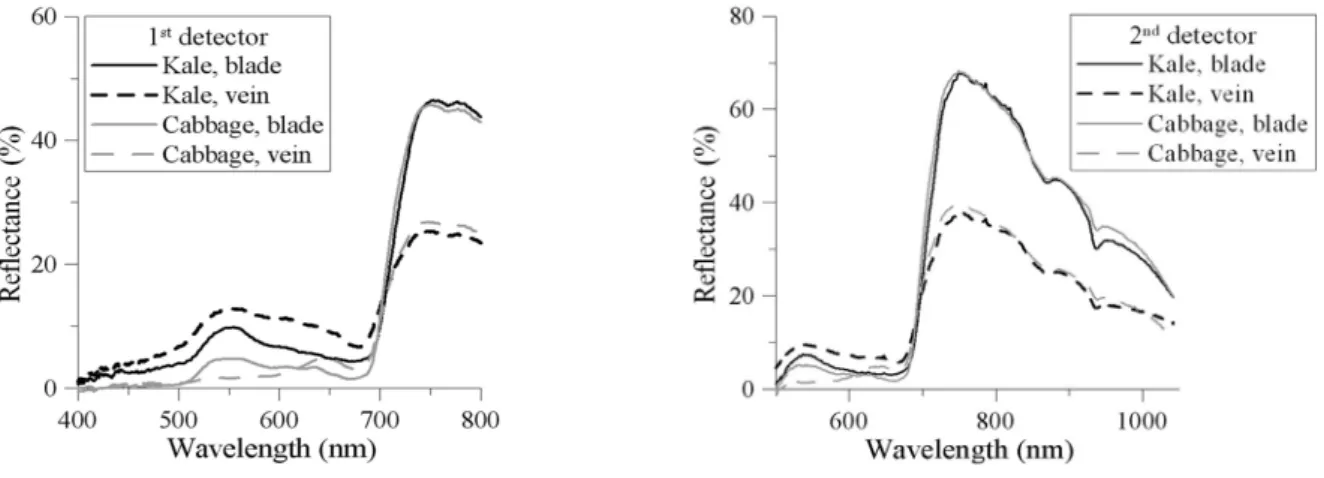
Fig. 3. Percentage reflectance of leaves measured by the spectrometer.
Fig. 4. Reflectance difference in the VIS and NIR wavelength bands.
of averaged spectrum from each spectrum. Cross cor- relation is a standard method of estimating the degree to which two series are correlated. A correlation analysis between the two parts of cabbage and kale leaves was computed by cross – correlation method using Matlab 7.10 (Mathworks, California, USA) to determine if the reflectance at each part of cabbage leaf was positively or negatively correlated with each part of kale leaf.
III. Results and Discussion
1. Leaf reflectance
Reflectance spectra of leaves between 400 – 1050 nm measured for cabbage and kale leaves are shown in Fig. 3. Percent reflectance of kale and cabbage
leaves in visible wavelength (VIS) were quite different.
As it could be seen, the differences between cabbage and kale leaves were clearly manifested within 520 - 580 nm, and 690 - 800 nm ranges. The highest reflectance of kale leaves in VIS wavelength were about 10% and 12% at the blade and vein parts, respectively, while the highest of cabbage leaves were about 5% at both of the blade and vein parts. However, the percent reflectance of cabbage leaves in NIR wavelength band was higher than that of kale leaves. Reflectance in the blade part was also higher than in the vein part by 18%.
2. Reflectance difference
The reflectance difference for each wave-band was
computed between averaged reflectance and each
reflectance as in the following equation (Hu et al., 2010).
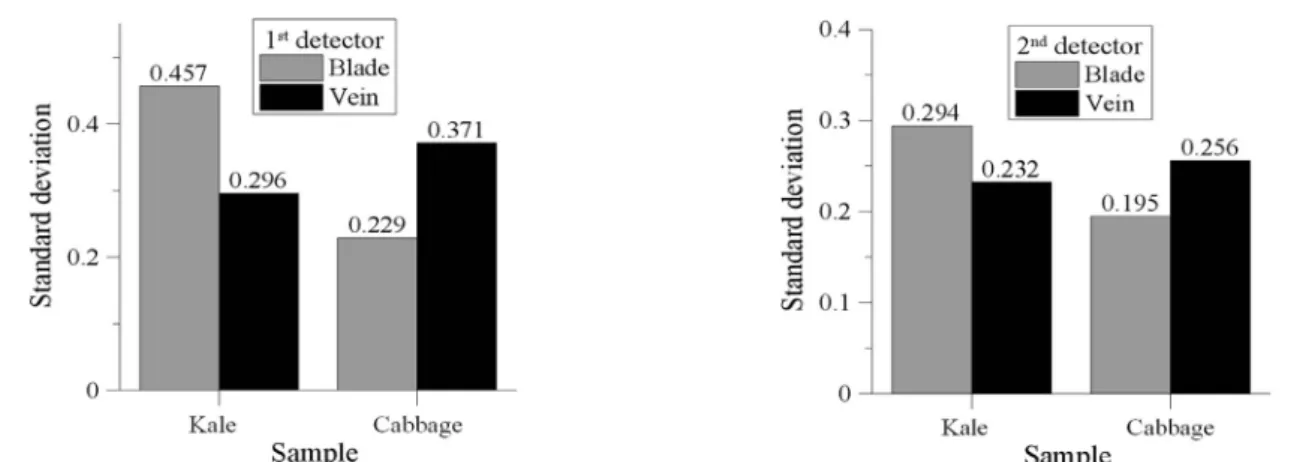
Fig. 5. Standard deviation of reflectance difference in the VIS and NIR bands.
Fig. 6. Standard deviation of cross – correlation of reflectance difference for the blade and vein parts.