Pre-processing of load data of agricultural tractors during major field operations
Myong-Jin Ryu
1, Md. Shaha Nur Kabir
2, Youn-Kug Choo
2, Sun-Ok Chung
2, Yong-Joo Kim
2, Jong-Kyou Ha
3*, Kyeong-Hwan Lee
41
Innovative Agricultural Machinery R&D Center, LS Mtron Ltd., Jeollabuk-Do, 565-902, Korea
2
Dept. of Biosystems Machinery Engineering, Chungnam National University, Daejeon, 305-764, Korea
3
Research Institute, Kukje Machinery Co., Ltd., Okcheon, Chungbuk-Do, 373-802, Korea
4
Dept. of Rural & Bio-Systems Engineering, Chonnam National University, Gwangju, 500-757, Korea Received on 27 February 2015, revised on 19 March 2015, accepted on 23 March 2015
Abstract : Development of highly efficient and energy-saving tractors has been one of the issues in agricultural machinery.
For design of such tractors, measurement and analysis of load on major power transmission parts of the tractors are the most important pre-requisite tasks. Objective of this study was to perform pre-processing procedures before effective analysis of load data of agricultural tractors (30, 75, and 82 kW) during major field operations such as plow tillage, rotary tillage, baling, bale wrapping, and to select the suitable pre-processing method for the analysis. A load measurement systems, equipped in the tractors, were consisted of strain-gauge, encoder, hydraulic pressure, and radar speed sensors to measure torque and rotational speed levels of transmission input shaft, PTO shaft, and driving axle shafts, pressure of the hydraulic inlet line, and travel speed, respectively. The entire sensor data were collected at a 200-Hz rate. Plow tillage, rotary tillage, baling, wrapping, and loader operations were selected as major field operations of agricultural tractors.
Same or different farm works and driving levels were set differently for each of the load measuring experiment. Before load data analysis, pre-processing procedures such as outlier removal, low-pass filtering, and data division were performed.
Data beyond the scope of the measuring range of the sensors and the operating range of the power transmission parts were removed. Considering engine and PTO rotational speeds, frequency components greater than 90, 60, and 60 Hz cut off frequencies were low-pass filtered for plow tillage, rotary tillage, and baler operations, respectively. Measured load data were divided into five parts: driving, working, implement up, implement down, and turning. Results of the study would provide useful information for load characteristics of tractors on major field operations.
Key words : Agricultural tractor, Field operation, Load data, Pre-processing method
*Corresponding author: Tel: +82-043-730-1640 E-mail address: [email protected]
I. Introduction
High-efficiency and high-performance machines are being developed in various industries. In agricultural machine sector, technology development has being rapidly progressed especially in high-efficiency and low-fuel consumption technology such as hybrid and electronic control technique (Ryu et al., 2013). Analysis of load in field operations is helpful for designing the motor output capacity and battery capacity of hybrid tractor. In general, design of major power transmission
parts may vary in working loads. Thus, studies of load measurement and analysis are required for development of new type tractor. Analysis of load during field operation is important for the development of major components and integrated tractors. Kim et al. (1998) measured load at the input shaft of the transmission and final drive shaft of the tractors attaching strain gauges on each axis, and the measured signal was acquired and stored via the wireless system through torque converters. The correlation coefficient between the measured signal and the generating load showed a high degree of accuracy of 0.99.
Mclaughlin and Heslop (1993) developed the tractor
instrumentation and data logging system to field test of agriculture tractor. The system had sensors for fuel consumption, engine speed, wheel speed, moving speed, weight of front and rear axle, and toque of front and rear axle. Besides, it had a converter to measure load at three-point hitch. The converter signals were stored in a data logging device after divided, amplified or filtered.
Tractor load can be largely divided into two parts:
drawbar load and PTO load. Kim et al. (2009) compared and analyzed the engine full load and drawbar load.
The torque load ratio increased from 20% to 80% with less than 5 km/hr pull speed and it was 80 to 110%
at speeds faster than 5 km/hr regardless of the pull speed. Kim et al. (2011) performed analysis of the power requirement on major operations of agricultural tractor. Power requirements at major operations (such as plow, rotary tillage, and loader operations) were analyzed during the total operation period and actual field operation period. Averaged power re- quirement for total operation and actual field operation were 17.5 and 23.1 kW at plow; 19.1 and 24.6 kW at rotary tillage; and 8.9 and 14.9 kW at loader operations, respectively.
Delivery of the measured data to the data acquisition system might be incomplete due to the generation of tractor’s vibration and noise, electrical impacts. Noise from the measurement system can make additional undesirable effects to the irregular distribution of data (Richard and Donald, 2010). Oh et al. (2011) removed white noise using wavelet transform to develop a diagnostic system in an engine-assembly line. Hansson et al. (2003) filtered torque signal with a fifth order Butterworth digital low–pass filter before it was used as input for the calculations of the fuel efficiency. The cut–off frequency for the low–pass filter was defined so that the transients caused by the system after the transducer was not reduced, but the variations at each combustion cycle in the engine were eliminated. At an idle engine speed of 900 rpm,
30 power strokes were performed each second, and an upper limit for the cut–off frequency was 30 Hz. Kim (2012) measured the transmission shaft torque and performed pre-processing of that data using the discrete Kalman filter. RMS value of measured data and designed data was 6.7 Nm, which means that it was very effective to remove random noise in time domains. Therefore, the pre-processing of data is required for efficient analysis before performing the load analysis. It is possible to perform efficient analysis through pre-processing such as outlier removal, filtering, and work division. The purpose of this study was to perform pre-processing procedures (outlier removal, low-pass filtering, and data division) to the major field operations (plow tillage, rotary tillage, baling, bale wrapping, and loading) data of agricultural tractors (30, 75, and 82 kW) for better analysis of tractor load data.
II. Materials and Methods
1. Load data measurement
A load measurement system was equipped in the
tractors (30, 75, and 82 kW). The measurement system
was equipped with three 8-channel data acquisition
unit (QuantumX MX840, HBM, and Germany), which
enable to measure 18 signals. Torque at the four wheel
shafts, transmission, and PTO input shaft were
measured using strain gauge (CEA-06-250US-350,
Micro Measurement Co., USA). Experiments were in
triplicate. Rotational speed was measured by an
encoder (60 pulse encoder) embedded in the slip ring
(SR-10M/E60, MI-Scientific Co., USA). The pressures
of the hydraulic main and auxiliary pump were measured
using a pressure sensor (P6A, HBM, Germany). Flow
rates were calculated by using the rotational speed
and theoretical discharge rates of each pump. Fuel
consumption at the engine was measured by a flow
meter (M05, NURITECH, Korea) which was installed
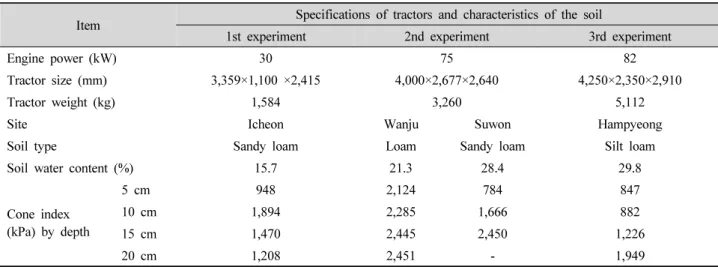
Table 1. Specifications of the tractors and characteristics of the soils used for the experiment
Item Specifications of tractors and characteristics of the soil
1st experiment 2nd experiment 3rd experiment
Engine power (kW) 30 75 82
Tractor size (mm) 3,359×1,100 ×2,415 4,000×2,677×2,640 4,250×2,350×2,910
Tractor weight (kg) 1,584 3,260 5,112
Site Icheon Wanju Suwon Hampyeong
Soil type Sandy loam Loam Sandy loam Silt loam
Soil water content (%) 15.7 21.3 28.4 29.8
Cone index (kPa) by depth
5 cm 948 2,124 784 847
10 cm 1,894 2,285 1,666 882
15 cm 1,470 2,445 2,450 1,226
20 cm 1,208 2,451 - 1,949
at fuel supply hose. Radar speed sensor (Rader sensor 3, DICKEY-John, USA) was used to measure the working speed at the under the bonnet, centered at the front axle. Temperatures of fuel, transmission, oil, and ambient were measured by a thermocouple (T-type).
Table 1 shows the three types of tractor and soil specification information for each test site. Experiments with 30 kW and 75 kW tractors were performed in 3 places such as Icheon, Wanju, and in Suwon; whereas experiments with 82 kW tractor were only in Hampyeong, Jeollanam-do, Korea.
Plow tillage, rotary tillage, baling, wrapping, and loader operations were selected as the major field operations of agricultural tractors. Load data at the transmission input shaft, PTO input shaft, main hydraulic pump, and axillary hydraulic pump were measured three times. Field operations were carried out by setting different driving levels in each experiment of load measuring tractor. In the small power (30 kW) tractor experiments the engine speed and driving speed were set to 2,600 rpm and 3 km/h, respectively for plow tillage, rotary tillage, and loader operation. Each operation was carried out on working level 1. At the other powers (75 kW and 82 kW) experiments, transmission and PTO speeds were selected through interviews with farmers. Load measurement were carried out for plow tillage, rotary
tillage, baling operations, and wrapping operation on level 2, level 4, level 4, and level 1, respectively in the experiment with 75 kW tractor. At 82 kW tractor plow tillage, rotary tillage, and baling operations were performed on level 3, level 4, and level 4, respectively. Table 2 shows type of field operations, levels of travel, and PTO speed of tractors.
The specifications of the equipment used as attachment to each type tractor are shown in Table 3.
In the first experiment with 30 kW tractor, plow (TS-6P, Young Shin Co., Korea) with six blades run round and rotary (R175MG, LS Machinery Co., Korea) equipped with the L-shaped blade were used. In the second experiment with 75 kW tractor, plow (SW- PS2408, Sewoong Machinery Co., Korea) with eight blades, rotary (WJ230E, Woongjin Machinery Co., Ltd., Korea), baler (F550, MCHale Engineering Ltd., Ireland), wrapping machine (RF1500, ELHO Co., Netherlands) were used. In the third experiment with large capacity 82 kW tractor, plow and rotary were same as second experiment, but baler (RF2135, Vicon Co., Norway) was different with working width of 2,100 mm.
2. Pre-processing of load data
Pre-processing was performed to remove noise and
Table 2. Travel and PTO speeds of the agricultural tractors used in the experiment.
Operation Level of travel and PTO speed
1
stexperiment 2
ndexperiment 3
rdexperiment
Plow tillage 3 km/h* L3 (3.77 km/h)
L4 (5.41 km/h)
L2 (2.64 km/h) L3 (3.77 km/h) L4 (5.41 km/h)
Rotary tillage 3 km/h
L1P1 (1.87 km/h, 585 rpm**) L1P2 (1.87 km/h, 756 rpm) L2P1 (2.64 km/h, 585 rpm) L2P2 (2.64 km/h, 756 rpm)
L1P1 (1.87 km/h, 585 rpm) L1P2 (1.87 km/h, 756 rpm) L2P1 (2.64 km/h, 585 rpm) L2P2 (2.64 km/h, 756 rpm)
Baler operation 3 km/h
L4P1 (5.41 km/h, 585 rpm) L4P2 (5.41 km/h, 756 rpm) M1P1 (5.11 km/h, 585 rpm) M1P2 (5.11 km/h, 756 rpm)
L2P1 (2.64 km/h, 585 rpm) L2P2 (2.64 km/h, 756 rpm) L3P1 (3.77 km/h, 585 rpm) L3P2 (3.77 km/h, 756 rpm) L4P1 (5.41 km/h, 585 rpm) L4P2 (5.41 km/h, 756 rpm)
Wrapping operation - H1 (13.08 km/h) -
Loader operation 3 km/h - -
* Driving speed
** PTO rotational speed
Table 3. Specifications of the implements used for the experiments.
Operation
Implement specifications
Model Size
(mm)
Weight (kg)
Working width
(mm) Comments
Plow tillage
TS-6P
(Taesung, Korea) 2,180×1,870×1,200 484 1,900 2×3 blades
SW-PS2408
(Sewoong, Korea) 2,395×2,420×1,165 502 2,488 2×4 blades
Rotary tillage
WJ175A
(Woongjin, Korea) 900×1,950×1,020 395 1,750 7×6 blades
WJ230E
(Woongjin, Korea) 1,050×2,580×1,380 815 2,320 9×6 blades
Baling F550
(MCHale, Ireland) 4,050×2,550×2,450 3,500 1,230 18 rollers
RF 2135
(Vicon, Norway) 4,600×2,540×2,450 2,950 2,100 Net wrapping
Wrapping RF1500
(ELHO, Nethelands) 2,500×2,100×2,650 820 Bale 1500 Cable control
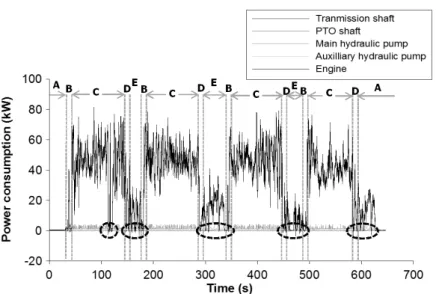
thereby improve analysis of data. Among the methods, outlier removal, filtering, and data discretization were employed to make minimize the changes of load data and make the data analysis easier. Fig. 1 shows the power profile when a 75 kW tractor carries out plow tillage. The negative data were considered as outliers and should be removed or changed for effective data analysis. It was difficult to carry out
the analysis of the time domain due to severe degree of changes in power consumption data of the transmission shaft and engine. This processing of the data does not affect the natural frequency. Various degree of required power was confirmed over time.
Because this data contained both the data of plowing
operation and the driving and turning operations
those were not preceded the operation. Therefore,
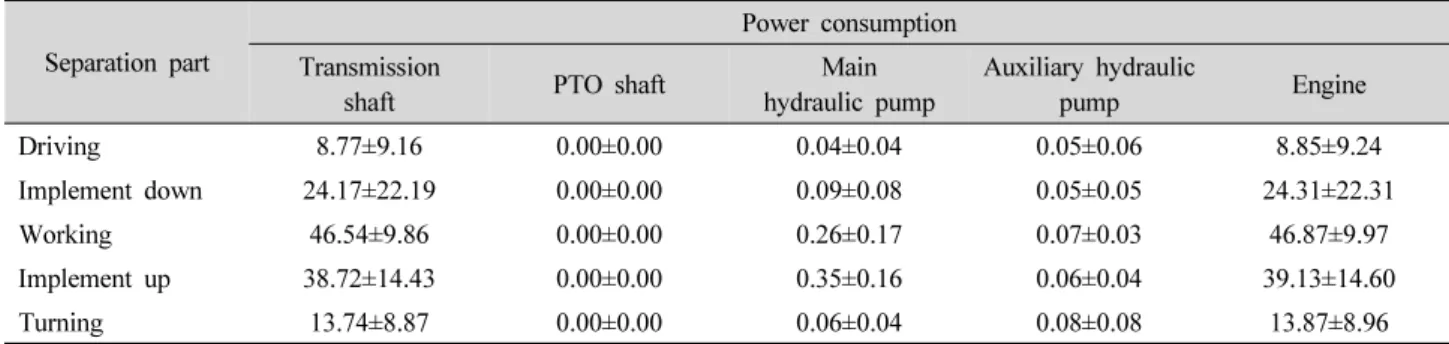
Fig. 1. Outlier and data separation of power consumption of major devices: (A) Driving, (B) Implement down, (C) Working, (D) Implement up, (E) Turning.
separation of the whole period is necessary for the analysis and comparison of data.
(1) Removal of outliers
The load measurement system used in the experiments was designed for measurements in the field. The internal issues such as the output characteristics of the sensor and measurement device, and external problems such as vibration and noise of tractor occurred during the field operations, resulting in creating invalid data. Since there were data beyond the scope of the measuring range of the sensor and a severe change of power and load factor data, the correlation check used was to determine the presence of outliers. The data to be an outlier was removed or processed with different values that does not change the characteristics within the range of the data pattern according to type and load factor of the field operations. After removal of outliers in the time domain and frequency domain, the results were compared (average, maximum, minimum, and deviations).
(2) Filtering
White noise is one of the typical background noises which are the outputs of all frequencies within a certain frequency range (Yun and Bae, 2012). The load
data was measured with 20 Hz sampling speed for 30 kW and 82 kW tractor, and 200 Hz sampling speed for 75 kW tractor. Torque and pressure signal were transferred to analog input channels with sampling rate of 19.2 kHz and resolution of 24 bit per channel.
And, rotational speed of the engine and four-axle were transferred to digital input channels with sampling rate of 1 MHz. Generally, the white noise is present in the speed range; thus it can be measured within the sampling rate. Filtering these noises was necessary not to affect the frequency analysis. There are several filtering methods in the frequency domain: high-pass filtering, low-pass filtering, and band-pass filtering. The unnecessary components should be removed to evaluate the frequency characteristics. Therefore, low-pass filtering was performed for removal of noise where less characteristics change of load data were available.
For selecting the excluded frequency, the characteristics
of power transmission was considered for each load
data and must be applied while considering the engine
rotation speed as 2600 rpm as it was required to select
the excluded frequency more than 86.6 Hz because of
losing the load characteristics according to the
rotation of axis excluding 86.6 Hz less frequency. In
addition, the frequency over 33.2 Hz was selected for
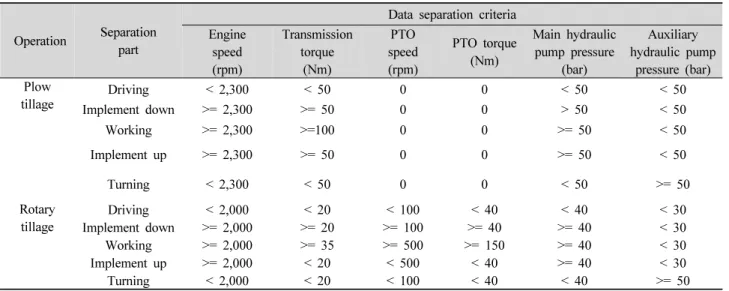
Table 4. Data separation criteria for the 75-kW tractor (Example).
Operation Separation part
Data separation criteria Engine
speed (rpm)
Transmission torque
(Nm)
PTO speed (rpm)
PTO torque (Nm)
Main hydraulic pump pressure
(bar)
Auxiliary hydraulic pump
pressure (bar) Plow
tillage
Driving < 2,300 < 50 0 0 < 50 < 50
Implement down >= 2,300 >= 50 0 0 > 50 < 50
Working >= 2,300 >=100 0 0 >= 50 < 50
Implement up >= 2,300 >= 50 0 0 >= 50 < 50
Turning < 2,300 < 50 0 0 < 50 >= 50
Rotary tillage
Driving < 2,000 < 20 < 100 < 40 < 40 < 30
Implement down >= 2,000 >= 20 >= 100 >= 40 >= 40 < 30 Working >= 2,000 >= 35 >= 500 >= 150 >= 40 < 30
Implement up >= 2,000 < 20 < 500 < 40 >= 40 < 30
Turning < 2,000 < 20 < 100 < 40 < 40 >= 50
the PTO shaft. For the load of PTO shaft, the excluded frequency was selected considering the rpm until the generated power was delivered from the engine to the PTO shaft but the frequency over 60 Hz was selected for rotary tilling and the frequency over 66 Hz was selected for baling operation while considering the gear ratio of the PTO shaft and working machine, the number of working days etc.
(3) Distribution of working area
The largest load occurred during the field operations of tractor and various load characteristics of the major powertrains were found and the degree of variations of the load was very large. At each working operation, the load characteristics generated at the main power devices appeared differently. For the development of load simulation, it was required to separate the working operations and analyze their characteristics of load.
In general, the working operation of tractor is classified into driving, turning, working process. In this study, the classification criteria were designed to classify the driving section of load data. The classification criteria were varied according to tractor capacity, type of operation, driving level. For plow tilling, the number of engine revolution, torque of
auxiliary pump were considered. PTO speed and torque were only considered in rotary tillage and baling operation. Table 4 shows the data parameters to a 75 kW tractor at plow tillage and rotary tillage.
III. Results and Discussion
1. Pre-processing of load data
(1) Removal of outliers
Outliers were confirmed from the load data those were out of driving range of power unit and found with incorrect changes while considering the before and after data of other power units, and the data showed the same value without any changes were considered as outliers and such types of data were removed.
The negative values at the power transmission were
found in all field operations. These values were
generated due to the vibration or the backward
movement during travelling. Considering the real
situation and for the further analysis at time domain,
these values were changed to 0. Similar to other
operations, the transmission shaft torque data was
confirmed below 0 for rotary tilling and was not
processed as 0 but changed to a suitable value after
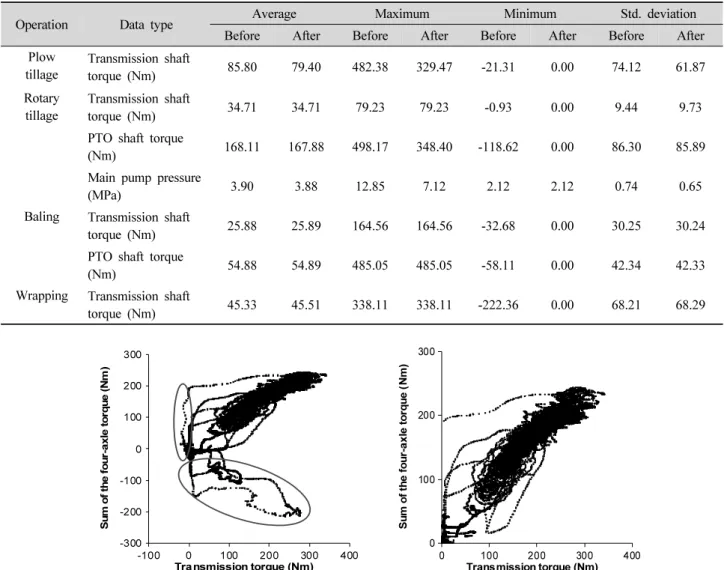
Table 5. Comparison of basic statistics before and after outlier removal for the load data of the 75 kW tractor
Operation Data type Average Maximum Minimum Std. deviation
Before After Before After Before After Before After
Plow tillage
Transmission shaft
torque (Nm) 85.80 79.40 482.38 329.47 -21.31 0.00 74.12 61.87
Rotary tillage
Transmission shaft
torque (Nm) 34.71 34.71 79.23 79.23 -0.93 0.00 9.44 9.73
PTO shaft torque
(Nm) 168.11 167.88 498.17 348.40 -118.62 0.00 86.30 85.89
Main pump pressure
(MPa) 3.90 3.88 12.85 7.12 2.12 2.12 0.74 0.65
Baling Transmission shaft
torque (Nm) 25.88 25.89 164.56 164.56 -32.68 0.00 30.25 30.24
PTO shaft torque
(Nm) 54.88 54.89 485.05 485.05 -58.11 0.00 42.34 42.33
Wrapping Transmission shaft
torque (Nm) 45.33 45.51 338.11 338.11 -222.36 0.00 68.21 68.29
-100 0 100 200 300 400
Transmission torque (Nm) -300
-200 -100 0 100 200 300
Sum of the four-axle torque (Nm)
0 100 200 300 400
Transmission torque (Nm) 0
100 200 300
Sum of the four-axle torque (Nm)