1)
1. Introduction
The Democratic Socialist Republic of Sri Lanka is an Asian country with a total area of 65,610 km2 (62,705km2 of land and 2,905km2 water). It is comprised of a variety of land forms
†To whom correspondence should be addressed.
Department of Civil and Environmental Engineering, Kongju National University, Cheonan, Chungnamdo, South Korea.
E-mail: [email protected]
ranging from flat planes to valleys, plateaus, and mountains with a peak elevation of 2,524m above sea level. The coastal lowland areas can be characterized by small to flat slopes with maximum elevations reaching up to 270m above sea level.
Upland areas were primarily made up of ridges and valleys with elevations reaching 1,060m above sea level, whereas the highest peaks located at the central part of the island have a mean elevation of 2,420m above sea level (De Silva, 1988).
Most of Sri Lanka’s river networks form a radial pattern
Development of Climate Change Adaptation Plan for Kurunegala City, Sri Lanka
N. J. D. G. Reyes・H. N. Cho*・F.K.F. Geronimo・M.S. Jeon・L. H. Kim†
Department of Civil and Environmental Engineering, Kongju National University, Cheonan, Chungnamdo, South Korea
*Korea Adaptation Center for Climate Change, Korea Environment Institute, Sejong City, South Korea
스리랑카 Kurunegala시의 기후변화 적응 계획 개발
N. J. D. G. Reyes・조한나*・F.K.F. Geronimo・전민수・김이형† 충청북도 천안시 공주대학교 토목 환경 공학과
*한국환경정책평가 연구원
(Received : 25 October 2019, Revised: 12 November 2019, Accepted: 12 November 2019)
Abstract
Sri Lanka is an island nation susceptible to climate-related disasters and extreme weather events. Kurunegala City is the developing capital city of the North-Western Province of Sri Lanka. Changes in rainfall patterns and a steadily increasing annual average temperature amounting to 0.69±0.37°C were observed in the city area. Generally, urban areas are at risk due to the lack of climate change adaptation provisions incorporated in the development plans. This study was conducted to investigate the characteristics of Krunegala City, Sri Lanka and develop an appropriate climate change adaptation plan for the city. Site investigation and qualitative risk assessment were conducted to devise a plan relevant to the climate change adaptation needs of the city. Qualitative risk analyses revealed that drinking water, water resources, and health and infrastructure risks were among the major concerns in Kurunegala City. Low impact development (LID) technologies were found to be applicable to induce non-point source pollutant reduction, relieve urban heat island phenomenon, and promote sound water circulation systems. These technologies can be effective means of alleviating water shortage and reducing urban temperature. The measures and strategies presented in this study can serve as reference for developing climate change adaptation plans in areas experiencing similar adverse effects of climate change.
Key words : Climate change adaptation, LID, Sri Lanka, water circulation
요 약
스리랑카는 지리적으로 섬으로 형성된 국가로 기후변화에 민감한 나라이다. Kurunegala시는 2009년부터 2019년까지 약 11년 동 안 도심지 내 연평균 기온이 0.69±0.37°C로 꾸준하게 증가하였으며, 강우패턴도 변화하고 있다. 그러나 도시 개발 계획시 기후 변화 및 기후재난에 대한 규정이 미흡하여 인적 및 물적 피해가 우려되고 있다. 따라서 본 연구는 스리랑카 Kurunegala시의 인문 학적 및 자연적 특성을 조사분석하고 기후변화 적응에 대한 방안을 수립하기 위하여 수행되었다. Kurunegala시의 기후변화 적응 방안은 기후변화에 대한 정성적 위험 평가를 수행하여 개발하였다. 정성적 위험평가 결과 Kurunegala시의 주요 문제점은 음용수, 수자원 및 건강 관련 인프라로 분석되었다. 물부족 및 도시 내 온도를 완화하기 위한 방안으로는 기존 사회인프라에 비점오염저감, 도시 열섬현상 저감 및 건전한 물순환 체계 구축 등 다양한 효과를 유도하는 저영향개발기술(Low Impact Development, LID)의 적용이 효과적인 것으로 나타났다. 본 자료는 Kurunegala시와 같이 기후변화에 따른 물문제를 안고 있는 도시의 물문제 해결에 활용될 수 있다.
핵심용어 : 기후변화, 저영향개발, 스리랑카, 물순환 체계
originating from the central highlands and mountainous areas (FAO, 2012). Aside from the vast rivers and stream networks, lakes and man-made tanks are among the major surface water bodies in the country.
The climate of Sri Lanka can be described as tropical in nature. Generally, the climate can be affected by the complex geographic features such as mountainous areas, hills, and flat planes within the country. Rainfall events in Sri Lanka were mainly characterized as monsoonal, convectional, and depressional. At southeastern and northwestern parts, annual average rainfall depth was observed to be <900mm, whereas the western slopes of the central highlands can receive annual mean rainfall depths >5,000mm. Sri Lanka’s climate can be further subdivided into four distinct seasons namely: first inter-monsoon season (FIMS), southwest-monsoon season (SWMS), second inter-monsoon season (SIMS), and northeast-monsoon season (NEMS). FIMS is dominant during the months of March and April, characterized by rainfall depths varying from 100mm to 250mm across the island. Cooler temperatures and rainfall depths ranging from 100mm to 3,000mm can be experienced for the months of May to September due to SWMS. Among the four seasons, SIMS can be highly influenced by tropical depressions and cyclones in the Bay of Bengal, resulting to strong winds and widespread rain exceeding 400mm during the months of October and November. From December to February, dry and cold wind prevails in the region due to NEMS. Moreover, mountain ranges experience the highest rainfall depths, whereas western coastal areas receive low amounts of rainfall (Department of Meteorology – Sri Lanka, 2019).
Climate change is a global trend affecting the lives of many people. Manifestations of climate change can be marked by the occurrence of extreme weather events (i.e typhoon and drought), sea level rise, and increase in air temperature. The geographic location of Sri Lanka can significantly affect its susceptibility to the impacts of climate change. Eckstein et al., 2018 developed a global climate risk index to assess the vulnerability of countries to extreme weather conditions based on different indicators. Based on the report, Sri Lanka ranked as the second nation most affected by climate-related disasters.
This study mainly focused on the evaluation of climate change scenarios in Sri Lanka. Specifically, qualitative risk assessment was conducted to identify the risks and risk factors affecting water scarcity and heat stress in Kurunegala City. Ultimately, adaptation plans were developed based on Kurunegala City’s water and wastewater management needs.
2. Materials and Methods
2.1 Site Selection and Description
Kurunegala City is the capital of Kurunegala District and the Northwest Province of Sri Lanka covering an administrative area of 11km2. Based on the 2012 census data, the city has a total population of 38,000 with a population density of 53 people/ha in built up areas. The general topography of the city can be described as a plain area surrounded by rock outcrops, in which the northern section is slightly higher as compared to the southern part (Ruzaik, 2011). The city is situated at the intermediate climatic zone and experience low-country
Fig. 1. Location map of Kurunegala City
climatic condition. As shown in Figure 1, Kurunegala City is an essential part of the Upper Deduru Oya Basin. Since the city is located on the upstream portion of the river network, it is very important to manage the pollutant sources in the area to maintain a pleasant water quality in the downstream sections. Moreover, water resources management in the upstream areas is also essential to ensure efficient allocation and water availability on downstream regions (Munia et al., 2016). Kurunegala City also serves as the main access of the Northern Province to the capital city of Colombo. Its location makes the city a strategic area for economic growth and development. The development of Kurunegala as a smart city is beneficial to the adjacent districts. By making the city a pioneer for sustainable urban development, similar programs can also be implemented on other areas which are gravely affected by climate change.
2.2 Qualitative risk assessment
Climate change can amplify environmental risks and hazards.
Generally, risk assessment pertains to the process of identifying and describing risks and risk factors that can potentially cause
a negative impact in the society, environment and economy.
It can be classified as qualitative or quantitative in nature.
Quantitative assessment mainly deals with numerical probabilities, whereas qualitative assessment focuses mainly on descriptive methodologies (Dufour et al., 2011; Adger et al., 2018). Both assessment tools are equally valid; however, qualitative risk assessment was used in this study due to the lack of data needed to conduct the quantitative risk assessment.
The assessment conducted mainly focused on water scarcity and heat stress in Kurunegala City as identified by the council members and field observation.
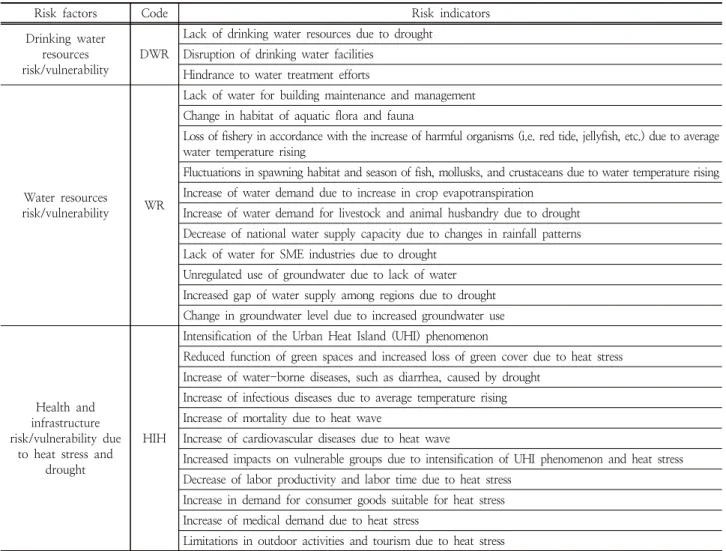
A detailed list of indicators was used to identify the risks in Kurunegala City. The list of indicators presented in Table 1 was developed by the Kurunegala Municipal Council (KMC) by modifying the checklist used in South Korea. Overall, seven indicators and 57 risk factors were selected by KMC as relevant to the climate change scenarios in the study area. DWR and WR mainly focus on water availability due to natural causes or anthropogenic activities leading to water scarcity. HIH and SF were driven by factors related to health and sanitation.
Specifically, heat stress and sanitation issues resulting to human
Table 1. List of indicators and risk factors for qualitative risk assessment
Risk factors Code Risk indicators
Drinking water resources risk/vulnerability
DWR
Lack of drinking water resources due to drought Disruption of drinking water facilities
Hindrance to water treatment efforts
Water resources
risk/vulnerability WR
Lack of water for building maintenance and management Change in habitat of aquatic flora and fauna
Loss of fishery in accordance with the increase of harmful organisms (i.e. red tide, jellyfish, etc.) due to average water temperature rising
Fluctuations in spawning habitat and season of fish, mollusks, and crustaceans due to water temperature rising Increase of water demand due to increase in crop evapotranspiration
Increase of water demand for livestock and animal husbandry due to drought Decrease of national water supply capacity due to changes in rainfall patterns Lack of water for SME industries due to drought
Unregulated use of groundwater due to lack of water Increased gap of water supply among regions due to drought Change in groundwater level due to increased groundwater use
Health and infrastructure risk/vulnerability due
to heat stress and drought
HIH
Intensification of the Urban Heat Island (UHI) phenomenon
Reduced function of green spaces and increased loss of green cover due to heat stress Increase of water-borne diseases, such as diarrhea, caused by drought
Increase of infectious diseases due to average temperature rising Increase of mortality due to heat wave
Increase of cardiovascular diseases due to heat wave
Increased impacts on vulnerable groups due to intensification of UHI phenomenon and heat stress Decrease of labor productivity and labor time due to heat stress
Increase in demand for consumer goods suitable for heat stress Increase of medical demand due to heat stress
Limitations in outdoor activities and tourism due to heat stress
health and well-being are the primary indicators for these factors. WM primarily highlights the effects disrupted water supply operations in the economy. Climate change-related water management concerns arise from damaged water transmission lines due to flooding, inadequate water source as a result of extended drought periods, and deterioration of water supply facilities. Whereas HF is connected human health problems, WQAE is a manifestation of risks for the aquatic ecosystem due to polluted water bodies and temperature rise.
Risk factors were analyzed to determine the priority or primary considerations for devising a climate change adaption plan. A survey questionnaire prepared by the Korea Environment Institute was developed to evaluate the weights
of each risk factor. The answers of 35 respondents, composed of climate change adaptation experts from KMC, were considered to formulate an effective climate change adaptation plan for Kurunegala City. Risk factors were ranked based on the scores calculated by combining the effects of likelihood and consequences of the risk indicators. The detailed calculation for evaluating the risk indicators was presented in Equation 1.
Risk (Score) = L × C (1)
Where,
L = likelihood or probability that an event may occur C = consequence or impact of a specific event
Risk factors Code Risk indicators
Sanitation risk/vulnerability due to
drought and flood
SDF
Increase of water-borne diseases Sewage overflow
Lack of water for sanitary/toilet usage
Water management resources risk/vulnerability
WM
Disruption and functional degradation of river facilities (i.e. embankment, bridge, etc.) Influence on the operation of waterworks facilities (i.e. less access to operational mechanism) Economic loss due to interruption of transportation and industries related to rivers and canals Increase of damaged irrigation facilities due to flood
Increase of assets loss due to increased flood frequency
Damage to drainage facilities (i.e. storm sewer system, etc.) due to increase in urban sediment drainage and high water volume
Increased cost risk due to lack of industrial water and water treatment leading to water quality deterioration Drying streams and water bodies (natural and artificial) due to drought
Decreased safety and deterioration of water supply facilities Change in flooding occurrence and floodplains
Increased frequency of drought due to persistent non-precipitation days
Health risk/vulnerability to
flood
HF
Increase of mortality rate due to disaster Increase of injury rate due to disaster
Lack of governing bodies focused on the health of vulnerable groups (i.e. infants and the elderly) Increase of medical demand due to disaster and lack of medical supply
Increase of water-borne diseases (i.e. typhoid, cholera, bacterial heterogeneity, etc.) through water and food Increasing health problems (i.e. falls, trauma, etc.) due to safety accidents associated with flooding Increase of vector-borne diseases
Water quality and aquatic ecosystem risk/vulnerability
WQAE
Water quality deterioration due to pathogenic bacteria prompted by temperature rising
Increase of water pollution risks due to excessive inflow of pollutants (i.e. living sewage, industrial wastewater, etc.) prompted by heavy rainfall
Fluctuations in water ecology according to changes in rainfall patterns Water quality deterioration due to changes in rainfall patterns
Increase of algal blooms and deterioration of aquatic ecosystem due to average water temperature rising Increase of diseases and occurrence of new pathogenic microorganisms due to water temperature rising Accelerated extinction of endangered species and endemic species as a result of climate change
Increase of effluence containing fertilizer, pesticides and animal wastes in accordance with rainfall intensification Increase of alien invasive species
Fluctuations in species composition and spawning season of fish
Fluctuations in species composition and spawning season of mollusks and crustaceans
2.2 Climate change analyses and formulation of climate change adaptation plan
Historical climate data were gathered from World Weather Online open source data platforms. Supporting data conducive to the analysis of climate change propagation in Kurunegala City were obtained from related studies, reports, and government agencies. The adaptation plan for Kurunegala City was based on the result of qualitative risk assessment. Site investigation was also conducted to identify constraints and current environmental condition in the study area. In order to improve water circulation and mitigate the effects of climate change in the area, the feasibility of applying LID facilities in Kurunegala City was also assessed.
3. Results and Discussion
3.1 Land use and land-use changes (LULUCs) The development in Kurunegala City was characterized by rapid urban and semi-urban expansion. As shown in Figure 2, urban areas were concentrated at the central portion of the city on the year 2001. After almost a decade, western and southern areas in the city started to develop and by the year 2017, the urban establishment reached the city boundaries.
Urban and semi-urban areas constitute approximately 65%
(7.11 km2) of Kurunegala City’s total land area as of 2017, corresponding to a 231% increase in built-up areas over the period of 16 years. This can be attributed to the intensive investments made on urban infrastructures and roadways connecting the city to other parts of the region. The detailed statistics of the urban expansion rate of Kurunegala City was summarized in Table 2. Consequent to urban area expansion, the percentage of non-built-up areas declined over the years.
Table 2. Urban expansion rate in Kurunegala City
Category Area, km2
2001 2012 2017
Urban 1 (9.09) 2.38 (21.64) 3.54 (32.18) Semi-urban 1.15 (10.45) 2.32 (21.09) 3.57 (32.45) Non-built 8.27 (75.18) 5.72 (52.00) 3.31 (30.09) Water 0.58 (5.27) 0.58 (5.27) 0.58 (5.27) Note: Values in the parentheses indicate percentage of the total area
Urbanization also prompted the migration of people into the city, creating more residential complexes and commercial establishments, thereby increasing demands for local water use.
The current water demand in the city is 8,500 m3/day, with over two-fold projected increase by the year 2030. Generally, the combined the effects of population growth and alteration of water cycle and circulation can lead to water scarcity problems in Kurunegala City.
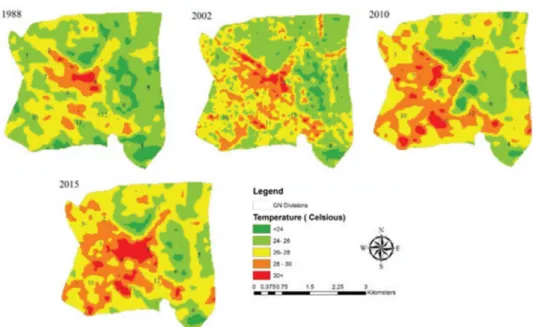
Apart from inadequate water supply, urban landscapes can also suffer from UHI phenomenon. According to the United States Environmental Protection Agency (USEPA), the temperature in a city can be 1°C to 3°C higher than its surrounding areas. This can lead to compromised human health and comfort, impaired water quality, increased energy consumption for cooling, and elevated emissions of air pollutants and greenhouse gases from cooling agents (USEPA, 2019). The spatial land surface temperature of Kurunegala City was presented in Figure 3. It can be noted that the areas exposed to higher temperatures expanded over the years.
Pavements reflect higher amount of solar radiation as compared with natural grassed surface and thus, result to higher temperature in the surrounding area (Ibrahim et al., 2018).
Increasing population density can also be a factor affecting
Fig. 2. Changes in the urban landscape of Kurunegala City (Adapted from Government of the Democratic Socialist Republic of Sri Lanka, 2018)
the development of UHI phenomenon in Kurunegala City.
Population growth can directly influence elevated temperature levels due to increased anthropogenic activities that generate heat (i.e. vehicular traffic, machineries, power generation).
3.2 Changes in climate patterns
The trend of average air temperature in Kurunegala was exhibited in Figure 4a. The highest mean monthly temperature was observed during the month May (26.82°C), whereas
relatively-cooler temperature was experienced on January (23.45°C). Generally, warmer environment was noted in Kurunegala City as indicated by the 0.69±0.37°C increase in annual average ambient air temperature. In the year 2016, the mean annual temperature in Kurunegala was 25.92°C, which is 0.08°C to 1.25°C higher as compared with the previous years. As illustrated in Figure 4b, only 458mm of cumulative rainfall was experienced in Kurunegala on the year 2016. This value was 49% lower as compared with the Fig. 3. Variation in land surface temperature of Kurunegala City from 1988-2015 (Adapted from Sanjeewani & Manawadu, 2016)
24.8 25 25.2 25.4 25.6 25.8 26
Temperature, C
Year
Temperature Trend Mean Temperature
(a)
0 5 10 15 20 25 30 35 0
200 400 600 800 1000 1200 1400
January 2009
January 2010
January 2011
January 2012
January 2013
January 2014
January 2015
January 2016
January 2017
January 2018
January 2019
Wet days
Rainfall depth, mm
Date
Wet days Rainfall depth Rainfall trend
(b)
Fig. 4. Climate patterns of Kurunegala (2009 to 2019): a) Temperature trends and b) rainfall patterns
decadal average rainfall experienced in Kurunegala. Further analysis indicated that rainfall depth has low correlation (r
= 0.53) with the number of wet days, implying the presence of extreme weather events for the past 11 years of data collection.
Several sectors are affected by the changes in rainfall patterns and increasing temperature, especially in a densely-populated area like Kurunegala City. The agricultural sector is considered as the most vulnerable to climate change. Based on the report published by the Disaster Management Center of Sri Lanka, Kurunegala District is one of the most vulnerable to drought.
From 2016 to 2017, a long-term drought affected the whole district of Kurunegala. Paddy field production was recorded to be 83,898 MT and 38,332 MT for the Maha and Yala seasons, respectively. These values were 26% to 62% lower as compared with the past eight years of yield recorded in the district (Department of Census and Statistics – Sri Lanka, n.d.). Aside from the threatened food security and economic implications of climate change, human health and safety can also be at risk due to the increased frequency of extreme weather events and emergence of diseases and other health concerns (Machalaba et al., 2015).
3.3 Evaluation of risk indicators
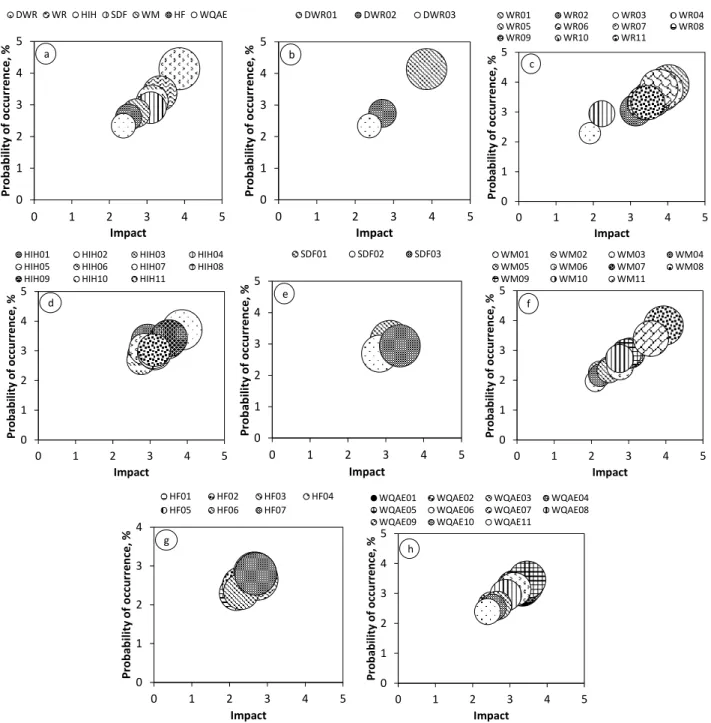
The result obtained from the qualitative risk analysis was illustrated in Figure 5a. Drinking water (DWR), water resources (WR), and health and infrastructure (HIH) risks ranked as the top three major concerns in Kurunegala City. Among the three risk indicators, lack of drinking water resources due to drought was considered as the greatest manifestation of DWR.
The uneven distribution of rainfall experienced in the region can lead to long-lasting drought. Losses in the agricultural sector can also be attributed to the insufficient supply of water for irrigation. Major tanks in the district reached critical levels and decreased groundwater levels were also observed. Aside from relatively-low amounts of precipitation, increased air temperature can also decrease the amount available water by means of evapotranspiration. With the decreasing groundwater recharge and elevated levels of pollution, water scarcity became a profound issue in Kurunegala City.
Intensification of UHI effect was also noted as one of the major indicators in the HIH category. UHI effect creates a series of negative environmental consequences such as worsening air pollution and degradation of water quality (Heaviside et al., 2017). Moreover, increasing urban temperatures can also promote the proliferation of pathogens in water and other vector-borne diseases. In a study conducted by Mathieu and Karmali, 2016, UHI can directly influence the survival of mosquitoes and ticks. Warmer temperature
provides a more favorable habitat for disease-carrying insects, thereby increasing human health risks. Increase in water-borne diseases, degradation of river structures, loss of life due to disasters, and water quality deterioration are considered as the major indicators for SDF, WM, HF, and WQAE, respectively. The graphical summary of the primary risk indicators affecting the risk factors was exhibited in Figures 5b through 5h.
3.4 Kurunegala City Water Management and Climate Change Adaptation Action Plan
Wastewater and water resources management is a crucial part in the development of Kurunegala City. Alongside with government projects involving the expansion of water distribution lines, water source augmentation, and improvement of wastewater conveyance and sanitation, it is also important to address the potential impacts of climate change in the city.
Occasional flooding, long-term drought, and increasing surface temperatures were found to be the leading environmental problems in Kurunegala City. Specifically, drought posed the greatest impact in the city, resulting to extensive agricultural damages and water scarcity. Poor water quality can also be a factor affecting water shortage and increase in the number of water-borne or vector-borne diseases in the city. The current water supply cannot meet the demands of the population due to lack of potable water sources. Polluted water also serves as breeding grounds for disease-carrying insects, thereby posing a threat in the health and safety of the people.
Various types of LID facilities can be incorporated in the Kurunegala City area to promote efficient water use and circulation. Water management schemes can be used on institutional land use types due their considerably large areas.
The principle of water reuse can be employed to minimize water consumption. Rain barrel systems or cisterns can be installed beside the buildings to capture roof runoff. The stored water can be used for watering plants, cleaning, and flushing the toilet. However, the storage tanks should be properly covered to prevent the prevalence of disease-carrying mosquitoes and other insects. Aside from rainwater harvesting, facilities that promote infiltration and groundwater recharge can also be installed inside the government or school complexes. Properly designed facilities that can accommodate and treat surface runoff can be used instead of normal landscape features.
Urban areas are considered as one of the major producers of non-point source pollution. Exhaust from vehicular traffic, atmospheric deposition, and other anthropogenic activities generate pollutants that are mainly accumulated on roadsides
and gutters during periods of dry days (Guo et al., 2019).
The stormwater runoff generated by the rainfall events washes-off the accumulated particles or sediments, which may lead to water quality degradation if directly discharged into natural streams without further treatment. Kurunegala City has a diverse network of roads and highways. Major highways were mainly overlaid by asphalt, whereas some small streets and alleys remain unpaved. Most parking spaces in the city area were designed without any provisions for ecological functions. The impervious surface of parking spaces also contributes to the generation of greater stormwater runoff volumes containing various types of pollutants.
In order to mitigate the effects of climate change in the city, several measures involving the use of LID can be employed.
LID facilities can be installed in several areas within the city.
Bioretention facilities or bioswales can be constructed on center islands on main roads of Kurunegala City. Instead of using concrete blocks, bioretention systems can serve as facilities for stormwater runoff reduction and treatment. Moreover, these facilities can alleviate the impacts of UHI by reducing the amount of paved areas throughout the city. One way of improving the sidewalks is by installing planter boxes. Properly designed planter boxes will not only improve water circulation, but can also provide aesthetic value in the streets of Kurunegala 0
1 2 3 4 5
0 1 2 3 4 5
Probability of occurrence, %
Impact
DWR WR HIH SDF WM HF WQAE
a
0 1 2 3 4 5
0 1 2 3 4 5
Probability of occurrence, %
Impact
DWR01 DWR02 DWR03
b
0 1 2 3 4 5
0 1 2 3 4 5
Probability of occurrence, %
Impact
WR01 WR02 WR03 WR04
WR05 WR06 WR07 WR08
WR09 WR10 WR11
c
0 1 2 3 4 5
0 1 2 3 4 5
Probability of occurrence, %
Impact
HIH01 HIH02 HIH03 HIH04 HIH05 HIH06 HIH07 HIH08 HIH09 HIH10 HIH11
d
0 1 2 3 4 5
0 1 2 3 4 5
Probability of occurrence, %
Impact
SDF01 SDF02 SDF03
e
0 1 2 3 4 5
0 1 2 3 4 5
Probability of occurrence, %
Impact
WM01 WM02 WM03 WM04
WM05 WM06 WM07 WM08
WM09 WM10 WM11
f
0 1 2 3 4
0 1 2 3 4 5
Probability of occurrence, %
Impact
HF01 HF02 HF03 HF04 HF05 HF06 HF07 g
0 1 2 3 4 5
0 1 2 3 4 5
Probability of occurrence, %
Impact
WQAE01 WQAE02 WQAE03 WQAE04 WQAE05 WQAE06 WQAE07 WQAE08 WQAE09 WQAE10 WQAE11
h
Fig. 5. Ranking of risk factors and indicators
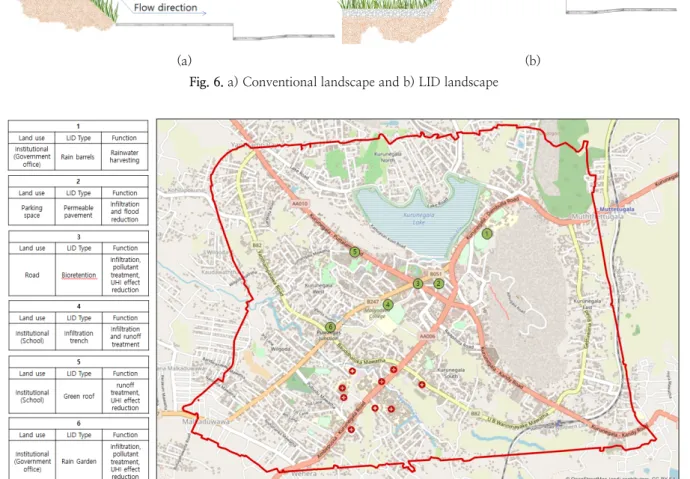
City. Natural landscape features can also be redesigned in order to perform ecosystem services properly. The diagrams presented in Figure 6 shows the effect of landscape elevation to the direction of water flow. Green spaces should be designed at lower elevation as compared with the roadsides or sidewalks to effectively accommodate runoff. The potential locations of LID facilities in Kurunegala City was mapped in Figure 7.
Similar to public spaces, housing units and commercial complexes were designed without any provisions for ecosystem services and water circulation. In order to resolve the drought problem in Kurunegala City, it is essential to maximize all potential water resources in the area. During rainfall events, roof runoff can be partially infiltrated upon reaching a permeable surface. In the case of paved areas, roof runoff can be directly discharged on stormwater drains due to an inadequate infiltration potential. An effective water circulation in Kurunegala City can be achieved by promoting the housing designs featured in Figure 8. Small infiltration trenches can be constructed around the local houses in order to promote groundwater recharge. In addition to the increased infiltration potential, the runoff can be filtered before reaching the
groundwater table, thereby reducing the incidents of groundwater contamination. Small underground cisterns can also be installed beneath the infiltration units. The stored water in the cisterns can also be used for miscellaneous purposes to reduce metered water consumption.
Wastewater management is also considered as a major problem in Kurunegala City. Improvements in wastewater collection and treatment were aimed after the completion of Greater Kurunegala Water Supply and Sewerage Project.
However, the spatial extent of wastewater collection and the actual coverage area needs further improvements, especially on the areas outskirt of the city. Residential areas usually utilize septic tanks as a primary wastewater treatment method. Septic tank effluent is still not suitable for direct discharge on natural waterways based on the wastewater discharge regulations in Sri Lanka. Due to this policy, the use of soakage pits or leaching trenches became a widely-used scheme throughout the country (Hettiarachchi & Hettiarachchi, 2006). Despite the guidelines for an effective use and construction of septic tanks and soakage pits, groundwater contamination may still prevail, especially if design guidelines were not met.
(a) (b) Fig. 6. a) Conventional landscape and b) LID landscape
Fig. 7. Potential locations of LID facilities in Kurunegala City
In order to protect groundwater and surface water quality, additional features can be added in to the conventional wastewater treatment in Kurunegala City. Constructed wetlands (CWs) are effective LID facilities for secondary or tertiary wastewater treatment. In addition to the typical treatment train presented in Figure 9a, inclusion of horizontal subsurface wetlands (HSSF CWs), as shown in Figure 9b, in the process can significantly improve the effluent quality before discharging into soakage pits.
HSSF CWs can effectively reduce pollutant concentrations in the septic tank effluent through its filtering and biological treatment mechanisms. This type of CW is suitable for application in Kurunegala City since it does not utilize open water surface, thereby eliminating the risk of mosquito or other insect breeding (Kadlec & Wallace, 2009). Inclusion of additional media, such as gravel and sand, in the design of soakage pits can also promote additional filtering mechanisms that can help protect groundwater quality. The application of CWs in Kurunegala City can also be utilized in small communities as a means of centralized wastewater treatment system. By interconnecting individual residential HSSF CWs and discharging the effluent into a large-scale HSSF CW, the final effluent can further be reused for agricultural purposes. The diagrams of the proposed interconnected HSSF CWs for a community-based wastewater treatment in Kurunegala City was illustrated in Figure 10.
4. Conclusion
Climate change adaptation is a crucial factor for sustainable urban development. Kurunegala City is an example of urban area experiencing distress due to the impacts of climate change.
Lack of provisions regarding climate change mitigation can lead to grave implications in the economy, nature, and society.
This study evaluated the occurrence and impacts of climate change in the city of Kurunegala. Water scarcity and heat stress were among the primary concerns identified in the area.
Specifically, the limited supply of drinking water due to drought and changes in rainfall distribution were crucial factors to be considered in the development of the city. In order to mitigate the effects of climate change and address the growing needs for sustainable water resources in the city, several methods for improving the water circulation and climate change adaptation schemes were proposed.
In conjunction with the structural improvements in the city area, the application of LID schemes in Kurunegala City can provide ecosystem services that can be advantageous for promoting water availability and heat stress reduction.
Installation of bioretention systems and infiltration devices along roadsides or public spaces can induce water quality improvement, groundwater recharge, and reduction of UHI
Fig. 8. Alternative designs to promote water circulation and water conservation in residential housing units
(a) (b)
Fig. 9. a) Conventional domestic wastewater treatment and b) advanced wastewater treatment using HSSF CW
(a) (b)
Fig. 10. Centralized wastewater treatment for small communities using HSSF CW: a) for water reuse and b) for groundwater recharge
effect. The use of rainwater harvesting systems and alternative water sources can help reduce metered water consumption and aid in water conservation efforts throughout the city.
Potential water reuse and prevention of groundwater contamination can also be achieved by utilizing HSSF CWs for advanced wastewater treatment. The different adaptation measures and water circulation strategies can also be applicable to areas experiencing similar adverse effects of climate change.
Acknowledgment
This work was completed in cooperation with the Korea Environment Institute (KEI). The authors are grateful for their support.
References
Adger, W. N., Brown, I., & Surminski, S. (2018). Advances in risk assessment for climate change adaptation policy.
Philosophical Transactiona A.
De Silva, S. S. (1988). Reservoirs of Sri Lanka and their Fisheries.
Rome: FAO.
Department of Census and Statistics - Sri Lanka. (2019, July 29). Paddy Statistics. Retrieved from Department of Census and Statistics - Sri Lanka: http://www.statistics.gov.lk/
agriculture/Paddy%20Statistics/PaddyStats.htm
Department of Meteorology - Sri Lanka. (2019, July 18).
Climate of Sri Lanka. Retrieved from Department of Meteorology - Sri Lanka: http://www.meteo.gov.lk/
index.php?option=com_content&view=article&id=94&I temid=310&lang=en#2-southwest-monsoon-season-m ay-september
Dufour, B., Plée, L., Moutou, F., Boisseleau, D., Chartier, C., Durand, B., Toma, B. (2011). A qualitative risk assessment methodology for scientific expert panels. Revue Scientifique Et Technique-Office International Des Epizooties, 673-681.
Eckstein, D., Hutfils, M., & Winges, M. (2018). Global Climate Risk Index 2019. Germanwatch e.V.
FAO. (2012). Irrigation in Southern and Eastern Asia in Figures:
AQUASTAT survey - 2011. Rome: FAO.
Government of the Democratic Socialist Republic of Sri Lanka.
(2018). Maps approach supporting SDG implementation in Sri Lanka. United Nations Development Programme.
Guo, J., Pan, Y., Zuo, P., Xu, Y., Wang, Q., Ma, J., & Wang, L. (2019). Accumulation and wash-off characteristics of surface pollutant and identification of risk areas on urban land uses in a lakeside city, Wuxi, China. Urban Water Journal, 1-11.
Heaviside, C., Macintyre, H., & Vardoulakis, S. (2017). The
urban heat island: implications for health in a changing environment. Current environmental health reports, 296-305.
Hettiarachchi, M., & Hettiarachchi, I. (2006). A comparison of guidelines on septic tanks and soakage systems in Sri Lanka. WEDC International Conference (pp. 26-29).
Colombo: Loughborough University's Institutional Repository.
Kadlec, R. H., & Wallace, S. (2009). Treatment Wetlands.
CRC Press.
Machalaba, C., Romanelli, C., Stoett, P., Baum, S. E., Bouley, T. A., Daszak, P., & Karesh, W. B. (2015). Climate change and health: Transcending silos to find solutions. Annals of Global Health, 445-458.
Mathieu, K., & Karmali, M. (2016). Emerging Challenges of Vector-Borne Diseases and Cities: Vector-borne diseases, climate change and healthy urban living: Next steps.
Canada Communicable Disease Report, 219-221.
Ministry of Disaster Management; WFP. (2017). Sri Lanka:
Initial Rapid Assessment on Drought 2016/17. WFP.
Munia, H., Guillaume, J. H., Mirumachi, N., Porkka, M., Wada, Y., & Kummu, M. (2016). Water stress in global transboundary river basins: significance of upstream water use on downstream stress. Environmental Research Letters, 014002.
Ruzaik, F. (2011). Environmental health issues associated with the disposal of municipal solid waste in Kurunegala.
Sanjeewani, R. M., & Manawadu, L. (2017). Spatial Trends of Land Surface Temperature Variation over Selected Urban Regions in Sri Lanka Using Remote Sensing. Asian Journal of Geoinformatics.
World Weather Online. (n.d.). Kurunegala Monthly Climate Averages. Retrieved July 22, 2019, from World Weather Online: https://www.worldweatheronline.com/kurunegala- weather-averages/north-western/lk.aspx
<저자소개>
Nash Jett DG. Reyes Kongju National University
Graduate student / [email protected] Hanna Cho
Korea Environment Institute 전문연구원 / [email protected] Franz Kevin F. Geronimo Kongju National University
Ph.D. candidate / [email protected] Minsu Jeon
Kongju National University
Graduate student / [email protected] Leehyung Kim
Kongju National University Professor / [email protected]