진화하는 서울 지하철 망의 특성과 효율성 분석
Characteristics and Efficiency Analysis of Evolutionary Seoul Metropolitan Subway Network
장시영·이강원*
See-Young Zzang·Kang-Won Lee
1. Introduction
Seoul is one of the most populated cities in the world. It has a population of about 10 million dwellers on the area of 605km
2(8025km
2for the metropolitan area of Seoul) and a highly developed and sophisticated public transportation system. The most typical public transportation system of Seoul is the subway network. Since the opening of the 1st line in 1974, the subway network of Seoul went through a significant evolutionary processes for the last 30 years. Now it has become one of the largest subway networks in the world, rivalling other networks such as the Moscow, Tokyo or New York.
Characterizing the structural properties of the network is of fundamental importance to understand the complex dynamics of networks such as neural network, social network, computer network, etc. And the structural properties of the subway network are very relevant to an effective transportation management in urban cities. So, each country has analyzed its own subway net- work mathematically to identify the structural characteristics and evaluate the efficiency of the subway network. Derrible et al.[1]
evaluated the subway network of Toronto, Canada using three indicators relevant to ridership: coverage, directness and connec- tivity. They compared those with other subway networks worldwide and proposed possible improvements. Mouronte[2] investi-
Abstract
The metropolitan subway network of Seoul has gone through many evolutionary processes in past decades to disperse the floating population and improve the traffic flow. In this study, we analyzed how the structural character- istics and the efficiency of the subway network have changed according to the dynamic evolutionary processes of the metropolitan subway network of Seoul. We have also proposed new measures that can be used to characterize the struc- tural properties of the subway network more practically. It is shown that the global efficiency is about 74%, which is higher than those of subway networks of foreign countries. It should also be considered that passenger flow between sta- tions is even higher, at about 85%. Since the private lines, including line 9, the New Bundang line, the Uijeongbu line, and the Ever line do not release their traffic data since September, 2013, only 5 years of data from September, 2008 to September, 2013 is available. So, in this study we limit the analysis period to these 5 years.Keywords
: Seoul metropolitan subway network, Network analysis, Average shortest path length, Global efficiency, Weighted global efficiency초 록 서울 수도권 지하철 망은 과거 수십 년 동안 도심지의 인구 분산, 교통 정체 해소 그리고 인접 도시의 활성 화 등 다수의 목적을 위하여 여러 번의 진화 과정을 거쳐 왔다. 본 연구에서는 서울 수도권 망의 동적인 진화에 따라 지하철 망의 특성과 망의 효율이 어떻게 변화해 왔는지를 분석하였다. 아울러 본 연구에서는 지하철 망의 효율을 보 다 현실적으로 나타낼 수 있는 새로운 척도를 제안하였다. 서울 지하철 망의 효율성은 74%로 외국의 값들보다 높게 나타났으며 승객의 실질적인 흐름을 고려하면 효율성은 85% 이상으로 더 높게 나타났다. 9호선과 신분당선, 의정부 선과 에버라인 노선들은 2013년 9월 이후로 수송 실적 관련 자료를 공개하지 않기 때문에 본 연구에서는 분석 범위 를 데이터가 존재하는 2008년 9월부터 2013년 9월로 국한하였다.
주요어 : 서울 수도권 지하철, 네트워크 분석, 평균 최단 경로 거리, 전체 효율성, 가중 전체 효율성
*Corresponding author. Tel.: +82-2-970-6476, E-mail: [email protected].
© 201
6The Korean Society for Railway. All rights reserved.
http://dx.doi.org/10.7782/JKSR.2016.19.3.388
gated the topological structure of the subway network of Madrid, Spain and different statistic features were analyzed such as node degree, average shortest path length, clustering coefficient, etc. Latora et al.[3] introduced the concept of efficiency of a net- work, measuring how efficiently it exchanges information over the network. Two measures, global efficiency and local effi- ciency were proposed and small-world networks were seen as systems that are both globally and locally efficient. Using these measures they analyzed the Boston subway transportation system(MBTA) and found that MBTA is a very efficient transporta- tion system on a global scale but shows a poor local behaviour.
All of the previous studies have focused on investigating the structural characteristics or efficiency of the subway systems at a specific point of time. There seems to be no study which traces the change of the structural characteristics or the efficiency according to the dynamic evolutionary processes of subway network. Also, when analyzing the efficiency of subway network, the topological measures developed for the general network such as neural networks and communication networks have been used without considering the characteristics of the subway network. So, they couldn't provide any clear physical and useful meanings.
The metropolitan subway network of Seoul has gone through many evolutionary processes in past decades to disperse the floating population and improve the traffic flow. In this study we analyze how the structural characteristics and the efficiency have been changed according to the evolutionary processes of metropolitan subway network of Seoul. To analyze the changes in the structural characteristics over time we calculate several measures which represent the topological properties of network and trace the changes of these measures. To analyze the changes in the network efficiency over time, we also calculate the global effi- ciency measure proposed by Latora[3] and trace the changes of this measure. Then, we propose a new efficiency measure for subway network, called weighted global efficiency, which weights the global efficiency with the amount of traffic flow between stations and can give more useful and practical meaning to the network efficiency. Coverage also changes according to the evo- lutionary processes, which is defined as the percentage of land covered by the subway network. By considering the coverage and the global network efficiency jointly we can provide more meaningful measures.
Following Introduction we discuss the importance of metropolitan subway network of Seoul and investigate the evolutionary processes in past decades in Chapter 2. In Chapter 3, we discuss how the structural properties and the network efficiency have been changed according to the evolutionary processes. In Chapter 4 new measures are proposed to represent the efficiency of subway network. The final conclusion and the summary are included in Chapter 5.
2. Metropolitan Subway Network
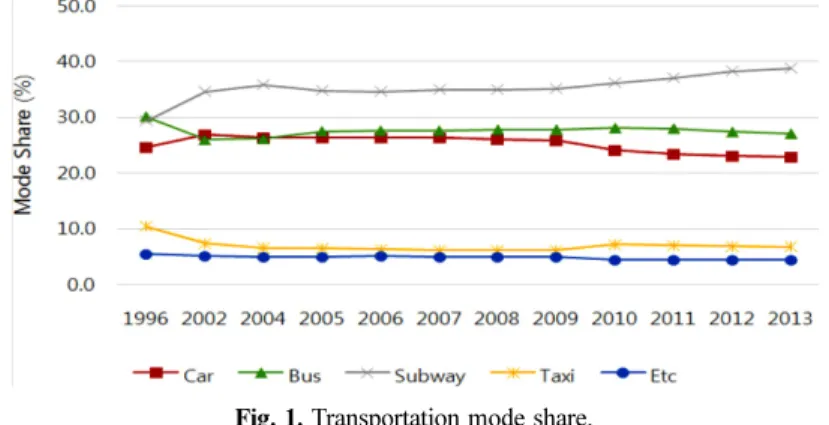
We cannot overemphasize the importance of Seoul metropolitan subway network. Since the subway network became the first in transportation mode share overtaking the bus system in 1996, the subway mode share has become 38.8% in 2013 as can be seen in Fig.1.
The metropolitan subway network of Seoul consists of 9 lines of Seoul and 7 suburban lines including Bundang line, Incheon line, Suin line, Gyeongui Central line, Kyungchun line, Airport line, Uijeongbu line, New Bundang line, and Ever line. Seoul subway network has a good transfer system from one line to another and is also well connected to the suburban subway net- works.
Fig. 1. Transportation mode share.
Currently, the annual boarding of metropolitan subway network of Seoul is 2.4 billion in 2013 and the boarding per capita is 165. Its railroad route length is 327km. Under the urban railroad construction plan of Seoul, about 90 km of railroad route length(27% increase) will be added by the year 2025. In any place of Seoul, there will be a subway station within 10 minutes of walking distance.
Since the opening of the 1st line in 1974, the metropolitan subway network has gone through a number of changes over the years with multiple purposes to solve the traffic congestions, to promote the constructions of neighboring town, to disperse the population of downtown and to expand the metropolitan area.
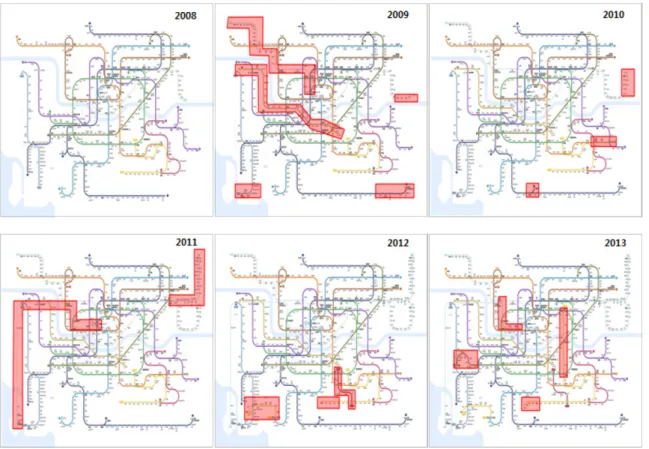
All of the data required for this study is obtained from Korea Transport DB[4] and Seoul Open Data Plaza[5]. Since the private lines including line 9, New Bundang line, Uijeongbu line and Ever line do not release their traffic data since September, 2013, only data of 5 years between September, 2008 and September, 2013 is available. So, in this study, we limit analysis period to these 5 years. Since September, 2008, we have investigated the changes of subway network every year. Fig. 2 shows the subway network of every September from 2008 to 2013. The shaded area represents the changed part during the one year.
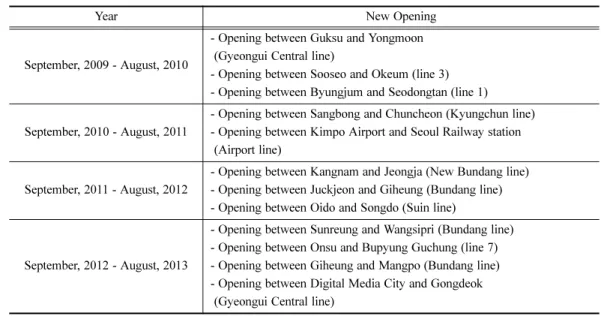
More detailed information of yearly change is summarized in Table 1.
Table 1. Evolutionary processes by year.
Year New Opening
September, 2008 - August, 2009
- Opening between Cheonan and Sinchang (line 1)
- Opening between Paldang and Guksu (Gyeongui Central line) - Opening between Dongmak and International Business District (Incheon line)
- Opening between Seoul Railway Station and Munsan (Gyeongui Central line)
- Opening between Kaehwa and Sinnonhyeon (line 9) Fig. 2. Subway network (September, 2008-2013).
3. Analysis of Changes in the Structural Characteristics
3.1 Network Topology Measures
To analyze the changes in the structural characteristics of the subway network we trace the changes in the topology of subway network. There are several measures which represent the characteristics of network topology, which are shown in Table 2.
3.2 Data
To calculate network topology measures we need several data. For the shortest track distances and the number of daily passen- gers between any two stations, Korea Transport DB[4] and WGS(World Geodetic System) coordinate are used. And the subway station codes are collected from Seoul Open Data Plaza[5]. With these values we have used the equation of Bullock[6] to calcu- late the Euclidean distances between any two stations. For the area of administrative district we have used Korean Statistical Information Service(KOSIS)[7].
3.3 Analysis
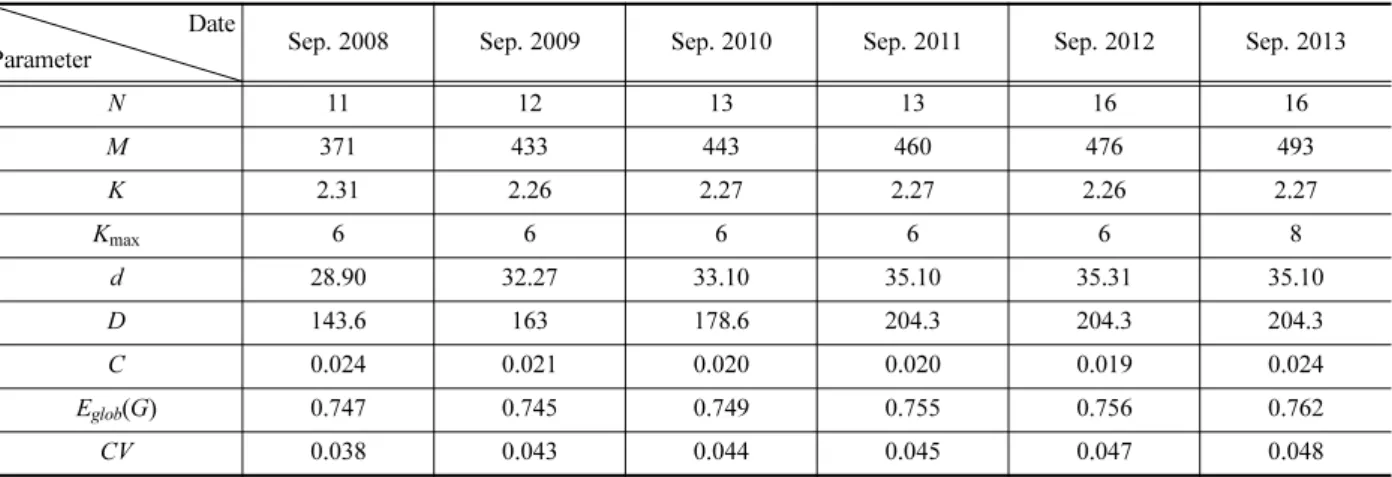
We consider a subway network that consists of M stations and L links. This network is constituted as a generic graph G with M vertices and L edges. Table 3 summarizes the yearly network topology measures between September, 2008 and September, 2013.
Table 2. Network topology measures.
Parameter Definition
N Number of lines M Number of stations
K Average node degree: average number of edges incident to the node.
K
max
Maximum node degree: maximum number of edges incident to the noded Average shortest path length(km): average of shortest path between all nodes of the network D Network diameter(km): largest distance between two nodes in the network
C Clustering coefficient: percentage of closed triplets among all connected node triplets in the network Eglob(G) Normalized global efficiency: ratio of euclidean distance and track distance in the network
CV Coverage: percentage of area covered by the network Table 1. Continued.
Year New Opening
September, 2009 - August, 2010
- Opening between Guksu and Yongmoon (Gyeongui Central line)
- Opening between Sooseo and Okeum (line 3) - Opening between Byungjum and Seodongtan (line 1)
September, 2010 - August, 2011
- Opening between Sangbong and Chuncheon (Kyungchun line) - Opening between Kimpo Airport and Seoul Railway station (Airport line)
September, 2011 - August, 2012
- Opening between Kangnam and Jeongja (New Bundang line) - Opening between Juckjeon and Giheung (Bundang line) - Opening between Oido and Songdo (Suin line)
September, 2012 - August, 2013
- Opening between Sunreung and Wangsipri (Bundang line) - Opening between Onsu and Bupyung Guchung (line 7) - Opening between Giheung and Mangpo (Bundang line) - Opening between Digital Media City and Gongdeok (Gyeongui Central line)
- Number of lines(N) and stations(M): Between September, 2008 and September, 2013, the number of lines had increased from 11 to 16 and number of stations from 371 to 493, 33% increase.
- Average(K) and Maximum node degree(K
max): Average node degree(K) is defined as the average number of links directly accessible to the node. Except transfer stations all of the stations have the node degree of 2. It has remained almost same over the years. Maximum node degree(K
max) has become 8 in 2013, which means 4 different lines meet at one transfer station.
- Average shortest path length(d): It is the average shortest track distance(km) between all stations of the subway network. Let d
ijrepresent the shortest track distance between the stations i and j. Then, the average shortest path length is defined as
(1)
As can be seen in Table 3, the average shortest path length continuously increased from 28.90 to 35.10(22% increase) by Sep- tember, 2011. In this period there was an opening of suburban subway systems, Cheonan line and Chuncheon line, which made the average shortest path length a little longer. Subway networks usually grow either in two different modes: expansion and intensification[8]. The two modes appear alternatively, so that the network can become larger and denser. So, we can say the growth of Seoul metropolitan subway network was more likely under the expansion mode rather than the intensification mode by September, 2011. The average shortest path length has remained almost same since September, 2011 even if the number of stations has increased from 460 to 492 (7% increase). Now, we can say the growth of Seoul metropolitan subway network has been more likely under the intensification mode rather than the expansion mode after September, 2011.
- Diameter of network (D): It is the largest distance between two stations of the network. That is,
(2)
The network diameter also increased from 143.6 to 204.3(42.3%) by September, 2011. It is due to the opening of suburban subway systems in this period. And the network diameter has remained almost same since August, 2011 as in the case of average shortest path length. From these facts, we can also see the expansion mode and the intensification mode, each with before and after September, 2011.
- Clustering coefficient (C): It is a measure of how close a node's neighbors are to form a clique. It is based on the triplets of nodes, where a triplet consists of the three nodes that are connected by either two (open triplet) or three(closed triplet) undirected ties. The clustering coefficient is the percentage of closed triplets among all connected node triplets in the entire network. This measure can be used to represent the local efficiency, which tells how much the system is fault tolerant.
As can be seen in Table 3, clustering coefficients have the very low values around 0.02 over the years, which show the poor local efficiency. Subway network does not need to be fault-tolerant. Nobody does not expect the subway network to provide direct connections between neighboring stations when the station i breaks down. Subway network is just one part of the metro-
d
Σ
i j G≠ ∈ dij M M 1( – ) ---=
D=MAX d( )ij
Table 3. Network topology measures of seoul metropolitan subway network.
Date
Parameter Sep. 2008 Sep. 2009 Sep. 2010 Sep. 2011 Sep. 2012 Sep. 2013
N 11 12 13 13 16 16
M 371 433 443 460 476 493
K 2.31 2.26 2.27 2.27 2.26 2.27
K
max
6 6 6 6 6 8d 28.90 32.27 33.10 35.10 35.31 35.10
D 143.6 163 178.6 204.3 204.3 204.3
C 0.024 0.021 0.020 0.020 0.019 0.024
Eglob(G) 0.747 0.745 0.749 0.755 0.756 0.762
CV 0.038 0.043 0.044 0.045 0.047 0.048
politan public transportation network. If the station i breaks down, there are other means of connecting neighboring stations such as bus and taxi. If we consider the whole public transportation network, it should be fault-tolerant and must have high values of clustering coefficient.
A few countries have calculated clustering coefficients of their subway systems as shown in Table 4. We can see that C of Seoul is slightly less than that of Boston, but a little higher than those of Madrid, Beijing and Shanghai.
- Normalized global efficiency (E
glob(G)): It is a measure of the efficiency of the network, under the assumption that the effi- ciency ε
ijfor sending information or some materials between two nodes i and j is proportional to the reciprocal of their distance d
ij. It is the shortest track distance, which is the smallest sum of physical distances throughout all of the possible paths in the net- work from i to j. Now the network efficiency is defined as
(3)
To normalize EF
glob(G), we consider the ideal network G
idwhere any node has a direct connection to all other nodes and the distance l
ijrepresents the Euclidean distance between the node i and j. In subway network, d
ijis the shortest distance of track between the station i and j. l
ijis the Euclidean distance between the station i and j in the ideal network G
id. Now the normalized global efficiency can be defined as
(4)
Since d
ij≥ l
ijE
glob(G) has the value between 0 and 1. If the subway network is an ideal one, that is, each station has a direct tunnel to others, then d
ij= l
ij. And the normalized global efficiency becomes 1.
As can be seen in Table 3, the normalized global efficiency has the value over 0.74, which shows the metropolitan subway net- work of Seoul is a very efficient transportation system on a global scale, only 26% less efficient than the ideal subway network with a direct tunnel from each station to the others. From Table 3, we can also see that E
glob(G) has been slightly increasing over time. and we have 76.2% in 2013. This means that the new stations added since 2008, actually 122 stations and 33% increase, are located efficiently or they might be the good transfer stations for the existing stations.
Very few countries have calculated E
glob(G) of their subway networks, which are shown in Table 5.
E
glob(G) of Boston subway transportation system(MBTA) is 0.63[10], which is 9% lower than that of Seoul. And E
glob(G) of Tokyo and Osaka are 0.70 and 0.72, respectively, which are slightly less than that of Seoul.
- Coverage (CV): Coverage measures the percentage of area covered by the subway network. It is defined as the sum of the areas surrounding the stations divided by the total served area. The value of 0.5(km), which is the radius of a circle surrounding a station, is used to calculate the area[1]. A in Equation (5) represents the total served area. To calculate A we have used the data
Table 4. C of other countries [2,9,10].
City Clustering coefficient
Boston 0.03
Madrid 0.01
Beijing 0.0045
Shanghai 0.0024
Table 5. Eglob(G) of other countries [9,11].
City Global efficiency
Boston(2002) 0.63
Tokyo(2007) 0.70
Osaka(2007) 0.72
EFglob( )G
Σ
i j G≠∈ εijM M 1( – ) --- 1
M M 1( – )
---
Σ
i j G≠∈ dij–1= =
Eglob( )G
Σ
i j G≠∈ dij–1Σ
i j G≠ ∈ lij–1 ---=
from Korean Statistical Information Service(KOSIS)[7], which can be obtained as the sum of areas(city or county) opened for the subway network. A is 8025km
2in 2013.
(5)
From the Table 3 we can see that CV increases monotonically since it is just the function of number of subway stations. It became 0.048 in September, 2013. CVs of other countries are shown in Table 6, which are much higher than that of Seoul. It is because Seoul metropolitan subway network includes 7 suburban lines as well as 9 lines of Seoul. If we just consider 9 lines of Seoul, CV becomes 0.25, which is the highest among the competing cities.
4. New Measures to Represent the Efficiency of Seoul Subway Network
In the previous Section 3 we have used the normalized global efficiency E
glob(G) for the efficiency measure of subway net- work. Since it is defined only from the viewpoint of network structure and does not consider other factors related to subway sys- tem, it seems to lack practicality. To add more practical meanings to E
glob(G) we propose a new measure, the weighted global efficiency WE
glob(G), which considers the actual flow of passengers between stations. We also introduce another new measure, the relative global efficiency, which combines CV and E
glob(G) or WE
glob(G).
4.1 Weighted Global Efficiency, WE
glob(G)
In E
glob(G) there is no difference between links but equally treated. If we consider the traffic flow of passengers, links would have different importance from each other. That is, if link (i, j) has more traffic flow than link (m, k), then link (i, j) should be weighted more than link (m, k). For this purpose we introduce f
ij, which is the average of the daily number of passengers from the station i to station j. And the weight for link (i, j), w
ijis given as
(6)
Now the weighted global efficiency is defined as
(7)
WE
glob(G) and E
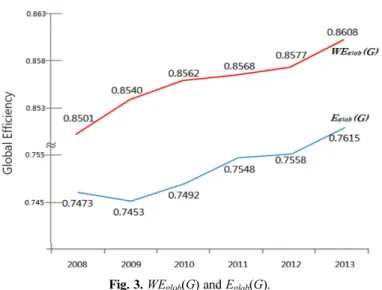
glob(G) are shown in Fig. 3. It shows that WE
glob(G) are higher than E
glob(G) by about 10%, which means the more utilized links (or stations) are more efficient on a global scale than the less one. Therefore, if we consider the traffic flow of passengers, Seoul metropolitan subway network is even more efficient transportation system. WE
glob(G) remained above 0.85 during the period of (2008~2013). It became 0.8608 in 2013.
Table 6. CV of other countries [1].
City Coverage
Madrid 0.194
NY 0.159
Paris 0.235
London 0.166
Tokyo 0.104
Osaka 0.092
CV M π 0.5× × 2 ---A
=
wij fij
Σ
i j G≠ ∈ fij---
=
WEglob( )G
Σ
i j G≠∈ (dij–1⋅wij)Σ
i j G≠∈ (lij–1⋅wij) ---=
4.2 Relative Global Efficiency, RE
glob(G) and RWE
glob(G)
We have defined the coverage measure CV which represents the percentage of area covered by the subway network. It can be also used to indicate the accessibility of network. Since we have new lines or extensions of existing lines every year as shown in Table 1, CV increases monotonically. Now we want to answer the question of “how efficient the yearly change of subway net- work is?”. To answer this question we introduce a new measure, the relative global efficiency, which combines CV and E
glob(G) or WE
glob(G). That is,
(8)
(9)
In the above equations CV
n, E
glob(G)
nand WE
glob(G)
nrepresent the coverage, the global efficiency and the weighted global efficiency of September of year n respectively. As can be seen in Fig. 4 RE
glob(G) shows the highest values in the years (2010- 2011) and (2012-2013), which means the stations newly added between these periods are located very efficiently on a global scale. On the while, RE
glob(G) is the lowest, actually negative, in the year (2008-2009). This is because E
glob(G) decreases from 0.7473 to 0.7453 during this period. As shown in Fig. 5, RWE
glob(G) also has the highest value in the period (2012-2013). Unlike RE
glob(G), however, RWE
glob(G) has a low value in the period (2010-2011). This is because WE
glob(G) has remained almost the same(0.8562 in 2010 and 0.8568 in 2011) during this period, which means the newly added stations and links in this period do not contribute to the increase of weighted global efficiency.
REglob( )Gn Eglob( )Gn–Eglob( )Gn 1– CVn–CVn 1– ---
=
RWEglob( )Gn
WEglob( )Gn–WEglob( )Gn 1– CVn–CVn 1– ---
=
Fig. 3. WEglob(G) and Eglob(G).
Fig. 4. Relative global efficiency. Fig. 5. Weighted relative global efficiency.
5. Conclusion and Summary
Subway networks are dynamic and will change along with the development of city or the new plan of city. Thus, a static analysis can not reflect comprehensively the characteristics of network. In this study, we investigated how the structural properties and the efficiency have been changed according to the dynamic evolutionary processes of Seoul metropolitan subway network. We also proposed the new measures, which can be used to characterize the structural properties of subway network more practically.
We have calculated the topology measures of Seoul metropolitan subway network from September, 2008 to September, 2013.
We have seen the expansion mode of network growth was stronger than the intensification mode by September, 2011 and then, the intensification mode after September, 2011. Seoul metropolitan subway network is far from small world network due to the low clustering coefficient as in the cases of other subway networks of rivaling cities. The normalized global efficiency has been continuously increased and became 0.747 at September, 2013, higher than that of other foreign cities, which implies that Seoul metropolitan subway network is a very efficient transportation system on a global scale. The newly proposed measure in this study, the weighted global efficiency, is over 0.85, which implies that Seoul metropolitan subway network is an even more effi- cient transportation system if we consider the passenger flows.
Subway network planning is an important element of transit planning. In this study, we have provided the several topological measures, which can represent the structural properties and the efficiencies of subway network. Based on these measures we can effectively analyze the impacts of different planning scenarios, which would lead to the optimal planning of future Seoul metro- politan subway network.
Afterword
This research was supported by Seoul National University of Science and Technology Research funds.
References
[1] S. Derrible, C. Kennedy (2010) Evaluating, Comparing, and Improving Metro Networks: Application to Plans for Toronto, Canada, Transportation Research Record: Journal of the Transportation Research Board, 2146, pp.43-51.
[2] M.L. Mouronte (2014) Topological Analysis of the Subway Network of Madrid, International Multi-Conference on Computing in the Global Information Technology, Seville, Spain, pp.9-13.
[3] V. Latora, M. Marchiori (2001) Efficient Behavior of Small-World Networks, Physical Review Letters, 87(19), p.198701.
[4] http://www.ktdb.go.kr (Accessed 30 June 2015).
[5] http://data.seoul.go.kr (Accessed 28 September 2015).
[6] R. Bullock (2007) Great circle distances and bearings between two locations, MDT. June 5.
[7] http://kosis.kr (Accessed 28 September 2015).
[8] L. Biao, Z. Xiaoxi, X. Zhang. (2014) Evaluating the evolution of subway networks: evidence from beijing subway network, EPL(Euro- physics Letters), 105(5), p.58004.
[9] V. Latora, M. Marchiori. (2002) Is the Boston subway a small-world network?, Physica A: Statistical Mechanics and its Applications, 314(1), pp.109-113.
[10] C. Han, L. Liu. (2009) Topological vulnerability of subway network in China, International Conference on Management and Service Science, Shanghai, China, pp.1-4.
[11] T. Majima, M. Katuhara, K. Takadama (2007) Analysis on Transport Networks of Railway, Subway and Waterbus in Japan, Studies in Computational Intelligence, 56, pp.99-113.
(Received 20 April 2016; Revised 12 May 2016; Accepted 16 May 2016)
See-Young Zzang: [email protected]
Department of Industrial & Information Systems Engineering, Seoul National University of Science and Technology, Frontier Hall Rm.
603, 232 Gongneung-ro, Nowon-gu, Seoul, 139-743, Korea Kang-Won Lee: [email protected]
Department of Industrial & Information Systems Engineering, Seoul National University of Science and Technology, Frontier Hall Rm.
617, 232 Gongneung-ro, Nowon-gu, Seoul, 139-743, Korea
![Table 5. E glob ( G) of other countries [9,11].](https://thumb-ap.123doks.com/thumbv2/123dokinfo/5369209.405288/6.892.264.630.942.1032/table-e-glob-g-countries.webp)
![Table 6. CV of other countries [1].](https://thumb-ap.123doks.com/thumbv2/123dokinfo/5369209.405288/7.892.258.634.389.547/table-cv-of-other-countries.webp)