• 검색 결과가 없습니다.

Induction of a Neuronal Phenotype from Human Bone Marrow-Derived Mesenchymal Stem Cells

N/A
N/A
Protected

Academic year: 2021

Share "Induction of a Neuronal Phenotype from Human Bone Marrow-Derived Mesenchymal Stem Cells"

Copied!
7
0
0

로드 중.... (전체 텍스트 보기)

전체 글

(1)

177

Journal of Oral Biology

Induction of a Neuronal Phenotype from Human Bone Marrow-Derived Mesenchymal Stem Cells

Soonyi Oh, Hwan-Woo Park, Jung-Sun Cho, Heekyung Jung, Seung-Pyo Lee, Ki-Suk Paik and Mi-Sook Chang Department of Oral Anatomy, Dental Research Institute & School of Dentistry, Seoul National University, 28 Yeongeon-Dong, Jongno-Gu, Seoul 110-749, Republic of Korea

(received October 16, 2009 ; revised October 26, 2009 ; accepted October 28, 2009)

Human mesenchymal stem cell (hMSCs) isolated from human adult bone marrow have self-renewal capacity and can differentiate into multiple cell types in vitro and in vivo . A number of studies have now demonstrated that MSCs can differentiate into various neuronal populations. Due to their autologous characteristics, replacement therapy using MSCs is considered to be safe and does not involve immunological complications. The basic helix-loop-helix (bHLH) trans- cription factor Olig2 is necessary for the specification of both oligodendrocytes and motor neurons during vertebrate embryogenesis. To develop an efficient method for inducing neuronal differentiation from MSCs, we attempted to optimize the culture conditions and combination with Olig2 gene overexpression. We observed neuron-like morphological changes in the hMSCs under these induction conditions and examined neuronal marker expression in these cells by RT- PCR and immunocytochemistry. Our data demonstrate that the combination of Olig2 overexpression and neuron-specific conditioned medium facilitates the neuronal differentiation of hMSCs in vitro . These results will advance the develop- ment of an efficient stem cell-mediated cell therapy for human neurodegenerative diseases.

Key words: mesenchymal stem cells , transcription factor , neuron , differentiation, induction

Introduction

Degenerative disorders of motor neurons, such as amyotrophic lateral sclerosis and spinal muscular atrophy, are devastating neurological disorders characterized by progressive loss of motor neurons (Boillee et al ., 2006).

However, currently there are no cures or efficient treatments for these fatal neurological disorders.

Bone marrow-derived mesenchymal stem cells (MSCs) are capable of self-renewal and sustained proliferation in

vitro . These multipotent cells can differentiate into multiple mesodermal cells (Bianco et al ., 2001; Pittenger et al ., 1999;

Prockop, 1997). In addition, MSCs have the potential to transdifferentiate into neuron-like cells with various neuronal markers and functional neuronal activity (Munoz- Elias et al ., 2003; Sanchez-Ramos et al ., 2000; Trzaska et

al ., 2007; Woodbury et al ., 2000). Due to high plasticity and lack of immunological complications, application of human MSCs (hMSCs) is considered a desirable form of cell therapy for nervous system injury (Thuret et al ., 2006) compared to the other stem cells, such as neural stem cells and embryonic stem cells (Jung et al ., 2008; Kang et al ., 2008).

Several studies have demonstrated that under specific experimental conditions MSCs can also differentiate into neural cells with non-mesodermal lineage (Sanchez-Ramos

et al ., 2000; Woodbury et al ., 2000; Munoz-Elias et al ., 2003). The agents used to induce neural differentiation in

vitro included retinoic acid, growth factors (alone or in combination), antioxidants and a demethylating agent, compounds which increase intracellular cyclic AMP (Sanchez-Ramos et al ., 2000; Woodbury et al ., 2000; Munoz- Elias et al., 2003).

Oligodendrocyte lineage genes Olig1 and Olig2 encode

*Corresponding author: Mi-Sook Chang, D.D.S., Ph.D.

Department of Oral Anatomy Dental Research Institute & School of

Dentistry Seoul National University 28 Yeongeon-Dong, Jongno-Gu,

Seoul 110-749, Republic of Korea Tel.: +82-2-740-8628; Fax.: +82-2-

762-6671; E-mail: mschang@snu.ac.kr

(2)

178 Soonyi Oh, Hwan-Woo Park, Jung-Sun Cho, Heekyung Jung, Seung-Pyo Lee, Ki-Suk Paik and Mi-Sook Chang basic helix-loop-helix (bHLH) transcription factors. Despite

similarity in the structure and expression, they have distinct biological capabilities. While Olig1 is essential for formation and maturation of oligodendrocytes in the brain, Olig2 is essential not only for oligodendrocyte specification but also for motor neuron specification (Lu et al ., 2000, 2002). In zebrafish, loss of olig2 function inhibited primary motor neuron and oligodendrocyte development, while olig2 overexpression enhanced formation of excess primary motor neurons and oligodendrocytes (Park et al ., 2002).

In this study, we sought to develop an efficient method to induce neuron-like cells from hMSCs by combination of the newly optimized neuronal induction medium and Olig2 gene overexpression.

Materials and Methods

hMSCs culture

Cryopreserved adult hMSCs (Poietics Normal Human Mesenchymal Stem Cells) were purchased from Cambrex (Walkersville, MD). hMSCs between passages 4 and 12 were used for this study. hMSCs were cultured in Dulbecco’s modified Eagle’s medium (DMEM)-low glucose (Hyclone, Logan, UT) containing 10% fetal bovine serum (FBS;

Gibco-BRL, Carlsbad, CA) and 1% penicillin-streptomycin (Gibco-BRL). Cells were maintained at 37

o

C in a fully humidified atmosphere of 5% CO

2

in air.

Transient transfection of hMSCs with pEGFP-Olig2 Cells were plated in a 100 cm dish (100,000 cells/plate) to have 50% confluency after 24 hours cultivation. ExGen 500 (Fermentas, USA)-mediated transient transfection was performed according to the protocol given by the supplier.

Dilution of 10 µ g plasmid DNA (pEGFP-Olig2) and 18 µ l ExGen 500 was carried out in 150 mM NaCl. The transfection mixture had been added to the adherent hMSC.

Adherent hMSCs transfected with pEGFP-Olig2 were

cultured in DMEM-low glucose (Hyclone) with 10% FBS (Gibco-BRL) and 1% penicillin-streptomycin (Gibco-BRL) containing 100 uM BrdU for 24hr. Thereafter, medium was removed from the cultures, cell layers were washed with phosphate-buffered saline (PBS), and cells were detached by incubation with 0.25% trypsin-EDTA (Gibco-BRL).

hMSCs were recovered by centrifugation and resuspended in PBS.

Neuronal induction of hMSCs

hMSCs were grown in DMEM-low glucose supplemented with 10% FBS (Gibco-BRL) and 1% penicillin-streptomycin (Gibco-BRL). hMSCs were pretreated with 2 mM beta- mercaptoethanol (Sigma-Aldrich, St. Louis) for 24 hours and with 2 mM beta-mercaptoethanol for 3 hours prior to neuronal induction. The pretreated hMSCs were incubated in neuronal induction media (NIM) consisting of 2% DMSO (Sigma-Aldrich), 200 µ M butylated hydroxyanisole (Sigma- Aldrich), 10 µ M forskolin (Sigma-Aldrich), 2 mM valproic acid (Sigma-Aldrich) and 10 mM KCl (Sigma-Aldrich) in DMEM-low glucose containing N2 supplement (Gibco- BRL) for 6 hours.

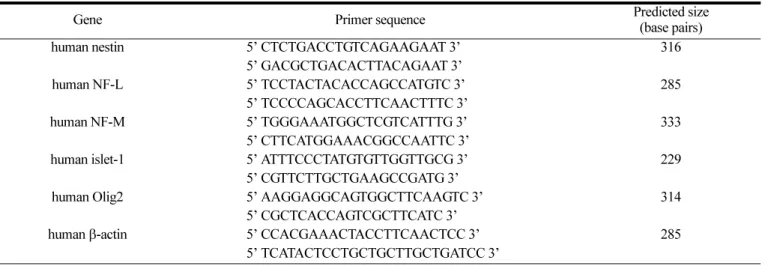
Reverse Transcription-Polymerase Chain Reaction Total RNA was extracted using the TRIzol reagent (Invitrogen, Carlsbad, CA) according to the manufacturer’s instructions followed by DNAse treatment, and reverse transcribed to cDNA by using M-MLV reverse transcriptase (Invitrogen). Aliquots of cDNA (200 ng) were used as input in PCR reactions (50 µ l) containing 200 nM dNTPs, 100 pM of each primer pair, and 0.5 U of Taq DNA polymerase (Takara Bio, Tokyo). Table 1 displays the primer probe sets used for the reverse transcription-PCR experiments. Products were visualized by electrophoresis through a 2% agarose gel. The housekeeping gene β -actin was used as an internal standard. The respective mRNAs were quantified by den- sitometric analysis using a Gel Doc system (Bio-Rad, Hercules) and Multi-Analyst software (Bio-Rad). The mRNA

Table 1. Polymerase chain reaction primer pairs

Gene Primer sequence Predicted size

(base pairs)

human nestin 5’ CTCTGACCTGTCAGAAGAAT 3’ 316

5’ GACGCTGACACTTACAGAAT 3’

human NF-L 5’ TCCTACTACACCAGCCATGTC 3’ 285

5’ TCCCCAGCACCTTCAACTTTC 3’

human NF-M 5’ TGGGAAATGGCTCGTCATTTG 3’ 333

5’ CTTCATGGAAACGGCCAATTC 3’

human islet-1 5’ ATTTCCCTATGTGTTGGTTGCG 3’ 229

5’ CGTTCTTGCTGAAGCCGATG 3’

human Olig2 5’ AAGGAGGCAGTGGCTTCAAGTC 3’ 314

5’ CGCTCACCAGTCGCTTCATC 3’

human β -actin 5’ CCACGAAACTACCTTCAACTCC 3’ 285

5’ TCATACTCCTGCTGCTTGCTGATCC 3’

(3)

level of a given gene was normalized to the corresponding

β -actin level, and the ratio of mRNA level relative to control transcript level was presented.

Immunofluorescence

Cells on coverslips were fixed with 4% paraformaldehyde at room temperature for 30 minutes and permeabilized for 10 minutes with 0.2% Triton X-100 and 1% bovine serum albumin (BSA) in PBS. Blocking was performed by incubating cells for 1 hour with 5% normal goat serum in PBS. Cells were then incubated overnight at 4

o

C with the following primary antibodies: polyclonal rabbit anti- neurofilament-M, 1 : 400 (Chemicon, Temecula, CA). After washing with PBS, cells were incubated with the following secondary antibodies : goat anti-mouse conjugated with Alexa Fluor 488, 1 : 500 (Invitrogen), goat anti-rabbit con- jugated with Alexa Fluor 546, 1 :5 00 (Invitrogen). All cells were counterstained with 4,6-diamidino-2-phenylindole (DAPI) (Santa Cruz Biotechnology, Santa Cruz, CA) for nuclear staining and mounted with fluorescent mounting medium (Dako). Immunofluorescence was examined using a laser-scanning confocal microscope, Fluoview FV300 (Olympus, Tokyo).

Bromodeoxyuridine Incorporation

For bromodeoxyuridine (BrdU) staining, cells were in- cubated at 37

o

C with 10 µ M BrdU (Sigma-Aldrich) for 24 hours. Cells were then fixed with 4% paraformaldehyde and washed with PBS, and the DNA was denatured with 2 N HCL for 30 minutes at 37

o

C and neutralized with 0.1 M sodium borate (pH 8.5) for 10 minutes at room temperature.

The rest of the protocol is a standard immunocytochemistry.

Monoclonal mouse anti-BrdU, 1 : 200 (Chemicon) was

used as primary antibody. Detection with fluorochrome- conjugated secondary antibody and nuclear staining was performed as described above.

Statistical Analysis

The data were analyzed by one-way analysis of variance (ANOVA) followed by post hoc comparisons with Fisher’s protected least significant difference (PLSD) test. A probability value of < 0.05 was considered statistically significant. All values were expressed as the mean ± standard error of mean (SEM).

Results

Changes in Cell Morphology after Neuronal Induction of hMSCs

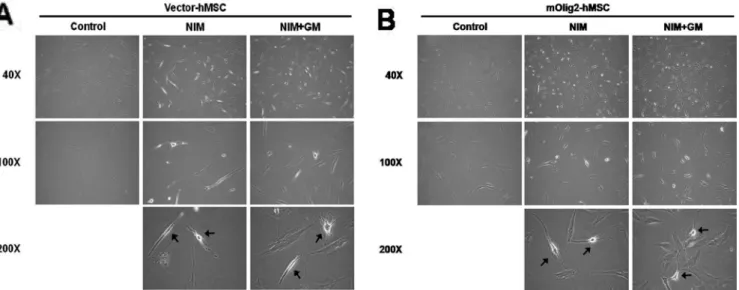
Both untreated vector-hMSCs and untreated mOlig2- hMSCs exhibited a flattened fibroblast-like morphology (Fig. 1A and 1B). After neuronal induction, the morphology of cells changed into neuron-like cells. Both 70-80% of vector- hMSCs induced to neuron-like cells (vector-hMSCs+NIM) and mOlig2-hMSCs induced to neuron-like cells (mOlig2- hMSCs+NIM) showed the rounded cell body with extended processes (Fig. 1A and 1B). To determine whether the mor- phology of vector-hMSCs+NIM or mOlig2-hMSCs+NIM could be maintained in growth medium without any of factors used in induction, we cultured fully induced cells in growth medium for 2 days. Approximately a half of the cells (vector- hMSCs+NIM+GM, mOlig2-hMSCs+NIM+GM) maintained a neuron-like morphology even after being cultured for 2 days in growth medium (Fig. 1A and 1B).

Fig. 1. Changes in cell morphology after neuronal induction of vector-hMSCs and mOlig2-hMSCs.

(A, B): Bright-field images of untreated group, neuronal induction medium (NIM)-treated group, and group maintained in growth medium for 2 days after complete induction in vector-hMSCs (A) and mOlig2-hMSCs (B). Cells exhibiting neuronal morphology are indicated by arrow.

Magnification: × 40 (top), × 100 (middle), and × 200 (bottom).

(4)

180 Soonyi Oh, Hwan-Woo Park, Jung-Sun Cho, Heekyung Jung, Seung-Pyo Lee, Ki-Suk Paik and Mi-Sook Chang

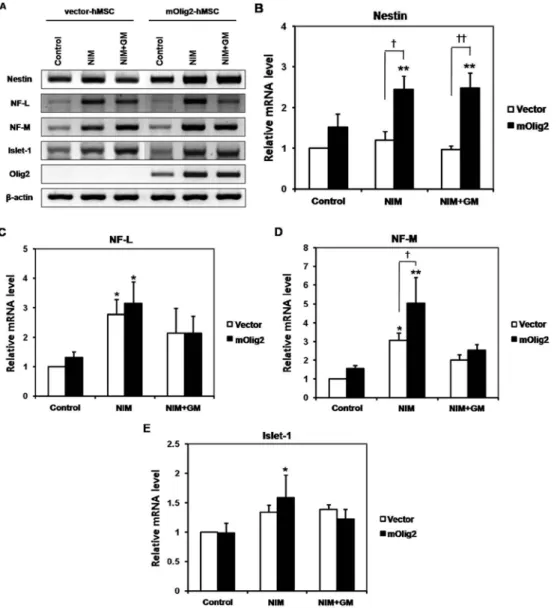
Expression of the Neuronal Markers in Induced hMSCs We performed reverse transcription-polymerase chain reaction to determine the expression of the neuronal marker genes, such as nestin, NF-L, NF-M and islet-1 (Fig. 2A).

After neuronal induction of mOlig2-hMSCs, mRNA levels of nestin, an early neuronal marker, was significantly increased as compared to the control (2.45 ± 0.32, p < .001), and this level was maintained after being cultured in growth medium for 2 days (2.49 ± 0.37, p < .001) (Fig. 2B). In contrast, there was no change in nestin mRNA levels in all groups of vector-hMSCs. Thus, this result suggests that Olig2 overexpression increased nestin transcript levels. The mRNA level of neurofilament-L (NF-L), a mature neuronal

marker, was significantly increased in both NIM-treated hMSCs (vector-hMSCs, 2.78 ± 0.50, p < .05; mOlig2-hMSCs, 3.14 ± 0.73, p < .05) as compared to the control (Fig. 2C).

However, the level was decreased to that of control after culturing cells in growth medium for 2 days. Another mature neuronal marker, Neurofilament-M (NF-M) mRNA levels were also significantly increased in both NIM-treated hMSCs (vector-hMSCs, 3.06 ± 0.39, p < .05; mOlig2-hMSCs, 5.04 ± 1.38, p < .001) as compared to the control (Fig. 2D).

Furthermore, there was a significant difference between vector- and Olig2-hMSCs. This result suggests that Olig2 overexpression potentiates the effect of NIM on NF-M expression. The mRNA level of islet-1, a motor neuron

Fig. 2. Changes in neuronal marker genes expression after neuronal induction of vector-hMSCs and mOlig2-hMSCs.

(A): Reverse transcription-polymerase chain reaction of Nestin, NF-L, NF-M, Islet-1 and Olig2 transcript levels in vector-hMSCs and mOlig2-hMSCs. The β -actin was used as an internal standard. (B-E): Quantitative analysis of mRNA levels of nestin (B), NF-L (C), NF-M (D), and Islet-1 (E) in untreated vector- or mOlig2-hMSCs, NIM-treated vector- or mOlig2-hMSCs (NIM), and vector- or mOlig2-hMSCs in growth medium for 2 days after complete induction (NIM+GM). The mRNA level of a given gene was quantified by densitometry and normalized to the corresponding β -actin level. The ratio of the mRNA level relative to that of the control transcript is presented. The experiment was repeated at least three independent times and mean ± SEM plotted. * p < .05, ** p < .001 versus untreated vector-hMSCs.

† p < .05, †† p < .001 versus vector-hMSCs. ANOVA followed by post hoc Fisher PLSD test.

(5)

marker, was significantly increased only in NIM-treated mOlig2-hMSCs (1.59 ± 0.38, p < .05) as compared to controls (Fig. 2E). This result suggests that both Olig2 overexpression and NIM culture condition were required for increasing islet-1 mRNA levels.

Expression pattern of neuronal marker protein after neuronal induction of vector-hMSCs and mOlig2- hMSCs

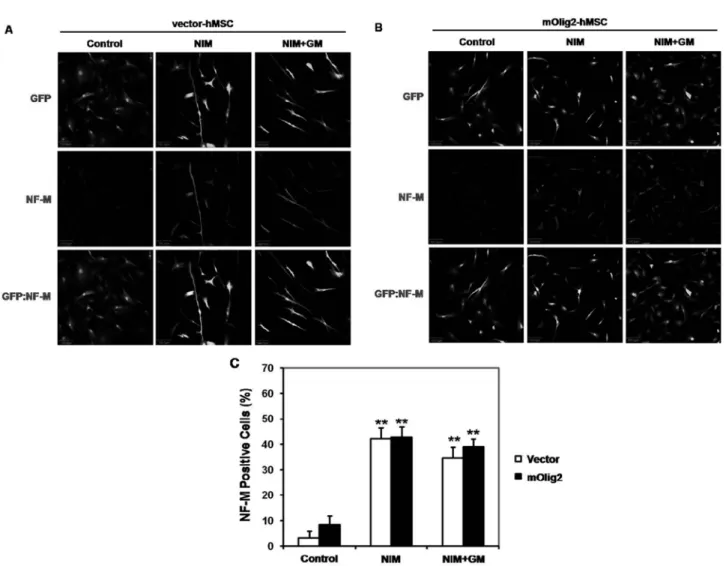
We then performed immunocytochemistry analysis to determine the expression of neuronal marker protein, NF-M (Fig 3A and 3B). Quantitative analysis indicated that a small portion of both hMSCs were NF-M-positive cells (vector- hMSCs, 3.33 ± 2.6%; mOlig2-hMSCs, 8.48 ± 3.3%) (Fig.

3C). However, after neuronal induction, the percentage of cells expressing NF-M proteins were significantly increased as compared to controls (vector-hMSCs+NIM, 42.24 ± 4.2%,

p < .001; mOlig2-hMSCs+NIM, 42.77 ± 4.1%, p < .001).

Furthermore, the increased level of NF-M maintained after being cultured in growth medium for 2 days (vector-hMSCs+

NIM+GM, 34.70 ± 4.3%, p < .001; mOlig2-hMSCs+NIM+

GM, 39.04 ± 3.0%, p < .001). These results suggest that NIM treatment increased expression of neuronal marker NF-M in both vector-hMSCs and mOlig2-overexpressing hMSCs.

Cell Cycle Arrest Occurs in hMSCs Induced to Neuronal Cells

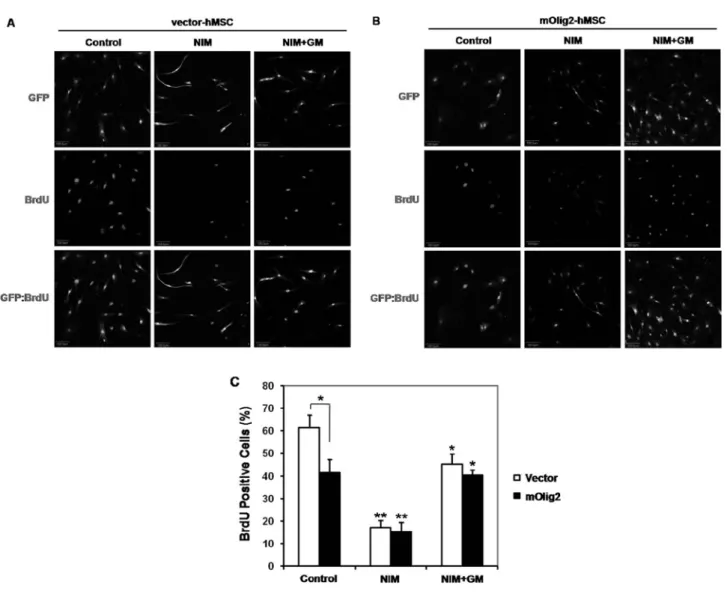
In many cases, differentiation into a certain cell type is associated with the cell cycle exit and the arrest of cell proliferation (Lipinski and Jacks, 1999). Thus, we sought to determine whether neuronal induction of hMSCs leads to cell cycle arrest by examining BrdU incorporation in each group (Fig. 4). BrdU-incorporated cells were significantly decreased in vector-hMSCs+NIM (17.16 ± 3.2%, p < .001)

Fig. 3. Expression of neuronal marker protein NF-M after neuronal induction of vector-hMSCs and mOlig2-hMSCs.

(A, B): Fluorescence images of neuronal marker NF-M (red), GFP (green) in untreated group, NIM-treated group, and group maintained in

growth medium for 2 days after complete induction in vector-hMSCs (A) and mOlig2-hMSCs (B). Scale bars: 100 µ m. (C): Quantitative anal-

ysis of neuronal marker NF-M expression in untreated vector- or mOlig2-hMSCs, NIM-treated vector- or mOlig2-hMSCs (NIM), and vector-

or mOlig2-hMSCs in growth medium for 2 days after complete induction (NIM+GM). The percentage of hMSCs expressing NF-M was

determined. The experiment was repeated three independent times and mean ± SEM plotted. * p < .05, ** p < .001 versus untreated vector-

hMSCs. ANOVA followed by post hoc Fisher PLSD test.

(6)

182 Soonyi Oh, Hwan-Woo Park, Jung-Sun Cho, Heekyung Jung, Seung-Pyo Lee, Ki-Suk Paik and Mi-Sook Chang

and vector-hMSCs+NIM+GM (45.26 ± 4.4%, p < .05) as compared to vector-hMSCs (61.47 ± 5.6%) (Fig. 4C).

BrdU-incorporated cells were also significantly decreased in mOlig2-hMSCs+NIM (15.43 ± 4.0%, p < .001) and mOlig2-hMSCs+NIM+GM (40.30 ± 2.3%, p < .05) as compared to vector-hMSCs (Fig. 4C). Interestingly, BrdU- incorporated cells were significantly decreased in untreated mOlig2-hMSCs (41.45 ± 5.9%, p < .05) as compared to vector-hMSCs. This result suggests that there is a clear correlation between neuronal induction and cell cycle arrest.

Discussion

After neuronal induction by NIM, mRNA levels of mature neuronal markers, NF-L and NF-M, were significantly

increased in both vector- and mOlig2-hMSCs. This effect was also potentiated by Olig2 overexpression in case of NF- M mRNA levels. In addition, Olig2 overexpression increased mRNA levels of nestin and islet-1, while NIM alone did not.

Although there was no significant difference regarding the percentage of cells expressing NF-M proteins between vector- and mOlig2-hMSCs, Olig2 overexpression itself without NIM treatment significantly decreased BrdU-incorporated cells. This suggests that Olig2 overexpression might be sufficient to cause cell cycle arrest. It will be necessary to determine whether Olig2 regulates the expression of cell cycle genes, which results in cell cycle arrest. In this study, although we could not see any dramatic effect on neuronal induction by Olig2 overexpression as compared to the control, it was likely that the NIM effect was potentiated by Olig2 overexpression.

Fig. 4 . BrdU incorporation after neuronal induction of vector-hMSCs and mOlig2-hMSCs.

(A, B): Fluorescence images of incorporated BrdU (red) and GFP (green) in untreated group, NIM-treated group, and group maintained in growth medium for 2 days after complete induction in vector-hMSCs (A) and mOlig2-hMSCs (B). Scale bars: 100 µ m. (C): Quantitative analysis of incorporated BrdU in untreated vector- or mOlig2-hMSCs, NIM-treated vector- or mOlig2-hMSCs (NIM), and vector- or mOlig2- hMSCs in growth medium for 2 days after complete induction (NIM+GM). The percentage of hMSCs incorporating BrdU was determined.

The experiment was repeated three independent times and mean ± SEM plotted. * p < .05, ** p < .001 versus untreated vector-hMSCs.

ANOVA followed by post hoc Fisher PLSD test.

(7)

Observations regarding the transdifferentiation of MSCs into neural cells with non-mesodermal lineage have been controversial (Sanchez-Ramos et al ., 2000; Woodbury et al ., 2000; Munoz-Elias et al ., 2003; Neuhuber et al ., 2004).

Moreover, it remains unclear how MSCs can transdifferentiate into neural cells. However, MSCs have recently been reported as an actual tissue component with multiple developmental origins, including neural crest-derived stem cells (NCSCs) (Takashima et al ., 2007; Miller, 2007). NCSCs have also been identified as a subpopulation of MSCs in the adult bone marrow (Nagoshi et al ., 2008). This suggests that our induced hMSCs may have originated from NCSCs present in hMSCs. It will be necessary to determine whether NCSCs can be identified as a subpopulation of hMSCs.

Taken together, our study demonstrates that hMSCs can be induced to neuron-like cells in vitro . Furthermore, the induction can be potentiated by overexpressing a specific gene, involved in neuronal differentiation. Our study provides important preclinical data attesting to the potential efficacy of the administration of hMSCs induced to neuron-like cells to treat nervous system injury since hMSCs are a desirable cell source for autologous cell therapy.

Acknowledgements

This research was supported by a grant from the National Research Foundation of Korea (M-SC, 2006-KRF-531- C00043).

References

Bianco P, Riminucci M, Gronthos S, Robey PG. Bone marrow stromal stem cells: nature, biology, and potential applications.

Stem Cells. 2001;19:180-192.

Boillee S, Va nde Velde C, Cleveland DW. ALS: a disease of motor neurons and their nonneuronal neighbors. Neuron.

2005;52:39-59.

Kang H, Cha ES, Choi Y, Min BM, Roh S. Osteogenic differentiation potential in parthenogenetic murine embryonic stem cells. International Journal of Oral Biology. 2008;33 :91-95.

Jung JY, Byun KO, Jeong YJ, Kim WJ. Age-related changes of adult neural stem cells in the mouse hippocampal dentate gyrus. International Journal of Oral Biology. 2008;33:59-64.

Lu QR, Sun T, Zhu Z, Ma N, Garcia M, Stiles CD, Rowitch

DH. Common developmental requirement for Olig function indicates a motor neuron/oligodendrocyte connection. Cell.

2002;109:75-86.

Lu QR, Yuk D, Alberta JA, Zhu Z, Pawlitzky I, Chan J, McMahon AP, Stiles CD, Rowitch DH. 2000. Sonic hedgehog- -regulated oligodendrocyte lineage genes encoding bHLH proteins in the mammalian central nervous system. Neuron.

2000;25:317-329.

Miller FD. Riding the waves: neural and nonneural origins for mesenchymal stem cells. Cell Stem Cell. 2007;1:129-130.

Munoz-Elias G, Woodbury D, Black IB. Marrow stromal cells, mitosis, and neuronal differentiation: stem cell and precursor functions. Stem Cells. 2003;21:437-448.

Nagoshi N, Shibata S, Kubota Y, Nakamura M, Nagai Y, Satoh E, Morikawa S, Okada Y, Mabuchi Y, Katoh H, Okada S, Fukuda K, Suda T, Matsuzaki Y, Toyama Y, Okano H.

Ontogeny and multipotency of neural crest-derived stem cells in mouse bone marrow, dorsal root ganglia, and whisker pad. Cell Stem Cell. 2008;2:392-403.

Neuhuber B, Gallo G, Howard L, Kostura L, Mackay A, Fischer I. Reevaluation of in vitro differentiation protocols for bone marrow stromal cells: disruption of actin cytoskeleton induces rapid morphological changes and mimics neuronal phenotype. J Neurosci Res. 2004;77:192-204.

Park HC, Mehta A, Richardson JS, Appel B. olig2 is required for zebrafish primary motor neuron and oligodendrocyte development. Dev Biol. 2002;248:356-368.

Pittenger MF, Mackay AM, Beck SC, Jaiswal RK, Douglas R, Mosca JD, Moorman MA, Simonetti DW, Craig S, Marshak DR. Multilineage potential of adult human mesenchymal stem cells. Science. 1999;284:143-147.

Prockop DJ. Marrow stromal cells as stem cells for nonhema- topoietic tissues. Science. 1997;276:71-74.

Sanchez-Ramos J, Song S, Cardozo-Pelaez F, Hazzi C, Stedeford T, Willing A, Freeman TB, Saporta S, Janssen W, Patel N, Cooper DR, Sanberg PR. Adult bone marrow stromal cells differentiate into neural cells in vitro. Exp Neurol. 2000;164:

247-256.

Takashima Y, Era T, Nakao K, Kondo S, Kasuga M, Smith AG, Nishikawa S. Neuroepithelial cells supply an initial transient wave of MSC differentiation. Cell. 2007;129:1377-1388.

Thuret S, Moon LD, Gage FH. Therapeutic interventions after spinal cord injury. Nat Rev Neurosci. 2006;7:628-643.

Trzaska KA, Kuzhikandathil EV, Rameshwar P. Specification of a dopaminergic phenotype from adult human mesenchymal stem cells. Stem Cells. 2007;25:2797-2808.

Woodbury D, Schwarz EJ, Prockop DJ, Black IB. Adult rat

and human bone marrow stromal cells differentiate into

neurons. J Neurosci Res. 2000;61:364-370.

수치

Table 1.  Polymerase chain reaction primer pairs
Fig. 1.  Changes in cell morphology after neuronal induction of vector-hMSCs and mOlig2-hMSCs
Fig. 2.  Changes in neuronal marker genes expression after neuronal induction of vector-hMSCs and mOlig2-hMSCs
Fig. 3.  Expression of neuronal marker protein NF-M after neuronal induction of vector-hMSCs and mOlig2-hMSCs.
+2

참조

관련 문서

Histopathologic findings of control group at 4 weeks show little bone- implant contact (BIC) around the implant (asterisks) and new-bone formation in the defect

First, after the Group Art Therapy, the scale of hopelessness depression in the test group decreased significantly in comparison with that before the group

In 4-week group, the group filled with bone graft with decortication revealed larger new bone formation area than shown in the group that had a defect area

Diagrams show the spatial distribution of individual trees and stand profile(a), crown projection(b) for Group of Quercus glauca... The comparison of

platensis under variously mixed medium conditions of low cost medium based on deep sea water.. platensis in the growth medium at 22 days

2) In between-group comparison before and after elastic band exercise, a significant difference was found in the percentage of body fat, fat-free

The 24hr proteinuria level were increased in kidney with cyclosporine-A group but significantly decreased in iNOS inhibitor and green tea polyphenol group..

Approved clinical use of bone marrow stem cells for myocardial infarction treatment... Cardiac