Korean J. Mater. Res.
Vol. 25, No. 11 (2015)
630
Effect of Crystallographic Orientation on Fracture Mechanism of Ni-Base Superalloy
Chang-Suk Han † and Sang-Yeon Lim 1
Department of Defense Science & Technology, Hoseo University
1Department of Nanobiotronics, Hoseo University Hoseo-ro 79 beon-gil, Baebang-Myun, Asan City, Chungnam 336-795, Korea
(Received September 11, 2015 : Revised October 2, 2015 : Accepted October 12, 2015)
Abstract
The fatigue strength of a nickel-base superalloy was studied. Stress-controlled fatigue tests were carried out at 700oC and 5 Hz using triangular wave forms. In this study, two kinds of testing procedures were adopted. One is the conventional tension-zero fatigue test(R = 0). The other was a procedure in which the maximum stress was held at 1000 MPa and the minimum stress was diverse from zero to 1000 MPa at 24 and 700oC. The results of the fatigue tests at 700oC indicate that the fracture mechanism changed according to both the mean stress and the stress range. At a higher stress range, γ' precipitates are sheared by a/2<110> dislocation pairs coupled by APB. Therefore, in a large stress range, the deformation occurred by shearing of γ' by a/2<110> dislocations, which brought about crystallographic shear fracture. As the stress range was decreased, the fracture mode gradually changed from crystallographic shear fracture to gradual growth of fatigue cracks.At an intermediate stress range, as it became more difficult for a/2<110> dislocation pairs to shear γ' particles, cracks started to propagate in the matrix, avoiding the harder γ' particles. High mean stress induced creep deformation, that is, γ' particles were sheared by {111}<112> slip systems, which led to the formation of stacking faults in the precipitates. Thus, the change in fracture mechanism brought about the inversion of the S-N curves.
Key words
fatigue strength, nickel-base superalloy, S-N behavior, creep deformation.1. Introduction
In the present study, two kinds of fatigue test method were employed so as to investigate the effect of the maximum stress, stress range and mean stress on fatigue life. One is the conventional tension-zero fatigue test at 700
oC. An-other is the procedure in which the maximum stress was held at 1000 MPa and the minimum stress was diverse from zero to 1000 MPa at 24 and 700
oC.
This procedure is used in cyclic creep studies and can represent certain low cycle mission conditions in gas turbine or jet engine application.
1-6)The testing method employed in this study was first proposed and used by Paulson et al.
1)for determining the creep-fatigue behavior of UDIMET 115 at 760
oC. The difference between this method and conventional fatigue test is that the cyclic stress(fatigue) and the damage attributed to the mean stress can be separated.
3,7)The present study was carried out in order to know the effect of crystallographic orientation on the fatigue strength and influence of stress range(fatigue damage) and mean stress(creep damage) on rupture lives of a Ni- base superalloy.
2. Experimental Procedure
The chemical composition of a superalloy tested in the present study is listed in Table 1. Single crystals were grown from the melt by the Bridgman method. After the analysis of the crystallographic orientation by the back Laue reflection method, specimens for fatigue tests were cutting from the as-grown crystals by a cutting machine.
The test pieces had the shape and size illustrated in Fig. 1.
The specimens were solution treated at 1280
oC for 12 hours. The specimens were aged at 1080
oC for 12 hours and subsequently aged at 850
oC for 20 hours. After
†
Corresponding author
E-Mail : [email protected] (C. -S. Han, Hoseo Univ.)
© Materials Research Society of Korea, All rights reserved.
This is an Open-Access article distributed under the terms of the Creative Commons Attribution Non-Commercial License (http://creative-
commons.org/licenses/by-nc/3.0) which permits unrestricted non-commercial use, distribution, and reproduction in any medium, provided the
original work is properly cited.
aging, specimens were cooled in iced-water. The fatigue tests were carried out under nominal stress controlled condition using a triangular wave form at 5 Hz. Testing temperatures were 24
oC and 700
oC. The latter tempera- ture was selected since usual tensile tests of the alloy showed the positive temperature dependence of yield stress between 500
oC and 800
oC in almost orientations.
The initial loading orientations will be shown in the following figures.
In this study, two kinds of testing procedure were adopted. Test A: the tension-zero fatigue test(the mini- mum stress was held at 0 MPa and the positive maximum stress was varied, that is, R = 0, Fig. 2(a)). Test B: the maximum stress(Fig. 2(b)). Fracture surfaces were ob- served by scanning electron microscopy(SEM). Some of tested specimens were observed by transmission electron microscopy(TEM).
3. Results
3.1 Fatigue Test A
The S-N curves of zero-tension fatigue test at 700
oC are shown in Fig. 3. The fatigue lives of [001] specimens
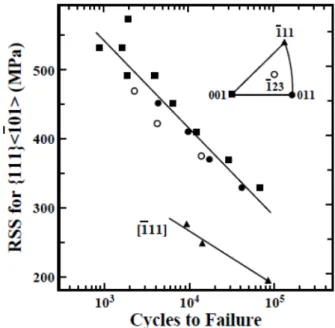
were longer than those of other orientations, and the [ 23] specimens showed shorter fatigue lives than those of other orientations. If the maximum stress is represented by the maximum resolved shear stress for the usual {111}< 01> type slip systems, Fig. 3 becomes as Fig. 4.
In Fig. 4, the fatigue strengths in [001], [011] and [ 23]
orientations almost fell on a master line. But, the fatigue strengths in [ 11] orientation were far lower than those in the other orientations.
1
1
1 1
Table 1. Chemical composition of a superalloy(mass %).
Cr Mo Co W Ta Ti Al Si V Ni
10.25 < 0.01 5.13 4.00 12.07 1.62 5.30 0.05 < 0.01 Bal.
Fig. 1. Fatigue specimen (mm).
Fig. 2. Forms of stress wave.
Fig. 3. S-N curves of Fatigue Test A at 700
oC(R = 0).
Fig. 4. Relation between fatigue lives and RSS for {111}< 01> slip systems.
1
3.2 Fatigue Test B
Fig. 5 shows the S-N curves at 700
oC when the maxi- mum stress was held at 1000 MPa and the cyclic stress range was varied by changing the minimum stress. The rupture lives in case of the cyclic stress range being 0 MPa in Fig. 5 is the result of static creep test. As the stress range decreased from 1000 MPa to 400 MPa, the fatigue life of the [001] specimen was increased by two orders of magnitude and more. A further decrease in stress range ultimately reduced the fatigue life. Thus, the S-N curve showed inversion at low stress range. The rupture lives of [011] and [111] crystals were also in- creased by about two orders of magnitude with the decrease in stress range from 1000 MPa to 400 MPa, but the rupture lives decreased with the further decrease in stress range from 400 MPa.
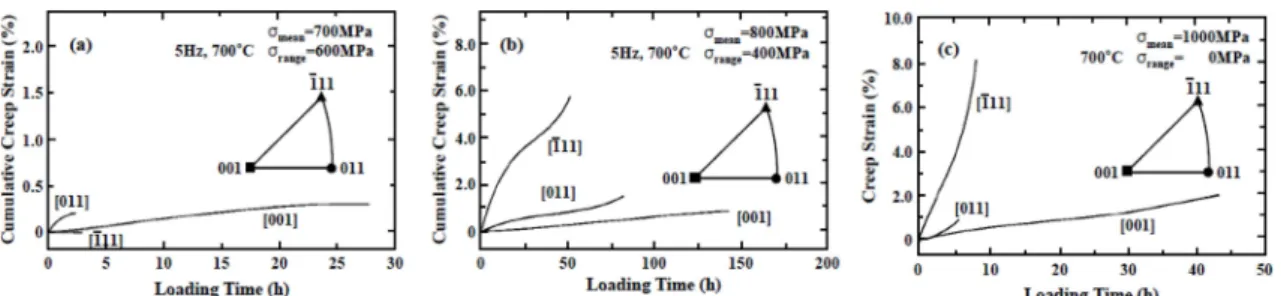
Dynamic plastic strain or cumulative creep strain curves for three typical stress ranges are shown in Fig. 6.
The cumulative creep strain for the mean stress of 700 MPa was very small in the three orientations(Fig. 6(a)).
When the mean stress was smaller than 700 MPa, the cumulative creep strain was no longer observed. As indicated in Fig. 6(b), when the mean stress was in- creased to 800 MPa, the cumulative creep strain became
larger and especially pronounced in the [111] orientation.
These curves may consist of the three stages which are assigned to usual static creep. The static creep curves for the mean stress of 1000 MPa are shown in Fig. 6(c). The curve of [001] showed typical three stages of creep and its rupture life was significantly longer than those of [011] and [111]. The rupture plastic strain of [111] was larger than those of [001] and [011].
Fig. 7. shows the S-N curves at 24
oC where the maxi- mum stress was held at 1000 MPa and the cyclic stress range was varied by changing the minimum stress. Com- pared with the inversion of S-N curves at 700
oC(Fig. 5), the S-N behaviors at 24
oC were downward sloping(Fig.
7). It was found that the [001] crystals exhibited shorter fatigue lives than those of [011] and [111] in contrast with S-N curves at 700
oC. The fatigue life of [111] was slightly longer than those of [011].
The comparison between S-N curves at 24
oC and those at 700
oC are shown in Fig. 8. The rupture lives at 700
oC were longer than those at 24
oC in the stress ranges from 1000 to 400 MPa. Especially in the [001], the difference was large. However, the two S-N curves intersected, and inversions of rupture life occurred at the stress range of 200 MPa in every orientation. The dif- ference between fatigue lives at 24
oC and those of 700
o
C were largest at the stress range of 400 MPa.
Fig. 5. S-N curves of Fatigue Test B at 700
oC.
Fig. 6. Dynamic creep curves for three stress conditions.
Fig. 7. S-N curves of Fatigue Test B at 24
oC.
3.3 Fractography
3.3.1 Fatigue Test A at 700
oC
The fatigue tests were performed at 700
oC under σ
min= 0 MPa and σ
max= 700-1300 MPa. When the maximum stress was medium or low, fatigue crack growth was clearly recognized. An example is shown in Fig. 9. In many cases, fatigue cracks initiated at casting pores, for example, Fig. 9(b), and rarely at the corner of specimens.
The cracks gradually grew roughly normal to the tensile axis, Fig. 9(a). At a higher magnification(Fig. 9(c)), cuboidal γ' particles were observed in the crack pro- pagated region. The diameter of fatigue crack tended to
increase with the decrease in the maximum tensile stress.
Under a high maximum stress, fatigue crack was very small and most of the fracture surfaces were flat and featureless and parallel to the octahedral slip planes.
Such example is Fig. 10.
3.3.2 Fatigue Test B at 700
oC
In Fatigue Test B, σ
min= 0-1000 MPa and σ
max= 1000 MPa. At large stress ranges, the fracture along slip planes was dominant in every orientation. In [001], as stress Fig. 8. Comparisons between S-N curves of Fatigue Test B at 24
oC and those at 700
oC.
Fig. 9. Fracture surface of [011] specimen(Fatigue Test A under σ
min= 0 MPa and σ
max= 900 MPa at 700
oC). (a) The gradual crack growth roughly normal to the tensile axis, (b) micropore, (c) cuboidal
γ' particles. Fig. 10. Fracture along crystallographic octahedral slip plane of
[001] specimen(Fatigue Test A under σ
min= 0 MPa and σ
max= 1300 MPa at 700
oC).
Fig. 11. Fracture surfaces of [001] specimen (a) at 700
oC and (b), (c) at 24
oC under σ
mean= 800 MPa and σ
range= 400 MPa.
range was decreased to 400 MPa, the fracture mode gradually changed from crystallographic shear fracture to gradual growth of fatigue crack(Fig. 11(a)). Similar tendency was observed in [011] and [111]. In the crack- propagated region, at a higher magnification, the same cuboidal γ' particles as shown in Fig. 9(a) were observed.
The gradual growth of fatigue crack was more out- standing than the fracture along slip plane at the mean stress of 800 MPa, that is, at the noses of S-N curves in three orientations. However, at the mean stress of 900 MPa, the fracture of the [011] and [111] specimens came to occur along {111} slip planes again.
3.3.3 Fatigue Test B at 24
oC
Fracture along crystallographic slip plane(Fig. 11(b)) and crystallographic local facets(Fig. 11(c)) were observed.
4. Discussion
In case of a high strain-rate like a tensile test of Ni- base superalloy, {111}< 01> slip system are operative at 700
oC.
8)Milligan et al. studied in detail the dislocation structure after strain-controlled fatigue at 760
oC and 0.1 Hz.
9)They determined that the majority of these dislocations were of {111}< 01> systems with the maxi- mum Schmid factor. In the present fatigue tests of type A at 700
oC, as shown in Fig. 4, the maximum resolved shear stress for {111}< 01> type slip systems in the [001], [011] and [ 23] orientations approximately fell on a master line. Therefore, the fatigue in these orientations are supposed to be controlled by the operation of {111}
< 01> slip system. The main reason why the fatigue lives of [ 23] were shorter than other orientations in Fig.
3 is likely due to larger value of Schmid factor for {111}< 01>. However, the lives of [111] in Fig. 4 was lower than those of others. One explanation for this may be that the [111] orientation has low Schmid factor for {111}< 01> and thus another mechanism might occur.
In both fatigue tests at 700
oC, γ' precipitates are sheared by a/2<110> dislocation pairs coupled by APB at higher stress range(Fig. 12). Therefore, at large stress range, the deformation occurs by shearing of γ' by a/
2<110> dislocations, which brought out crystallographic shear fracture.
As stress range was decreased, gradual crack growth was observed at 700
oC. At a higher magnification, cuboidal γ' particles were found in the crack propagated region(Fig. 9(c)). The reason for this is attributed to the fact that γ' precipitates are cuboidal and its interfaces are parallel to {001}. In audition, the γ' precipitates is well known to become harder with increasing in temperature up to about 750
oC ~ 850
oC, Consequently, dislocations were confined to the matrix between the precipitates.
Even though deformation in the matrix between the pre- cipitates probably occurs on the {111} planes, the heavily damaged region are macroscopically parallel to {100}
and final fracture would occur in these area. Therefore, crack propagation occurs primarily within the γ matrix.
At the noses of S-N curves shown in Fig. 5, fatigue lives of three orientation were longest because it was difficult for dislocations to shear γ' particles due to low stress range and harder γ' particle. On the other hand, at 24
oC, cuboidal γ' particles were softer, and therefore the easiness of shearing of γ' by dislocations resulted in crystallo- graphic shear fracture or crystallographic local facets on fracture surfaces(Fig. 11(b), (c)). Crompton et al.
10)also found in fatigue crack propagation tests of single crystals of Mar M 002 that crack growth takes place by shear related the {111} slip planes at room temperature, how- ever, crack growth occurs on {001} plane at 600
oC and 850
oC. The difference in fracture mechanisms might bring about the large difference between fatigue lives of 24
oC and those of 700
oC at the mean stress of 800 MPa in the present study.
As a conclusion, change in deformation and fracture mechanism brought about inversion of S-N curves at 700
oC. Rupture lives of [001] were longer than those of other orientations in all fatigue testing conditions. This is probably due to high tensile strength at large stress ranges and due to high creep strength at large mean stresses.
5. Conclusion
The results of fatigue tests at 700
oC indicated that fracture mechanism changed according to both mean stress and stress range. At a higher stress range, γ' precipitates are sheared by a/2<110> dislocation pairs coupled by APB. Therefore, at large stress range, the deformation occurred by shearing of γ' by a/2<110> dislocations, which brought about crystallographic shear fracture. As stress range was decreased, the fracture mode gradually changed from crystallographic shear fracture to gradual growth of fatigue crack. At an intermediate stress range, as it became more difficult for a/2<110> dislocation pairs to shear γ' particles, crack comes to propagate in the matrix avoiding harder γ' particles. High mean stress induced creep deformation, that is, γ' particles were sheared by {111}<112> slip systems, which led to the formation of stacking faults in the precipitates. Thus, the change in fracture mechanism brought about the inversion of S-N curves.
Acknowledgements
This research was supported by the Ministry of Trade, Industry and energy(MOTIE), KOREA, through the 1
1
1 1
1 1 1
1
Education Support program for Creative and Industrial Convergence.
References
1. R. R. Paulson, L. G. Fritzemeier and J. K. Tien, Metall.
Trans. A, 14A, 727 (1983).
2. C. S. Oh, Y. C. Kim, S. C. Kil and C. S. Han, Asian J.
Chem., 26, 1301 (2014).
3. P. L. Bretz, T. Denda and J. K. Tien, Elect. Beam Melting & Refining, State of the Art 1989, 282 (1989).
4. D. H. Bae, C. S. Oh and C. S. Han, Asian J. Chem., 26, 4107 (2014).
5. J. Coakley, D. Dye and H. Basoalto, Acta Mater., 59, 854 (2011).
6. M. K. Miller, S. S. Babu and J. M. Vitek, Intermetallics, 15, 757 (2007).
7. R. S. Bellows, E. A. Schwarzkopf and J. K. Tien, Metall.
Trans. A, 19A, 479 (1988).
8. T. Sakaki, K. Kakehi, T. Adachi and T. Tanaka, Creep and Fracture of Engineering Materials and Structures, Ed.
by B. Wilshire and R. W. Evans, Swansea, 313 (1990).
9. W. W. Milligan and N. Jayaraman, Mater. Sci. Eng., 82, 127 (1986).
10. J. S. Crompton and J. W. Martin, Metall. Trans. A, 15A, 1711 (1984).
![Fig. 9. Fracture surface of [011] specimen(Fatigue Test A under σ min = 0 MPa and σ max = 900 MPa at 700 o C)](https://thumb-ap.123doks.com/thumbv2/123dokinfo/5550829.470488/4.892.113.779.141.288/fig-fracture-surface-specimen-fatigue-test-mpa-mpa.webp)
