325
사료원료에 대한 넙치
Paralichthys olivaceus
의 소화율 평가김경덕✽・김동규 김신권 김강웅 손맹현 이상민・ ・ ・ ・ 1
국립수산과학원 사료연구센터,
1강릉원주대학교 해양생명공학부
Apparent Digestibility Coefficients of Various Feed Ingredients for Olive Flounder, Paralichthys olivaceus
Kyoung-Duck Kim*, Dong Gyu Kim, Shin-Kwon Kim, Kang-Woong Kim, Maeng Hyun Son and Sang-Min Lee
1Aquafeed Research Center, National Fisheries Research & Development Institute, Pohang 791-923, Korea
1
Faculty of Marine Bioscience & Technology, Gangneung-Wonju National University, Gangneung 210-702, Korea
The apparent digestibility coefficients of dry matter, crude protein and energy in white fishmeal, herring meal, anchovy meal, salmon meal, sardine meal, mackerel meal, squid meal, soybean meal, corn gluten meal and wheat flour were determined for olive flounder. Digestibility coefficients were determined using a reference diet and test diets that contained 70% of the reference diet mixture and 30% test ingredients.
All diets contained 0.5% chromic oxide as a digestibility indicator. The fish averaging 220 g were held in 500 L tanks at a density of 20 fish per tank. Feces were collected from three replicated groups of fish using a fecal collection column attached to a fish-rearing tank. The apparent dry matter, crude protein and energy digestibility coefficient values observed were in the ranges 29 79%, 59 95% and 45 91%,– – – respectively, for various test ingredients. The apparent dry matter, crude protein and energy digestibility of white fishmeal, herring meal, anchovy meal, salmon meal, sardine meal, mackerel meal and squid meal were significantly higher than those of soybean meal, corn gluten meal and wheat flour.
Key words: Apparent digestibility coefficients, Feed ingredients, Olive flounder
서 론
넙치는 성장이 빠르고 종묘생산 기술이 확립되어 있을 뿐 , 만 아니라 고밀도 사육이 가능하며 특히 우리나라와 일본에 , 서 횟감으로 선호도가 높아 양식 대상종으로 가치가 높은 어종이다.
어류양식에 소요되는 비용 중 사료비는 다른 요인들에 비해 상대적으로 높은 비율을 차지하므로 양식장 환경 및 질병과 함께 가장 중요하게 고려되어야 할 요인이다 그 동안 넙치 . 배합사료 개발에 필요한 자료를 위하여 단백질 지질 및 필수 , 지방산과 같은 영양소 요구량과 사료원료 이용성에 관한 연구 들이 활발하게 수행되어 왔다 (Lee et al., 2000; Kim et al., 또한 넙치 양식 2002; Lee and Kim 2005; Lee et al., 2008). ,
현장에서 주로 사용되고 있는 생사료와 배합사료의 사육효과 비교 연구를 통하여 배합사료로의 생사료 대체 가능성이 보고 되었다 (Kim et al., 2006, 2008). 이와 같이 양식 경쟁력 향상을 위해서는 양식어의 사육에 적합한 실용배합사료를 개발하여 양식 생산성을 높이는 반면 어분과 같은 값비싼 원료를 대체 , 할 수 있는 사료원료 개발 등을 통해 지속적으로 사료가격을 낮출 수 있도록 해야 한다.
양식어의 영양소 및 에너지 요구량을 충족시키며 배합사 , 료의 생산단가를 최소화할 수 있는 경제적인 사료원료를 사용 하기 위해서는 사료원료에 대한 소화율 측정은 필수적이다 성분 분석을 통하여 사료에 함유된 (Jafri and Hassan, 1999).
영양소 함량을 파악할 수는 있으나 양식어가 섭취한 사료 , 영양소들이 어체내에서 소화되지 못하여 제대로 흡수되지 , 않는다면 사료에 함유된 영양소들은 실제적인 영양적 가치를 갖지는 못할 것이다 영양성분 분석과 더불어 소화율의 측정 . 은 사료원료 중에서도 특히 단백질원의 영양적학 가치를 더욱 정확하게 평가할 수 있도록 한다 어류사료에 많이 사용되는 . 사료원료에 대한 영양소 및 에너지 외관상 소화율 (apparent
은 연어
digestibility coefficient) (Oncorhynchus kisutch ) 를 포함 한 주요 양식어종에서 보고되었다 (Bruce et al., 1996; Sugiura 넙치의 et al., 1998; Lee, 2002; Tibbetts et al., 2004, 2006).
경우 사료원료별 아미노산 및 에너지 소화율에 관한 연구가 수행되었으나 (Lee et al., 2008), 여러 종류의 어분을 포함한 양식사료 원료에 대한 건물 및 단백질과 같은 주요 영양소 소화율에 관한 연구는 제한적인 실정이다 그래서 본 연구는 . 상업적으로 많이 사용되고 있는 다양한 어분과 대두박 콘글 , 루텐밀 및 소맥분의 건물 조단백질 및 에너지에 대한 넙치의 , 외관상 소화율을 측정하기 위하여 수행되었다.
✽
Corresponding author: [email protected]
재료 및 방법
실험사료 실험에 사용한 표준사료 (reference diet) 는 단백질원으로 백색어분을 사용하였으며 지질원으로 오징어간유를 탄수화 , , 물원으로는 전분과 소맥분을 각각 사용하였다 α - (Table 1).
또한 소화율 측정을 위하여 산화크롬 (Cr
2O
3) 을 0.5% 첨가하 여 소화율 지표물질로 사용하였다 소화율 측정에 사용된 사 . 료원료는 백색어분 청어분 멸치분 연어분 정어리분 고등어 , , , , , 분 오징어분 대두박 콘글루텐밀 및 소맥분으로 총 종류이 , , , 10 며 (Table 2), 기초사료와 각 사료원료를 7:3 의 무게비율로 혼합하여 11 종류의 실험사료를 제조하였다 (Table 3). 모든 실험사료는 설계된 원료들을 잘 혼합한 후 원료 100 g 당 물 40 g 내외를 첨가하여 펠렛 제조기로 사료를 성형한 후 실온에서 시간 건조하였다 제조된 사료는 24 . -20 ℃ 에 보관하 면서 사용하였다.
실험어 관리 및 분 수집
자체적으로 설계 제조한 분 수집 장치가 연결된 500 L 실험 Table 1. Ingredients and nutrient contents of the reference diet
% Ingredients
White fishmeal
167
-Starch
α 5
Wheat flour 18
Squid liver oil 5
Vitamin premix
22
Mineral premix
32
Choline chloride 0.5
Chromic oxide 0.5
Nutrient contents (dry basis)
Crude protein 52.4
Crude lipid 9.9
Ash 13.0
Carbohydrate
424.7
Gross energy (cal/g) 4881
1
White fishmeal from Alaska supplied by Galim Engineering Co., Ltd., Seoul, Korea.
2
Vitamin mix contained the following amount which were diluted in cellulose (g/kg mix): L-ascorbic acid, 121.2; DL- -tocopheryl acetate, 18.8; thiamin hydrochloride, 2.7;
α riboflavin, 9.1; pyridoxine hydrochloride, 1.8; niacin, 36.4;
Ca-D-pantothenate, 12.7; myo-inositol, 181.8; D-biotin, 0.27; folic acid, 0.68; p-aminobenzoic acid, 18.2;
menadione, 1.8; retinyl acetate, 0.73; cholecalciferol, 0.003; cyanocobalamin, 0.003.
3
Mineral mix contained the following ingredients (g/kg mix):
MgSO
4·7H
2O, 80.0; NaH
2PO
4·2H
2O, 370.0; KCl, 130.0;
Ferric citrate, 40.0; ZnSO
4·7H
2O, 20.0; Ca-lactate, 356.5;
CuCl, 0.2; AlCl
3·6H
2O, 0.15; KI, 0.15; Na
2Se
2O
3, 0.01;
MnSO
4·H
2O, 2.0; CoCl
2·6H
2O, 1.0.
4
100-(crude protein+crude lipid+ash).
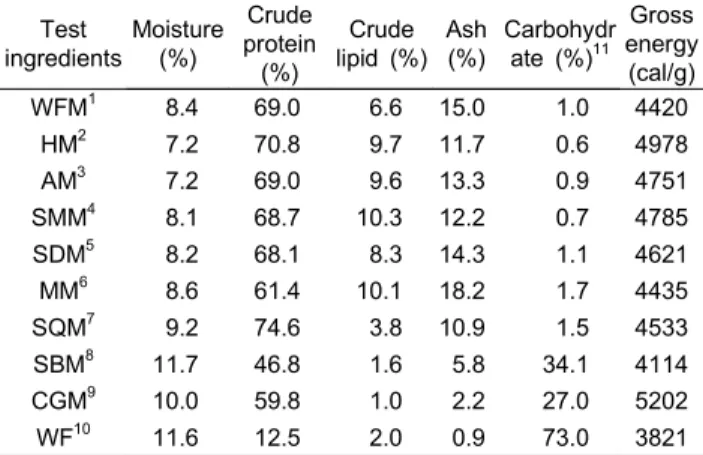
Table 2. Nutrient contents of the ingredients used to test diets
Test ingredients
Moisture (%)
Crude protein (%)
Crude lipid (%)
Ash (%)
Carbohydr ate (%)
11Gross energy
(cal/g)
WFM
18.4 69.0 6.6 15.0 1.0 4420
HM
27.2 70.8 9.7 11.7 0.6 4978
AM
37.2 69.0 9.6 13.3 0.9 4751
SMM
48.1 68.7 10.3 12.2 0.7 4785
SDM
58.2 68.1 8.3 14.3 1.1 4621
MM
68.6 61.4 10.1 18.2 1.7 4435
SQM
79.2 74.6 3.8 10.9 1.5 4533
SBM
811.7 46.8 1.6 5.8 34.1 4114
CGM
910.0 59.8 1.0 2.2 27.0 5202
WF
1011.6 12.5 2.0 0.9 73.0 3821
1
White fishmeal from Alaska supplied by Galim Engineering, Co., Ltd., Seoul, Korea.
2
Herring meal from Denmark supplied by Galim Engineering.
3
Anchovy meal from Chile supplied by Galim Engineering.
4
Salmon meal from Chile supplied by Galim Engineering.
5
Sardine meal from Chile supplied by Suhyupfeed Co., Ltd., Uiryeong, Korea.
6
Mackerel meal from Chile supplied by Suhyupfeed.
7
Squid meal from Chile supplied by Galim Engineering.
8
Soybean meal (dehulled, solvent extracted) supplied by Suhyupfeed.
9
Corn gluten meal supplied by Suhyupfeed.
10
Wheat flour supplied by Suhyupfeed.
11
100-(moisture+crude protein+crude lipid+ash).
Table 3. Nutrient contents (dry basis) of the test diets fed to flounder
Test diets (70%
reference + 30%
Ingredient)
Crude protein (%)
Crude lipid (%)
Ash (%)
Gross energy (cal/g)
WFM
158.9 10.8 14.1 4919
HM
159.4 12.1 12.8 5047
AM
158.6 11.5 13.2 4967
SMM
159.1 11.4 12.9 4998
SDM
159.6 11.0 13.6 4919
MM
156.1 11.3 14.8 4818
SQM
161.5 9.0 12.7 4995
SBM
153.2 8.6 11.5 4907
CGM
157.2 8.7 9.6 5114
WF
143.7 8.6 9.5 4900
1
See Table 2.
수조 (Fig. 1) 에 평균체중 220 g 의 넙치 육성어를 마리씩 20
각 사료별 반복으로 수용하여 주간 예비 사육한 후 실험사 3 4 ,
료를 오후 시에 만복에 가깝도록 공급하고 오후 시에 수조 2 , 5
및 분 수집 통을 깨끗이 청소한 후 다음날 오전 시에 수집통 10
에 모인 분을 여과하고 샘플 수집하였다 분 수집 기간 동안의 .
평균 수온은 21.0±2.8℃였다 수집된 분은 동결 건조하여 . -20 ℃
에 보관하며 성분분석에 사용하였다.
Fig. 1. Digestibility tank system used in this study.
성분분석 사료원료 실험사료 및 분의 수분은 , 105 ℃ 에서 시간 건조 6 하여 측정하였으며 조단백질 , (N×6.25) 은 Auto Kjeldahl 을 사용하여 분 System (Gerhardt VAP50OT/TT125, Germany)
석하였다 조지방은 조지방추출기 . (Velp SER148, Italy) 를 사 용하여 ether 로 추출한 후 측정하였으며 조회분은 회화로를 , 사용하여 550 ℃ 에서 시간 동안 태운 후 정량하였다 에너지 4 . 함량은 열량분석기 (Parr-6200, Moline, IL, USA) 를 사용하여 분석하였다 실험사료와 분의 산화크롬 함량은 시료의 크롬 . 함량을 원자흡광분광광도계 (Analyticjena, Germany) 를 사용 하여 분석한 후 분자량 값으로 환산하여 측정하였다 , . 소화율측정
실험사료 및 사료원료의 소화율은 Cho et al. (1982) 이 사용 한 아래의 공식으로 계산하였다.
실험사료의 소화율
건물 소화율 = 100 - ( 사료중의 Cr
2O
3× 100 / 분중의 Cr
2O
3) 영양소 소화율 = 100 - [( 분중의 영양소 사료중의 × Cr
2O
33)/
사료중의 영양소 분중의
( × Cr
2O
3)] × 100 사료원료의 소화율
실험사료의 영양소 소화율 표준사료의
= 100/30 × ( - 0.7 × 영양소 소화율)
통계처리
결과의 통계 처리는 SPSS program 을 사용하여 ANOVA-test 를 실시한 후 , Duncan’s multiple range test (Duncan, 1955) 로 평균간의 유의성 (P <0.05) 을 검정하였다 .
결 과
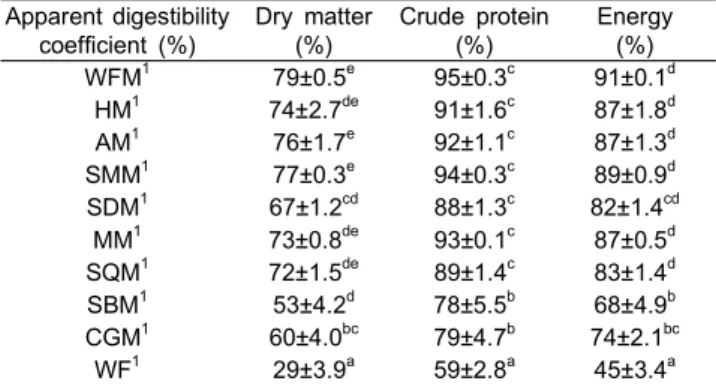
넙치 육성어의 사료원료 종류에 대한 외관상 건물 조단 10 , 백질 및 에너지 소화율측정 결과를 Table 4 에 나타내었다 .
사료원료별 건물 소화율은 29-79% 였고 동물성 원료인 어분 , 및 오징어분의 건물 소화율 (67-79%) 이 식물성 원료인 대두박 콘글루텐밀 및 소맥분 에 비하여 유의하게 (53%), (60%) (29%)
높았다 (P <0.05). 동물성 원료별 건물 소화율은 정어리분이 백색어분 멸치분 및 연어분에 비하여 유의하게 낮은 결과를 , 보였으며 (P <0.05), 식물성 원료별 건물 소화율은 소맥분이 대두박 및 콘글루텐밀에 비하여 유의하게 낮았다 (P<0.05).
사료원료별 조단백질 소화율은 59-95% 였고 어분 및 오징어 , 분의 조단백질 소화율 (88-95%) 이 대두박 (78%), 콘글루텐밀
및 소맥분 에 비하여 유의하게 높았다
(79%) (59%) (P<0.05).
모든 원료의 에너지 소화율은 45-91% 였고 동물성 원료의 , 에너지 소화율 (82-91%) 이 식물성 원료인 대두박 (68%), 콘글 루텐밀 (74%) 및 소맥분 (45%) 에 비하여 유의하게 높았다 동물성 원료별 조단백질 및 에너지 소화율은 사료원 (P<0.05).
료에 따른 차이는 없었으며 식물성 원료별 조단백질 및 에너 , 지 소화율은 소맥분이 대두박 및 콘글루텐밀에 비하여 유의하 게 낮았다 (P<0.05).
Table 4. Apparent digestibility coefficient of dry matter, crude protein and energy of the test ingredients in flounder
Apparent digestibility coefficient (%)
Dry matter (%)
Crude protein (%)
Energy (%) WFM
179±0.5
e95±0.3
c91±0.1
dHM
174±2.7
de91±1.6
c87±1.8
dAM
176±1.7
e92±1.1
c87±1.3
dSMM
177±0.3
e94±0.3
c89±0.9
dSDM
167±1.2
cd88±1.3
c82±1.4
cdMM
173±0.8
de93±0.1
c87±0.5
dSQM
172±1.5
de89±1.4
c83±1.4
dSBM
153±4.2
d78±5.5
b68±4.9
bCGM
160±4.0
bc79±4.7
b74±2.1
bcWF
129±3.9
a59±2.8
a45±3.4
aValues (mean ± SE of three replications) in each column with different superscripts are significantly different (P<0.05).
1
See Table 2.
각 사료원료의 단백질 함량과 건물 (r=-0.93, P <0.01), 조단 백질 (r=-0.88, P <0.01) 및 에너지 (r=-0.93, P <0.01) 소화율은 높은 상관관계를 나타내었으며 원료별 탄수화물 함량과 건물 , (r=-0.95, P <0.01), 조단백질 (r=-0.93, P <0.01) 및 에너지 (r=-0.96, P <0.01) 소화율은 역 (inverse) 의 상관관계를 보였다 .
고 찰
사료 단백질원의 품질은 어류 성장에 영향을 미치는 주된
요인이며 단백질 소화율은 어류의 단백질 이용성을 평가하기 ,
위한 주요한 방법이다 사료산업에 있어서 사료원료별 영양소 .
소화율 측정 자료는 양식어종의 영양소 요구량을 충족시킬
수 있는 최저가 사료배합비를 설계하는데 필수적이다 사료원 .
료의 소화율은 주로 원료의 화학적 영양조성 및 대상어종의
소화 능력에 따라 달라진다 육성기 넙치를 대상으로 수행된 .
본 연구에서 어분 종류별 단백질 소화율은 88-95% 였으며 ,
에너지 소화율는 82-91% 로 높은 값을 나타내었다 본 실험에 .
서 넙치의 청어분 (herring meal) 에 대한 단백질 소화율은 91%
로 무지개송어 (Oncorhynchus mykiss), Atlantic salmon (Salmo salar), coho salmon (Oncorhynchus kisutch), European sea bass (Dicentrarchus labrax), red drum (Sciuenopps owllatus), Atlantic cod (Gadus morhua ) 및 haddock (Melanogrammus aeglefinus) (Cho and Kaushik, 1990; Anderson et al., 1992; Hajen et al., 1993; McGoogan and Reigh, 1996; Gomes and Oliva-Teles, 의 청어분 단백질 소화율 1998; Tibbetts et al., 2004, 2006)
범위에 속하였으며 에너지 소화율 도 무지개송
87-98% , (87%)
어 , Atlantic salmon, haddock 및 European sea bass (Cho and Kaushik, 1990; Anderson et al., 1992; Gomes and Oliva-Teles,
의 범위에 속하였다 식물성
1998; Tibbetts et al., 2004) 84-98% . 원료인 콘글루텐밀에 대한 넙치의 단백질 소화율은 79% 로 Atlantic cod, rockfish (Sebastes schlegeli) (Lee, 2002), coho
및 의 에 비하여 낮았으며 대두박 단백
salmon haddock 86-92% ,
질 소화율은 78% 로 red drum (80%) 및 rockfish (80-84%) 와는 유사하였으나 , Atlantic cod, 무지개송어 , coho salmon 및 의 에 비해 낮았다 또한 넙치의 콘글루텐밀 haddock 90-93% .
에너지 소화율은 74% 로 무지개송어의 72-87% 에 속하며 , 및 Atlantic cod, gilthead seabream (Lupatsch et al., 1997)
보다는 다소 낮았고 대두박의 에너지 소화 haddock (80-83%) ,
율은 68% 로 European sea bass (69-70%) 와 유사하였으며 gilthead seabream (Sparus aurata ) 및 red drum (38%-58%) 보다 는 높았지만 , Atlantic cod, Atlantic salmon 및 haddock (72-92%) 보다는 낮았다.
은 평균체중 넙치의 콘글루텐밀 대두 Lee et al. (2008) 300 g , 박 및 소맥분 에너지 소화율은 각각 86, 98 및 52% 로 보고하여 , 본 연구의 콘글루텐밀 대두박 및 소맥분 에너지 소화율 , 74, 및 에 비하여 전반적으로 높은 결과를 보였다 어류의
68 45% .
소화율은 사료조성 사육수온과 같은 환경조건 사료공급 방 , , 법 및 사료제조 조건 등에 영향을 받을 수 있다 (Sullivan and 따라서 어류의 사료원료 소화율이 항상 일정한 Reigh, 1995).
수준으로 유지되는 것은 아니다 (McGoogan and Reigh, 1996).
본 연구와 Lee et al. (2008) 의 연구에서 측정된 사료원료별 에너지 소화율 값의 차이에 대한 원인을 명확히 설명할 수는 없지만 이러한 차이는 각 실험에 사용된 어체의 크기 기초사 , , 료 조성 및 사료수온 등에 의한 것으로 판단된다 이러한 생물 . 학적 및 환경적인 요인과 더불어 소화율 측정을 위한 분 수집 , 방법 역시 소화율 측정값에 영향을 미친다 어류의 소화율 . 측정을 위한 분 수집 방법에는 내장을 절개하는 방법
항문 부위를 눌러서 분을 짜내는 방법
(dissection), (stripping) 과 배설된 분을 분 수집 통으로 수집하는 방법 (decantation) 이 있으며 이 중 분 수집통을 이용하는 방법이 가장 많이 사용되 , 고 있다 . Lee (1997) 는 조피볼락의 소화율 측정을 위한 분 수집 방법으로 내장을 dissection 하는 것 보다는 항문 부위를 하거나 분 수집통을 이용하는 것이 바람직하며 어체
stripping ,
의 크기가 작아서 분을 충분히 수집할 수 없거나 어류의 , 으로 인한 스트레스 요인이 측정되는 소화율 값에 handling
큰 영향을 미치는 상황에서는 분 수집통을 이용하는 것이
바람직하다고 보고하였다 따라서 분 수집 방법도 신중하게 . 고려하여 소화율 측정값의 정확도가 최대화되도록 하여야 할 것이다.
어류의 성장을 향상시키는 어분의 우수성은 여러 어종에서 이미 잘 알려져 있는데 이는 어분의 높은 단백질 함량 균형잡 , , 힌 아미노산 조성 및 기호성 향상 등에 의한 것이다 (Andrews and Page, 1974; Tacon and Jackson, 1985; Nandeesha et al., 그러나 어분은 가격이 높은 편이며 생산량이 제한적이 1991).
라는 단점이 있어 양식어의 정상적인 성장을 유지하며 사료 , 중에 어분의 함량을 최소화 시킬 수 있는 대체 단백질원 조사 를 위한 연구는 필수적이다 본 연구에서 식물성 원료인 대두 . 박 및 콘글루텐밀은 여러 종류의 어분에 비하여 건물 단백질 , 및 에너지 소화율이 낮았다 . Kim et al. (2000) 은 사료의 단백질 원으로 어분 대신 대두박 함량을 달리한 사료로 넙치를 사육 한 결과 대두박 함량이 증가함에 따라서 성장 및 사료효율이 , 감소하였다고 보고하였다 일반적으로 육식성 어류는 식물성 . 원료에 비하여 동물성 원료의 건물 및 에너지 이용율이 더 높은 것으로 알려져 있다 (Cho et al., 1982; Bergot and Breque, 1983; Ellis and Reigh, 1991; Reigh and Ellis, 1992; Sullivan 이와 같이 식물성원료에 대한 소화율이 낮은 and Reigh, 1995).
것은 식물성 원료에 함유된 탄수화물의 함량 및 화학적 조성과 관계가 있으며 대부분의 육식성 어류는 에너지원으로 사료 , 중의 탄수화물을 효율적으로 사용하지 못하는 것으로 보고되 었다 (Wood, 1993). 어류는 식물성원료에 존재하는 탄수화물 인 섬유소를 에너지원으로 이용하지 못하며 사료 중에 섬유소 , 의 함량이 높을 경우 타 영양소들의 이용율을 감소시키며 단백질 분해 효소 활성을 감소시키거나 (Anderson et al., 1984),
사료의 장통과 시간을 단축시킴으로써 소화 및 흡수가 제대로 이루어지지 못하여 단백질 이용율을 감소시키기도 한다 (Falge 본 연구에서도 각 et al., 1978; Jobling, 1981; Steffens, 1989).
사료원료의 탄수화물 함량과 건물 조단백질 및 에너지 소화율 , 은 높은 역 (inverse) 의 상관관계를 나타내었는데 조피볼락 , (Lee, 2002), salmonids (Sugiura et al., 1998), hybrid striped bass
및
(Sullivan and Reigh, 1995) red drum (McGoogan and Reigh, 과 같은 타 어종에서도 본 연구와 유사한 경향을 보였다
1996) .
이상의 결과로 볼 때 사료원료별 넙치 육성어의 건물 조단 , , 백질 및 에너지 소화율은 동물성 원료인 어분 및 오징어분이 식물성 원료인 대두박 콘글루텐밀 및 소맥분에 비하여 높았 , 으며 식물성 원료별 소화율은 소맥분이 대두박 및 콘글루텐 , 밀에 비하여 낮았다 이러한 결과는 경제적이고 영양적으로 . 균형있는 넙치용 배합사료를 설계하는데 기초 자료가 될 것으 로 판단된다.
사 사
본 연구는 국립수산과학원 고효율 배합사료 개발 및 실용 ( 화 연구 , RP-2010-AQ-039) 의 지원에 의해 운영되었습니다 .
참고문헌