DOI: http://doi.org/10.15205/kschs.2018.12.31.1126
A Study on Job Satisfaction by Medical Information System Accomplishment
Chung-Gun Kim
1, Chang-yong Sohn
2, Yun-kyung Chung
3*1
Doctoral student, School of Business, Kyungpook National University
2
Doctoral student, School of Business, Kyungpook National University
3*
Dept. of Nursing, University of GyeongNam Geochang
(Received September 17, 2018; Revised October 3, 2018; Accepted October 30, 2018)
4)
Abstract
Purpose. The purpose of this study is to investigate the success model related to the hospital in- formation system accomplishment. It is important to examine the success model of the hospital in- formation system and to analyze the factors affecting the job satisfaction accomplishment.
Methods. The method of this study is to 150 copies of the entire survey data were distributed and 135 copies were collected, showing a collection rate of 90%. In order to ensure the reliability of the questionnaire items, Cronbach's Alpha was used to test reliability, and exploratory factor analy- sis was conducted to determine the convergence of various items. In order to grasp the convergence of various items, exploratory factor analysis was performed. The results of exploratory factor analy- sis were used to analyze the correlations between variables that were proven to have a single di- mensionality before calculating factor loadings and regression analysis by Orthogonal Rotation by Varimax method
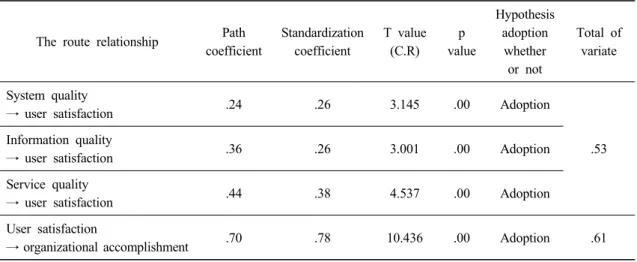
Results. The results of this study, first, the system quality of the hospital information system has a statistically significant effect on user satisfaction. Second, the information quality of hospital in- formation system is statistically significant for user satisfaction, indicating that information quality improves user satisfaction. Third, service quality of hospital information system was statistically sig- nificant in user satisfaction. Finally, the higher the satisfaction of the users who use the hospital in- formation system, the higher the accomplishment of the organization
Conclusions. This study is based on the successful model of D & M information system. In addi- tion, the hospital information system, the user satisfaction, and the organizational accomplishment in connection with it can be found significant.
Key Words : Accomplishment, D & M information system, Hospital information system, Job sat- isfaction, User satisfaction
*Corresponding author : [email protected]
Ⅰ. Introduction
1.1. The need for research
The diffusion of information has be come a basis for transforming the paradigm of the world economy into a know ledge-based economy. In the spread of such information, the Information system supports the improvement of the organi- zational structure, the sharing of information among the members of the organization is one of the means to improve productivity through the use of organizations and companies.
This phenomenon is changing in the healthcare field, especially in the hospital industry, which is markedly different from the past. In order to meet the needs of medical consumers and to im- prove the management environment, multidimen- sional hospital information systems that share various medical information and management in- formation in the organization and support the de- cision of the CEO are needed.
Korea's hospital information system began to be introduced as a fractional system for the cal- culation and billing of medical expenses in the 1980s, along with the implementation of the na- tional health insurance system. Since 2000, hos- pitals have been demanding rapid information, advanced patient care services, and prompt judg- ment by management in order to survive in an infinite competition era. The value of the knowl- edge on management has an increasingly higher demand in information systems
1).
Most of the hospitals in Korea are operated with almost 100% of cases such as MIS, PACS, OCS, EMR, etc. However, the reality is that sat- isfaction with the information system of rural hospitals is very low. In order to ensure that there is no case that the hospital information sys- tem introduced by inputting a lot of capital will not be fully utilized, the results should be diag-
nosed in the same way as other businesses and systems, and the successful factors should be highlighted
2). In recent years, research has been conducted on user satisfaction as a research re- lated to the accomplishment of hospital in- formation system
3).
In general information system and hospital in- formation system represented by ERP, basic sys- tems such as personnel (including payroll) man- agement, accounting management, purchasing management, and management are basically in- cluded as common items. However, Is focused on medical services, and general information sys- tem is a system made around production work.
Therefore, it can be seen that necessary parts are used and managed based on medical service and production work in the central aspect of in- formation system
4).
Especially, from the viewpoint of information security, which is a recent issue, the hospital in- formation system agrees with the use of the per- sonal information provided by the individual in order to provide the medical information such as the patient's medical information, and must be used in common. It is important to note that in the case of general information systems, in- formation related to production and sales gen- erated by producers and sellers for production and sales is important. Despite these differences, research has been actively conducted in relation to the accomplishment of general information systems, but there have been few studies on the accomplishment of hospital information systems related to rural areas
2).
Therefore, the purpose of this study is to in-
vestigate the effects of the success model related
to the hospital information system accomplish-
ment and the factors affecting the accomplish-
ment of the research represented by the ERP
5).
Ⅱ. Research method
2.1. Research model and hypothesis setting
In this study, the classification of organiza- tional accomplishment factors of hospital in- formation system was reclassified as factors af- fecting information system accomplishment by 6 dimensions suggested by the Korean D & M in- formation system success model using the Korean literature (Kim & Mi Kim, 2002) and its application as an improved D & M model
6). As a result, the organizational accomplishment factors of the hospital information system are divided into 5 categories, and classified into 3 occupational types (medical person, medical care support worker, and administrative worker). The causal relationship between variables is explained by using structural equation
7).
System quality
Information quality
Service quality
User satisfaction
Organizational accomplishment
Figure 1. The research model
2.2. Setting the hypothesis
This research is based on theoretical frame- work of hospital information system on organiza- tional accomplishment. The quality of the system, quality of information, and quality of service were set as the independent variables, while user satisfaction was the parameter, and organizational
accomplishment was the final dependent variable.
These hypotheses are as follows based on the study framework
8).
H1: System quality of hospital information sys- tem will affect user satisfaction
9).
H2: Information quality of hospital information system will affect user satisfaction.
H3: Service quality of hospital information system will affect user satisfaction.
H4: User satisfaction of hospital information system will affect user satisfaction with organiza- tional accomplishment
10).
Separator Frequency The percentage (%)
Sex Women's 68 50.4
Men's 67 49.6
Ages
20 for 41 30.4
30 for 39 28.9
40 for 31 23.0
50 for 24 17.8
Number of years employed
1 years less than 13 9.6
Over 1 year ~
less than 5 years 34 25.2 Over 5years ~
less than 10 years
23 17.0
Over 10 years - less than 15 years
11 8.1
Over 15 years 54 40.0
Education
High school
graduate or less 3 2.2
College graduate 11 8.1
undergraduate 85 63.0
Graduate school
graduate 36 26.7
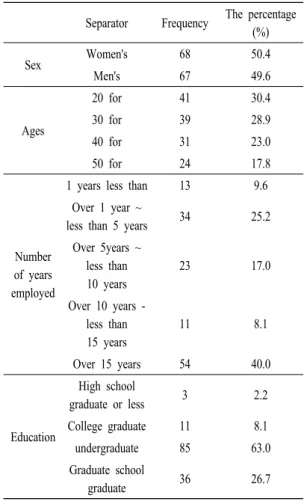
Table 1. The data collection
2.3. Data Design
1) Data collection and characteristics of respondents
The subjects of this study were senior general
hospitals in Daegu and Changwon. The reason for this is that hospitals are limited to the target population because they are hospital groups that have introduced the hospital information system relatively long ago compared to the other hospitals. One target hospital in Daegu and one in Changwon area were selected. Survey re- spondents surveyed employees who understood the hospital information system of the hospital where the respondent was working. 150 copies of the entire survey data were distributed, and 135 copies were returned, showing a collection rate of 90%.
The characteristics of the respondents in the questionnaire were as follows. Of the total 135 respondents, 67 (49.6%) were males and 68 (50.4%) were females. In the age group, 41 (30.4%) are in their 20s, 39 (28.9%) are in their 30s, 31 (23.0%) are in their 40s and 24 (17.8%) are in their 50s. 13 (9.6%) for less than 1 year, 34 (25.2%) for less than 5 years, 23 (17.0%) for less than 10 years, 11 (8.1%) and 54 (40.0%) for 15 years or more. In the case of education, 3 (2.2%) of high school graduates, 11 (8.1%) of college graduates, 85 (63.0%) of university grad- uates and 30 (26.7% Showed a high response rate.
Ⅲ. Empirical analysis
3.1. Analysis of measurement tools
1) Reliability analysis
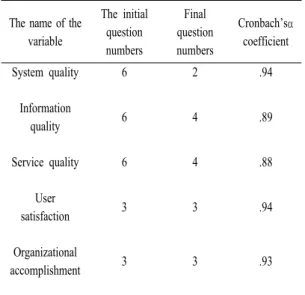
The reliability of this study was tested using Cronbach's Alpha to obtain the re- liability of the questionnaire items. As shown in <Table 2>, the reliability analysis showed that the Cronbach's Alpha coefficient of all variables such as system quality, information quality and service quality, user satisfaction and organizational accomplish- ment was high from a mini- mum of .885 to a
maximum of .949. Therefore, the measurement items of this research variable were found to have high internal consistency.
In general, the reliability coefficient is different for each scholar, but it is generally considered to be acceptable if it is 0.6 or more. The system quality, information quality, and service quality items were initially designed with six items, but four items of system quality, two items of in- formation quality, and service quality which re- duce consistency in reliability analysis were excluded. The remaining two items and four items were measured.
The name of the variable
The initial question numbers
Final question numbers
Cronbach’sα coefficient
System quality 6 2 .94
Information
quality 6 4 .89
Service quality 6 4 .88
User
satisfaction 3 3 .94
Organizational
accomplishment 3 3 .93
Table 2. Reliability analysis
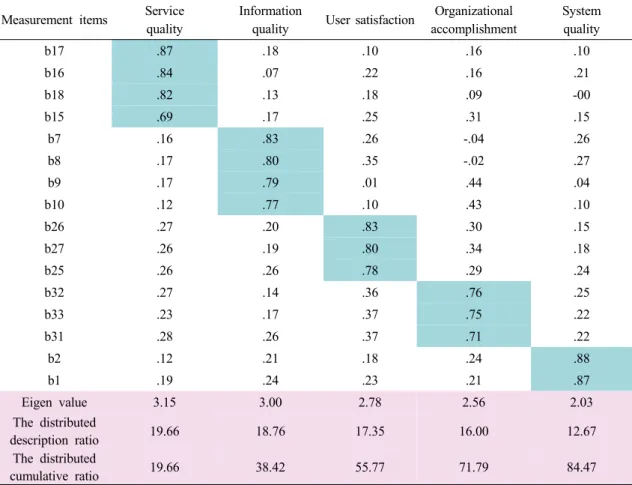
2) Feasibility Analysis (1) exploratory factor analysis
This study conducted an exploratory factor analysis to understand convergence of various items. The exploratory factor analysis is used to determine whether the concept to be measured is measured accurately. In other words, it is to con- firm whether the items measuring the same con- cept are tied to the same factors. Logic simplifies the question by tying a large number of corre- lated items together.
Table 3 shows the results of the factor analysis
to test the validity of the measurement items used in this study. In addition, factor loadings were calculated by orthogonal rotation by the Varimax method.
As shown in Table 3, the results of the factor analysis were classified into 5 single factors, and the total cumulative dispersion ratio was 84.465%, which is generally high. The factor loadings of the items were found to be high, from .688 to .883.
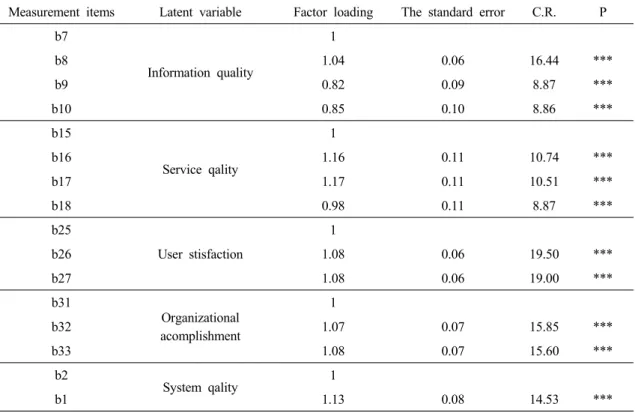
(2) Confirmatory factor analysis
Confirmatory factor analysis analyzes the val- idity of the data in the causal relationship analy- sis and confirms whether specific items constitute potential factors based on the exploratory factor analysis results. In other words, it is to determine whether the measurement items of each concept
are acceptable by the single factor model. This is based on the theory of precedence, so the factors identified in the exploratory factor are used to identify the factors once again.
The statistical value of factorial wit was used as an index to measure convergent validity. If there is a strong relationship with a given con- struct, then the factorial wit value should be above 0.7, but in this study, the factorial wit val- ue of all questions was found to be at least .824.
In other words, in this study, it was confirmed that factorial wit values of confirmatory factor analysis were related to each constitutional con- cept, and each factorial wit value was statistically significant at significance level p <.001.
There is no problem in the validity of this study.
Measurement items Service quality
Information
quality User satisfaction Organizational accomplishment
System quality
b17 .87 .18 .10 .16 .10
b16 .84 .07 .22 .16 .21
b18 .82 .13 .18 .09 -00
b15 .69 .17 .25 .31 .15
b7 .16 .83 .26 -.04 .26
b8 .17 .80 .35 -.02 .27
b9 .17 .79 .01 .44 .04
b10 .12 .77 .10 .43 .10
b26 .27 .20 .83 .30 .15
b27 .26 .19 .80 .34 .18
b25 .26 .26 .78 .29 .24
b32 .27 .14 .36 .76 .25
b33 .23 .17 .37 .75 .22
b31 .28 .26 .37 .71 .22
b2 .12 .21 .18 .24 .88
b1 .19 .24 .23 .21 .87
Eigen value 3.15 3.00 2.78 2.56 2.03
The distributed
description ratio 19.66 18.76 17.35 16.00 12.67
The distributed
cumulative ratio 19.66 38.42 55.77 71.79 84.47
Table 3. Factor analysis
Measurement items Latent variable Factor loading The standard error C.R. P b7
Information quality
1
b8 1.04 0.06 16.44 ***
b9 0.82 0.09 8.87 ***
b10 0.85 0.10 8.86 ***
b15
Service qality
1
b16 1.16 0.11 10.74 ***
b17 1.17 0.11 10.51 ***
b18 0.98 0.11 8.87 ***
b25
User stisfaction
1
b26 1.08 0.06 19.50 ***
b27 1.08 0.06 19.00 ***
b31
Organizational acomplishment
1
b32 1.07 0.07 15.85 ***
b33 1.08 0.07 15.60 ***
b2 System qality 1
b1 1.13 0.08 14.53 ***
(p<.001:***, p<.01:**, p<.05:*)
Table 4. Confirmatory factor analysis
The validity test of confirmatory factor analy- sis is shown in Table 5. <Table 5> shows that all six met the optimum criterion. Therefore, this
study confirms the validity of the measurement model.
Fit index x2(df) p-Value GFI AGFI RMR NFI IFI CFI
Standard 05 1 1 .05 1 1 1
Fit coefficient 124.677
(91) .01 .90 .85 .04 .94 .98 .98
Source: Based on the results of this study
Table 5. Confirmatory factor analysis fit test
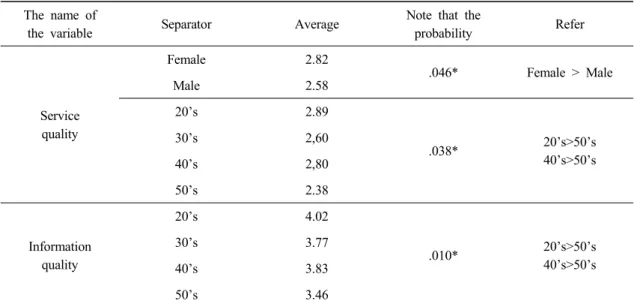
3.2. Average difference test
In this study, we set up a research model that the organizational Accomplishment, the user sat- isfaction, and the system characteristics will be different according to the personal characteristics of the hospital. In order to test this, t-test and F-test were conducted. Based on the statistically
significant results at significance level p <.05, Table 6 was constructed.
In terms of gender, women's perception of service quality was relatively higher than men's.
The difference in service quality between the
ages of 20s and 40s is higher than that of the
50s. It was also found that people in their 20s
and 40s perceived higher service quality than the
50s in terms of the difference in information quality by age group.
The name of
the variable Separator Average Note that the
probability Refer
Service quality
Female 2.82
.046* Female > Male
Male 2.58
20’s 2.89
.038* 20’s>50’s
40’s>50’s
30’s 2,60
40’s 2,80
50’s 2.38
Information quality
20’s 4.02
.010* 20’s>50’s
40’s>50’s
30’s 3.77
40’s 3.83
50’s 3.46
(p<.001:***, p<.01:**, p<.05:*)