DOI:http://dx.doi.org/10.15205/kschs.2015.3.1.276
An Analysis of the Management of a Tertiary General Hospital (2011 to 2013)
Hyun-Suk Park
3)Department of Health Service Management, Daejeon University
(Received January 12, 2015 :Revised January19, 2015 :Accepted January 26, 2015) Abstract
Purpose. To efficiently manage hospitals, this study aims to analyze the general characteristics, common-type balance sheet, common-type profit and loss statement and financial ratio of a tertiary general hospital and use the results as basic data for future hospital development by comprehending causes for problems and analyzing hospital management.
Methods. By using information about a tertiary general hospital, located in A Metropolitan City, provided through Alio (www.alio.go.kr), a public organization information provider, Health Insurance Review & Assessment Service, and Ministry of Health and Welfare, this study used data during 3 years(2011 to 2013) by analyzing the general characteristics, common-type balance sheet, common-type profit and loss statement, industrial mean ratio and financial ratio of hospitals.
Results. This study came to the following conclusions through the general characteristics, common-type balance sheet, common-type profit and loss statement, industrial mean ratio, financial ratio, circular chart and ROI by analyzing the data from 2011 to 2013.
Conclusions. Overall, A Tertiary General Hospital showed an increase in fixed cost due to the construction of J Hospital and even in the size of capital and assets. It also showed an increase in medical profit, but the increase of its medical cost was higher, resulting in a financial loss.
Especially, this hospital showed a slight decrease in net profit, featuring a reduction in inventory turnover. When the management of A Tertiary General Hospital was predicted based on such features, this hospital is expected to improve its profit structure through the opening of J Hospital, and it is necessary for this hospital to increase and sustain the turnover rate of inventories accumulated by managing them better.
Key Words: Common-type balance sheet, Common-type profit and loss statement, Financial ratio analysis, Hospital management analysis
*Corresponding Author : [email protected]
1. Introduction
Hospitals are non-profit and public organizations in general. However, they have different management environment medical policies, health insurance institutions, medical consumers, and competition superior levels.
Eternal environments are difficult for a hospital management to control, but since internal environments can be controlled to some degree, hospital should try to change their internal environments for the better through rationalized management for their survivals
1,2). Therefore, they are more required to improve the efficiency of management. As their external environments including the control of medical fees get worse, more hospitals fail to efficiently use and analyze information needed to comprehend their actual states of manage- ment and seek direction of management improvement. As a result, they are less likely to experience management improvement as much as expected, and the reasons can be summarized as follows; Firstly, the management system is not rationally operated for hospitals to properly cope with changing external environments. Secondly, information needed for important decisions and reasonable management is not systematically utilized.
Thirdly, since most of the hospital management members are doctors, they are limited to using expertise in management. Fourthly, even administration managers do not have many chances to get systematically trained about hospital management. Thus, this study intends to investigate how hospital management members and administration managers should collect and classify hospital information systematically and how they should analyze and assess the information.
2. Methods
2.1. Research Subjects
As a general hospital representing A Area,
A Tertiary General Hospital was opened in
1910 and has 970 sick beds at present in
2014. However, its management system is not
operated rationally enough to cope with
changing external environments properly, and
information it needed to make important
decisions or perform rational administration,
has not been used systematically. Besides,
since most of the hospital management
members are doctors, they are limited to using
expertise in management, and even administr-
ation managers do not have many chances to
get systematically trained about hospital
management. Thus, this study intends to
investigate how hospital management members
and administration managers should collect and
classify hospital information systematically and
how they should analyze and assess the
information. Particularly, by analyzing financial
streams and problems based on hospital
information from 2011 to 2013, provided
through Alio(www.alio.go.kr)
3), a public
organization information provider, Health
Insurance Review & Assessment Service, and
Ministry of Health and Welfare, this study
intends to contribute the advancement of
hospitals. The financial status change was
obtained through a three-year common-type
balance sheet and common-type profit and loss
statement. A pie chart was used to analyze the
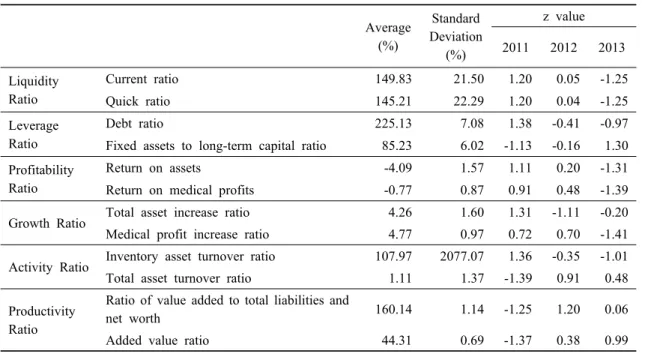
trend of change. The mean and standard
deviation of the three year data were obtained
and the Z value was calculated from this.
Characteristics Category No.
No. of sick-beds 970
Doctor
Concurrent Clinical Full-time Resident
151 62 46 283
sub total 542
Common
Health Administration Nursing
Drug Health Care Others
107 662 31 168 47
sub total 1015
Hospital Administration 264
(Common positions include inspection, nutrition, facility technique, engineering, computing, special service and research)
Table 1. Actual States of Medical Facilities and Staffs (Unit: bed and person) 2.2 The Purpose of this study
To manage hospitals more efficiently, hospital management members and administ- ration managers should know how to collect and classify hospital information systematically and analyze and assess the information. Thus, this study was to provide basic data for these processes.
The below shows the concrete purposes of this study.
1. To find out the general characteristics of a tertiary general hospital
2. To find out the common-type balance sheet of a tertiary general hospital
3. To find out the common-type profit and loss statement of a tertiary general hospital
4. To analyze the industrial mean ratio of a tertiary general hospital
5. To analyze the financial ratio of a tertiary general hospital
3. Results
As seen in Table 1, the number of doctors is 542 out of all the hospital workers in 39 medical departments of this hospital, and there are 662 nurses in the third nursing grade. This hospital has 627,626 outpatients and 322,662 inpatients treated on average for the past three years.
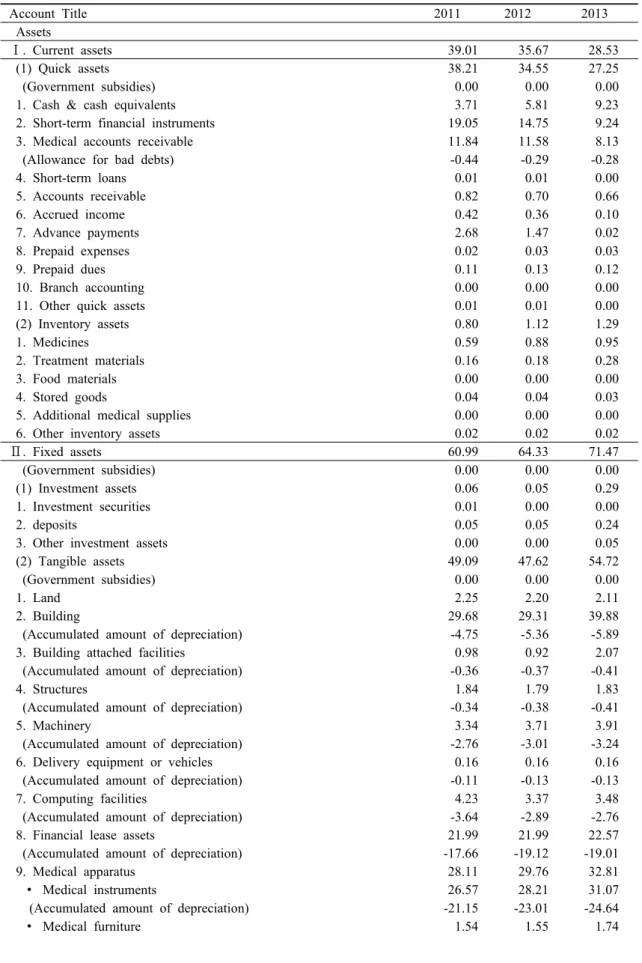
As seen in the common-type balance sheet of Table. 2, A Tertiary General Hospital showed a constant reduction in current assets and a constant increase in fixed assets. It seemed because of the opening of J Hospital that required lots of expenses for human and material resources. As an increase in fixed assets cause a high fixed rate, it is necessary to establish proper management strategies. In conclusion, due to the opening of J Hospital, A University Hospital showed an increase in fixed expenses, while having more capital and assets in size.
On the premise of medical profits as 100%
in the common-type profit and loss statement
Account Title 2011 2012 2013
Assets
Ⅰ. Current assets 39.01 35.67 28.53
(1) Quick assets 38.21 34.55 27.25
(Government subsidies) 0.00 0.00 0.00
1. Cash & cash equivalents 3.71 5.81 9.23
2. Short-term financial instruments 19.05 14.75 9.24
3. Medical accounts receivable 11.84 11.58 8.13
(Allowance for bad debts) -0.44 -0.29 -0.28
4. Short-term loans 0.01 0.01 0.00
5. Accounts receivable 0.82 0.70 0.66
6. Accrued income 0.42 0.36 0.10
7. Advance payments 2.68 1.47 0.02
8. Prepaid expenses 0.02 0.03 0.03
9. Prepaid dues 0.11 0.13 0.12
10. Branch accounting 0.00 0.00 0.00
11. Other quick assets 0.01 0.01 0.00
(2) Inventory assets 0.80 1.12 1.29
1. Medicines 0.59 0.88 0.95
2. Treatment materials 0.16 0.18 0.28
3. Food materials 0.00 0.00 0.00
4. Stored goods 0.04 0.04 0.03
5. Additional medical supplies 0.00 0.00 0.00
6. Other inventory assets 0.02 0.02 0.02
Ⅱ. Fixed assets 60.99 64.33 71.47
(Government subsidies) 0.00 0.00 0.00
(1) Investment assets 0.06 0.05 0.29
1. Investment securities 0.01 0.00 0.00
2. deposits 0.05 0.05 0.24
3. Other investment assets 0.00 0.00 0.05
(2) Tangible assets 49.09 47.62 54.72
(Government subsidies) 0.00 0.00 0.00
1. Land 2.25 2.20 2.11
2. Building 29.68 29.31 39.88
(Accumulated amount of depreciation) -4.75 -5.36 -5.89
3. Building attached facilities 0.98 0.92 2.07
(Accumulated amount of depreciation) -0.36 -0.37 -0.41
4. Structures 1.84 1.79 1.83
(Accumulated amount of depreciation) -0.34 -0.38 -0.41
5. Machinery 3.34 3.71 3.91
(Accumulated amount of depreciation) -2.76 -3.01 -3.24
6. Delivery equipment or vehicles 0.16 0.16 0.16
(Accumulated amount of depreciation) -0.11 -0.13 -0.13
7. Computing facilities 4.23 3.37 3.48
(Accumulated amount of depreciation) -3.64 -2.89 -2.76
8. Financial lease assets 21.99 21.99 22.57
(Accumulated amount of depreciation) -17.66 -19.12 -19.01
9. Medical apparatus 28.11 29.76 32.81
∙ Medical instruments 26.57 28.21 31.07
(Accumulated amount of depreciation) -21.15 -23.01 -24.64
∙ Medical furniture 1.54 1.55 1.74
Table 2. Common-type Balance Sheet (Unit: %)
(Accumulated amount of depreciation) -1.35 -1.37 -1.39
10. Tools and equipment 3.14 3.59 3.80
(Accumulated amount of depreciation) -2.72 -2.79 -2.91
11. Assets under construction 5.56 5.95 0.38
12. Other tangible assets 3.63 4.98 4.76
(Accumulated amount of depreciation) -0.98 -1.65 -2.27
(3) Intangible assets 11.84 16.66 16.46
1. Patent rights 0.00 0.00 0.00
2. Utility model rights 0.00 0.00 0.00
3. Trademark rights 0.00 0.00 0.00
3. Development expenses 0.47 0.30 0.23
4. Other intangible assets 0.10 0.10 0.34
5. Usable & profitable donation assets 11.28 16.26 15.88
A total of assets 100.00 100.00 100.00
Liabilities
Ⅰ. Current liabilities 22.22 24.00 23.00
1. Purchase liabilities 14.70 15.00 14.00
2. Accounts payable 1.94 2.00 2.00
3. Advances received 0.10 0.00 0.00
4. Deposits received 0.36 0.00 0.00
5. Accrued expenses 2.27 4.00 4.00
6. Current long-term liabilities 2.76 3.00 2.00
7. Unearned revenues 0.00 0.00 0.00
8. Deposits received 0.02 0.00 0.00
9. Other current liabilities 0.06 0.00 0.00
Ⅱ. Fixed liabilities 47.92 45.00 45.00
1. Long-term loans 1.74 1.00 1.00
2. Financial lease accounts payable 4.73 3.00 4.00
3. Retirement payment allowance 24.83 26.00 30.00
(Retirement insurance deposits) 0.00 0.00 0.00
(Money converted from national pension to retirement allowance) -0.17 0.00 0.00
4. Reserve funds for essential business 16.01 5.00 0.00
5. Reserve funds for medical development 0.79 10.00 11.00
A total of liabilities 70.14 69.00 69.00
Capital
Ⅰ. Endowments 45.33 48.00 50.00
1. Corporate endowments 8.40 8.00 8.00
2. Other endowments 36.93 39.00 42.00
∙ Contributions 0.00 0.00 0.00
∙ Subsidies 0.00 0.00 0.00
Ⅱ. Surplus -15.47 -17.00 -18.00
1. Surplus at the beginning of a period -15.68 -16.00 -16.00
0.00 0.00 0.00
2. Current net income 0.03 0.00 -2.00
3. Reserves for the rationalization of enterprises 0.18 0.00 0.00
4. Capital adjustment 0.00 0.00 0.00
∙ Inter-office capital transaction 0.00 0.00 0.00
A total of capital funds 29.86 31.00 31.00
A total of liabilities and capital funds 100.00 100.00 100.00
Source: (www.alio.go.kr)3),(www.hira.or.kr)4),(www.mw.go.kr)5).
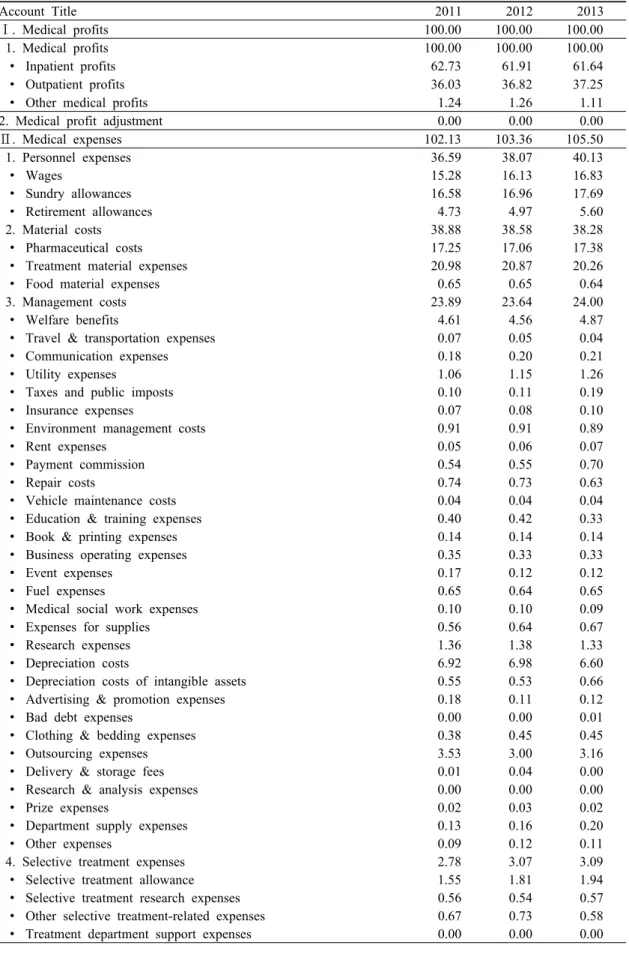
of Table 3, medical expenses increased much more than medical profits, and due to the
opening of J Hospital, there was an increase in
personnel, material and management expenses.
Since the increase of medical expenses was larger than that of medical profits, medical gains kept decreasing. On the contrary, non-medical profits increased a little. Since the increased non-medical profits did not have great effect on the entire profit structure, the current net profits constantly decreased.
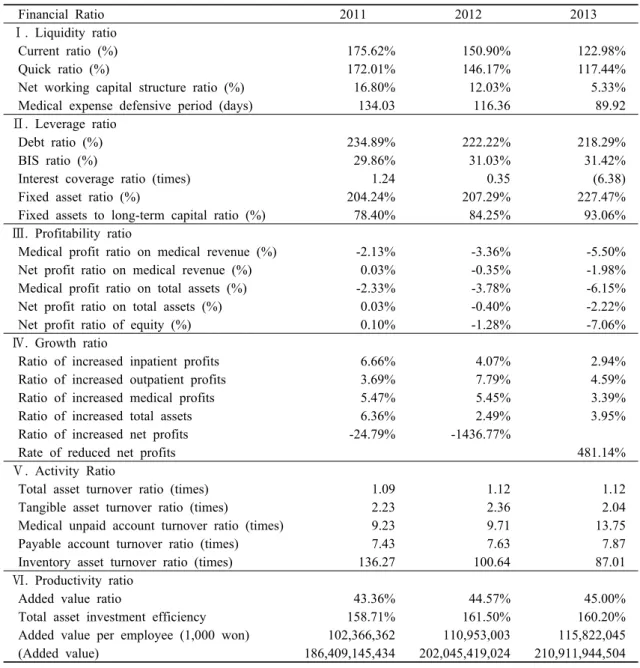
As a result of analyzing the liquidity ratio used to assess the stability of a financial structure, it was found that there was a reduction in the current ratio and quick ratio of this hospital as of 2013. As a result, the net operating capital composition ratio decreased as well as the medical defensive period. Com- pared to the past, the stability of this hospital’s financial structure became weaker as of 2013.
However, the fixed assets to long- term capital ratio, which shows an ability of operating equity, increased up to 93% as of 2013, which indicates limitations to operating fixed assets with fixed liabilities. That is, when there is an increase in fixed assets, the hospital may have to borrow more debts for management. All the earning ratios in the profitability ratio were minus, further increasing the range of losses.
Except the net profit increase rate, all the items of growth ratio were positive, showing a little growth, but the net profit increase rate was greatly reduced in 2012, and it even changed to a decrease in 2013. In other words, A University Hospital constantly showed an increase in medical profits, but the increased medical expenses were larger than the increased medical profits, leading to a constant reduction in net profits. When the net profits keeps decreasing, it may bring up a critical crisis to the hospital at last.
As a result of analyzing the financial ratios of this hospital as seen in Table 5, it was found that the current, quick and debt ratios were decreasing, but the fixed assets to
long-term capital ratio out of the leverage ratio was constantly increasing, which shows that it is necessary to properly manage the equity and fixed liabilities. In the growth ratio, the net profit ratio on total assets and the net profit ratio on medical profits both decreased. The increased in the inventory asset turnover ratio attributed to purchasing instruments and materials due to the opening of J Hospital affiliated with A University.
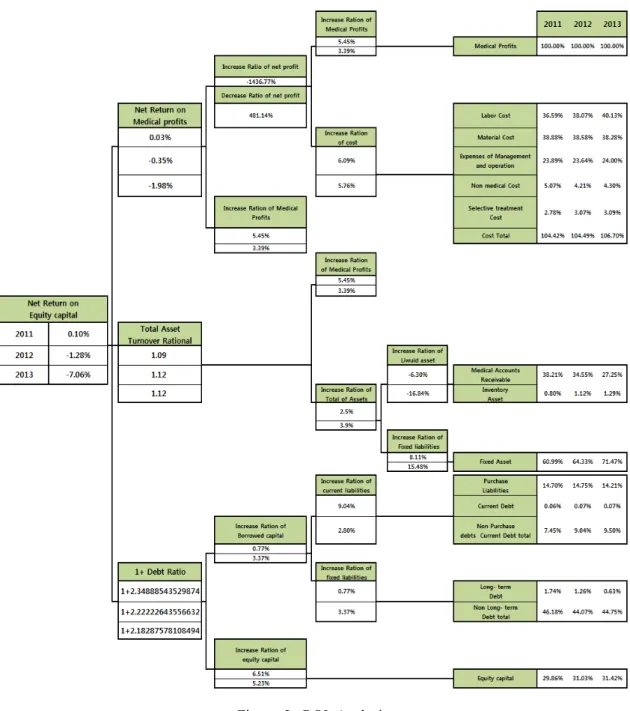
In the ROI analysis of Fig. 2, ROA (Return on Assets) was reduced by 1.63%, compared to the previous year, and the total asset turnover ratio was sustained to a similar degree, from 1.09 to 1.12. The biggest reason why ROA greatly dropped was because of a constant reduction in the return on medical profits. As analyzed earlier, the medical profits increased every year, but the increase was smaller than that of medical expenses, so its net profit changed to net loses in 2012, constantly leading to accumulated losses. The return on equity of A University Hospital was –7.06% in 2013, which was 5.78% less than that in 2012. The reason why the return on equity was reduced is because the return on medical profits constantly decreased, but the total asset turnover ratio and the debt ratio were sustained in almost the same level. The total asset turnover ratio was 1.12 times, which was about 1 cycle, which shows a relatively stable management. Besides, compared to the size of medical profits created, investments were stably made into assets. However, as examined earlier, the weight of fixed assets became heavier out of all the assets, and it caused a reduction in the financial liquidity.
The ROI analysis showed that the medical
expenses were larger than the medical profits,
further increasing more losses than profits. As
a result, the return on equity was constantly
Account Title 2011 2012 2013
Ⅰ. Medical profits 100.00 100.00 100.00
1. Medical profits 100.00 100.00 100.00
∙ Inpatient profits 62.73 61.91 61.64
∙ Outpatient profits 36.03 36.82 37.25
∙ Other medical profits 1.24 1.26 1.11
2. Medical profit adjustment 0.00 0.00 0.00
Ⅱ. Medical expenses 102.13 103.36 105.50
1. Personnel expenses 36.59 38.07 40.13
∙ Wages 15.28 16.13 16.83
∙ Sundry allowances 16.58 16.96 17.69
∙ Retirement allowances 4.73 4.97 5.60
2. Material costs 38.88 38.58 38.28
∙ Pharmaceutical costs 17.25 17.06 17.38
∙ Treatment material expenses 20.98 20.87 20.26
∙ Food material expenses 0.65 0.65 0.64
3. Management costs 23.89 23.64 24.00
∙ Welfare benefits 4.61 4.56 4.87
∙ Travel & transportation expenses 0.07 0.05 0.04
∙ Communication expenses 0.18 0.20 0.21
∙ Utility expenses 1.06 1.15 1.26
∙ Taxes and public imposts 0.10 0.11 0.19
∙ Insurance expenses 0.07 0.08 0.10
∙ Environment management costs 0.91 0.91 0.89
∙ Rent expenses 0.05 0.06 0.07
∙ Payment commission 0.54 0.55 0.70
∙ Repair costs 0.74 0.73 0.63
∙ Vehicle maintenance costs 0.04 0.04 0.04
∙ Education & training expenses 0.40 0.42 0.33
∙ Book & printing expenses 0.14 0.14 0.14
∙ Business operating expenses 0.35 0.33 0.33
∙ Event expenses 0.17 0.12 0.12
∙ Fuel expenses 0.65 0.64 0.65
∙ Medical social work expenses 0.10 0.10 0.09
∙ Expenses for supplies 0.56 0.64 0.67
∙ Research expenses 1.36 1.38 1.33
∙ Depreciation costs 6.92 6.98 6.60
∙ Depreciation costs of intangible assets 0.55 0.53 0.66
∙ Advertising & promotion expenses 0.18 0.11 0.12
∙ Bad debt expenses 0.00 0.00 0.01
∙ Clothing & bedding expenses 0.38 0.45 0.45
∙ Outsourcing expenses 3.53 3.00 3.16
∙ Delivery & storage fees 0.01 0.04 0.00
∙ Research & analysis expenses 0.00 0.00 0.00
∙ Prize expenses 0.02 0.03 0.02
∙ Department supply expenses 0.13 0.16 0.20
∙ Other expenses 0.09 0.12 0.11
4. Selective treatment expenses 2.78 3.07 3.09
∙ Selective treatment allowance 1.55 1.81 1.94
∙ Selective treatment research expenses 0.56 0.54 0.57
∙ Other selective treatment-related expenses 0.67 0.73 0.58
∙ Treatment department support expenses 0.00 0.00 0.00
Table 3. Common-type Profit and Loss Statement (Unit: %)
Ⅲ. Medical benefits -2.13 -3.36 -5.50
Ⅳ. Non-medical benefits 7.30 7.34 8.03
1. Extra profits 0.36 0.33 0.32
∙ Funeral profits 0.08 0.07 0.07
∙ Funeral article profits 0.03 0.03 0.03
∙ Funeral restaurant profits 0.17 0.16 0.15
∙ Funeral stall profits 0.04 0.04 0.04
Other funeral profits 0.02 0.02 0.02
∙ Other profits incidental to medical services 0.01 0.01 0.01
2. Interest profits 0.81 0.77 0.47
3. Rent profits 0.04 0.04 0.05
4. Foreign exchange profits 0.00 0.00 0.00
5. Reversal of allowance for bad debts 0.00 0.11 0.00
6. Donation profits 1.95 2.55 2.59
∙ National subsidies 1.86 2.35 2.42
∙ Donation profits 0.09 0.20 0.17
7. Parking lot profits 0.14 0.13 0.12
8. Gains on disposal of tangible assets 0.01 0.00 0.00
9. Sundry profits 2.08 0.76 0.42
∙ Dormitory profits 0.00 0.00 0.00
∙ Other sundry profits 2.08 0.76 0.42
∙ Staff restaurant profits 0.00 0.00 0.00
10. Reversal of reserve funds for medical development 0.66 1.28 2.62
11. Gains on prior period error corrections 0.01 0.04 0.09
12. Other profits 1.25 1.33 1.34
Ⅴ. Non-medical expenses 5.07 4.21 4.30
1. Additional non-medical expenses 0.15 0.14 0.13
∙ Funeral article expenses 0.02 0.02 0.02
∙ Funeral restaurant material expenses 0.10 0.09 0.09
∙ Funeral food expenses 0.00 0.00 0.00
∙ Funeral stall article expenses 0.03 0.03 0.03
∙ Other funeral material expenses 0.00 0.00 0.00
∙ Other additional medical expenses 0.00 0.00 0.00
2. Interest expenses 0.41 0.35 0.24
3. Donations 0.06 0.13 0.06
4. Losses on disposal of tangible assets 0.00 0.01 0.00
5. Losses on disposal of intangible assets 0.00 0.00 0.00
6. Full reverse funds for essential business 1.55 0.00 0.00
7. Sundry losses 0.00 0.00 0.00
∙ Losses on reduction of medical costs 0.00 0.00 0.00
∙ Dielectric research center-related expenses 0.00 0.00 0.00
8. Outsourcing research expenses 0.82 0.81 1.01
9. Losses on prior period error corrections 0.06 0.19 0.05
10. Expenses for other projects 2.01 2.57 2.80
11. Losses on foreign currency transaction 0.00 0.00 0.00
Ⅵ. Ordinary profits 0.10 -0.23 -1.76
Ⅶ. Special profits 0.00 0.00 0.00
∙ Additional special profits 0.00 0.00 0.00
Ⅷ. Special losses 0.07 0.12 0.22
∙ Additional special losses 0.07 0.12 0.22
Ⅸ. Corporate tex and so on 0.00 0.00 0.00
Ⅹ. Current net profits 0.03 -0.35 -1.98
Source: (www.alio.go.kr)3), (www.hira.or.kr)4), (www.mw.go.kr)5).