138
ORIGINAL ARTICLEDOI 10.4070 / kcj.2009.39.4.138
Print ISSN 1738-5520 / On-line ISSN 1738-5555 Copyright ⓒ 2009 The Korean Society of Cardiology
Association Between Inappropriateness of Left Ventricular Mass and Left Ventricular Diastolic Dysfunction:
A Study Using the Tissue Doppler Parameter, E/E’
Young Hyo Lim, MD, Jae Ung Lee, MD, Kyung Soo Kim, MD, Soon Gil Kim, MD, Jeong Hyun Kim, MD, Heon Kil Lim, MD, Bang Hun Lee, MD and Jinho Shin, MD
Cardiology Division, Department of Internal Medicine, Hanyang University College of Medicine, Seoul, Korea ABSTRACT
Background and Objectives:
The structural significance of the inappropriateness of left ventricular mass (iLVM) is known to be an important prognostic factor for cardiovascular events; however, the functional changes associ- ated with iLVM have not been established. This study was performed to determine if diastolic dysfunction is asso- ciated with iLVM using a tissue Doppler technique.
Subjects and Methods:Three hundred sixty consecutive sub- jects, including 221 hypertension patients from the echocardiography database, were analyzed. Regarding the ap- propriateness of left ventricular (LV) mass, an observed/predicted ratio of LV mass (OPR) >130% was defined as inap- propriate. Echocardiographic parameters, including early diastolic peak velocity (E)/late diastolic peak velocity (A), deceleration time (DT), isovolumetric relaxation time (IVRT), and E/early mitral annulus velocity (E’), were com- pared between the appropriate LV mass (aLVM) group and the iLVM group.
Results:Among transmitral flow parameters, only the E velocity was negatively correlated with the OPR when adjusted for age (adjusted r=-0.107, p=0.04). Based on multiple regression analysis, the OPR (β=0.163, p=0.003), as well as age (β=0.286, p=
0.0001), systolic blood pressure (β=0.120, p=0.019), fasting blood glucose (β=0.098, p=0.042), and male gender (β=0.157, p=0.002) were independent factors determining E/E’. The cholesterol level was not an independent factor (β=-0.059, p=0.355). In the iLVM group (n=105), the adjusted E/E’ was higher than in the aLVM group (n=255; 11.7±3.4 vs. 10.8±3.1, p=0.02), while the peak E flow velocity was significantly lower than in the aLVM group (70.9±15.1 vs. 75.5±17.6, p=0.03).
Conclusion:Inappropriateness of LV mass is independently associated with increased E/E’. Thus, E/E’ may be a useful parameter for the evaluation of diastolic dysfunction.
(Korean Circ J 2009;39:138-144)KEY WORDS:
Hypertrophy; Left ventricle; Echocardiography.
Introduction
Left ventricular hypertrophy (LVH) is a well-known prognostic factor for cardiovascular events.
1)Left ventri- cular (LV) mass is influenced by hemodynamic factors, such as high blood pressure and stroke work, as well as constitutional factors, such as body size and gender.
2)Inappropriateness of LV mass (iLVM) is defined in cases in which the degree of LVH is excessive considering he-
modynamic and constitutional factors, and it may be represented by the percent ratio of the observed LV mass to the predicted LV mass by height, gender, and st- roke work. Blood pressure, which is important in the development of LVH, is included in the equation for stroke work calculation.
Inappropriateness of LV mass has been reported to be an independent prognostic factor, regardless of the presence of LVH or not.
3)Inappropriately or excessively increased LV mass is associated with metabolic abnor- mality, systolic dysfunction, and concentric geometry of LV, which is independent of the presence of hyperten- sion.
4-6)iLVM has also been reported to be associated with diastolic dysfunction, which can be demonstrated using various transmitral blood flow parameters.
7)While the functional implication of iLVM is an important issue, there may be an argument for this association because
Received: July 17, 2008
Revision Received: December 3, 2008 Accepted: January 10, 2009
Correspondence: Jinho Shin, MD,Cardiology Division, Department of Internal Medicine, Hanyang University College of Medicine, 17 Haengdang-dong, Seongdong-gu, Seoul 133-792, Korea
Tel: 82-2-2290-8308, Fax: 82-2-2298-9183 E-mail: jhs2003@hanyang.ac.kr
Young Hyo Lim, et al.·
139
of the intrinsic limitations of the transmitral flow para- meters. The objective of this study was to clarify the re- lationship between iLVM and diastolic dysfunction using a tissue Doppler technique which is more reliable than transmitral blood flow parameters.
Subjects and Methods
In a cross-sectional design, data from 360 consecutive patients, including 221 hypertensive patients with or wi- thout hypercholesterolemia, were analyzed. The dataset was acquired by applying exclusion criteria to a conse- cutive patient echocardiography database, including 2,515 patients from 1 December 2004 to 31 August 2005 at Hanyang University Hospital in Seoul, Korea. Exclu- sion criteria included poor acoustic image quality, M- mode interrogation angle >10°, any regional wall motion abnormalities, grade II or greater valvular regurgitation, any valvular stenosis, ejection fraction <50%, pericardial disease, cardiomyopathy based on the echocardiographic findings, atrial fibrillation, creatinine level >1.5 mg/dL for males and 1.4 mg/dL for females, hemoglobin <13 mg/dL in males and <12 mg/dL in females, clinical his- tory of angina, congestive heart failure, known coronary artery disease, and incomplete clinical data.
During the study period, height, weight, abdominal circumference, blood pressure, and heart rate were meas- ured before echocardiography was performed. Blood pressure was measured 2 times with 1 minute interval using an A&D UA-767 (AND, Japan) and the averaged value was used for analysis. Abdominal circumference was measured at the mid-level of the abdomen between the iliac crest and the lower costal margin with a spring- loaded measuring tape in the sitting or standing posi- tion, according to the World Health Organization gui- delines.
8)Duplicate measurements were made in all cases and the average was used for analysis unless there was <3% difference between the measurements, in which case the measurement was not used for analysis. The levels of total cholesterol, triglycerides, high density lipo- protein (HDL), fasting blood glucose (FBG), and serum creatinine were obtained from the medical records. The study protocol was approved by the Institutional Review Board of Hanyang University Medical Center. Infor- med consent was obtained from each patient regarding the process of the examination and use of the data.
Abdominal obesity was defined by abdominal circum- ference ≥80 cm in females and ≥90 cm in males with the Asia-Pacific perspective.
9)Metabolic syndrome was defined by the Adult Treatment Panel III guidelines.
10)Echocardiography
Two-dimensional and guided M-mode echocardio- grams were performed on each subject by a single sono- grapher with a commercially available machine (IE-33;
Philips) with a 1-5 MHz transducer. Measurements for M-mode-guided calculations of LV mass were taken at or just below the tip of the mitral valve with a paper speed of 50 mm/sec. The LV internal end-diastolic di- mension (EDD), the end systolic dimension (ESD), and the septal and posterior wall thicknesses (PWT) were measured on the leading edge-to-the leading edge, accord- ing to the guidelines of the American Society of Echo- cardiography. LV mass was calculated by the following equation: 1.04×(IVSd+LVDd+PWTd)
3-LVDd
3)×0.8 + 0.6.
11)Doppler echocardiographic recordings were performed by pulsed-wave Doppler with the sample volume at the tips of the mitral valve in the apical four-chamber view and recorded at a paper speed of 100 mm/sec. Early (E) and late (A) diastolic peak velocities, deceleration time (DT), and early-to-late diastolic peak velocity ratio (E/A) were determined, as previously reported.
12)For patients
< 55 years of age, impaired relaxation was diagnosed if the E/A ratio <1 or the DT ≥240 ms. For older patie- nts, both an E/A ratio <0.8 and a DT ≥240 ms were required to diagnose impaired relaxation.
13)Early mitral annulus velocity (E’) was measured at the septal portion of the mitral annulus in an apical four chamber view using a tissue Doppler technique with a Nyquist limit of 15 cm/s.
Appropriateness of left ventricular mass
Appropriateness of LV mass (aLVM) was expressed as the observed/predicted ratio (OPR) of the LV mass.
3)The predicted LV mass was calculated as previously describ- ed.
14)Briefly, the LV mass was predicted by the following equation: 54.9+7.62×height (m
2.7)+0.67×stroke work (g-m/beat)-13.2×gender (male=1, female=2) (const- ant=54.9±14.7 g, adjusted R
2= 0.576, SEE=21.67, p=
0.001).
We adopted the LV mass index by the height to high- light the effect of weight and set the cut-off value (mean+2 SD) for LVH as 54 g/m
2.7for both genders.
The cut-off value between the iLVM and aLVM groups was 130% or higher for both genders.
Statistical analysis
Data were expressed as the mean±SD. For the simple analysis of general characteristics and the gender differ- ence, chi-square and independent t-tests were performed.
Comparing the means among groups, age, gender, body
mass index (BMI), systolic blood pressure (SBP), heart
rate, fasting blood glucose (FBG) and the type of antihy-
pertensive therapy {using indicator variables for angioten-
sin-converting enzyme (ACE) inhibitors or angiotensin
II receptor antagonists, other anti-hypertensive drugs,
and no drug therapy} were adjusted using the least squ-
are means or a univariate general linear model for each
dependent variable. Least squares multiple linear regres-
140
·E/E’ and Excessive LV Masssion analysis (stepwise procedure) was used to evaluate the relationships, with assessment of in-model tolerance to evaluate multiple-collinearity. The minimal accepted tolerance was 0.70. A two-tailed p<0.05 was considered to be statistically significant. Data were analyzed using Statistical Package for Social Science (SPSS) 12.0 software (SPSS Inc., Chicago, IL, USA).
Results
General characteristics of the subjects
The average age of the subjects was 58.1±13.9 years (range, 19-87 years). Two hundred of the subjects (55.5%) were females. Two hundred twenty-one of the subjects (61.3%) had hypertension, 71 (19.7%) had diabetes melli- tus, 72 (20%) had hypercholesterolemia, and 106 (29.4%) had no risk factors. Thirty-nine patients (10.8%) had both hypertension and diabetes. Thirty-one patients (8.9%) had both hypertension and hypercholesterolemia.
Four patients (1.1%) had both diabetes and hypercho- lesterolemia. Nineteen patients (5.2%) had hypertension, diabetes, and hypercholesterolemia. One hundred sev- enty patients (47.2%) had metabolic syndrome. Abdom- inal obesity was noted in 249 (69.1%) patients.
Among 221 hypertensive patients, 144 (65.1%) were on medical treatment; specifically, 68 patients (30.7%) were taking a prescription, including an angiotensin con-
verting enzyme inhibitor or an angiotensin receptor an- tagonist, and 76 patients (34.4%) were taking other types of antihypertensive drugs.
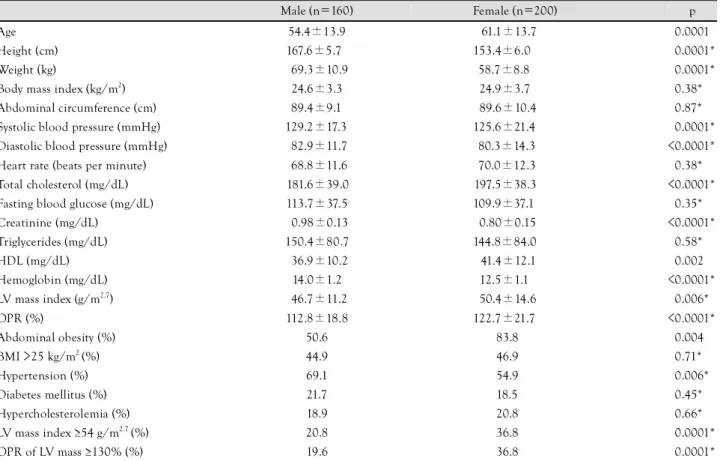
In a comparison of general characteristics between the male and female patients, the average age of the female patients was older (61.3±13.7 vs. 54.4±13.9 years, p=
0.0001). The age-adjusted systolic and diastolic blood pressures were higher in male patients. The frequencies of increased BMI, diabetes mellitus, and hypercholes- terolemia were similar in males and females. In female patients, the degree of abdominal obesity was much higher compared with male patients (83.8% vs. 50.6%) (Table 1).
Clinical characteristics between the appropriate- ness and inappropriateness of left ventricular mass groups
In 217 subjects (60.3%), the LVs were normal with re- spect to both the LV mass index and the appropriateness.
Forty-six patients (12.8%) had inappropriate LV mass with a normal LV mass index. Thirty-eight patients (10.5%) had appropriate LV mass with an abnormal LV mass index and 59 patients (16.4%) had inappropriate LV mass and abnormal LV mass index. Among all the patients, 105 patients (29.1%) had inappropriate LV mass and 255 patients (70.9%) had appropriate LV mass (Table 2).
Table 1. General characteristics of subjects
Male (n=160) Female (n=200) p
Age 54.4±13.9 61.1±13.7 <0.0001
Height (cm) 167.6±5.7 153.4±6.0 <0.0001*
Weight (kg) 69.3±10.9 58.7±8.8 <0.0001*
Body mass index (kg/m2) 24.6±3.3 24.9±3.7 <0.38*
Abdominal circumference (cm) 89.4±9.1 89.6±10.4 <0.87*
Systolic blood pressure (mmHg) 129.2±17.3 125.6±21.4 <0.0001*
Diastolic blood pressure (mmHg) 82.9±11.7 80.3±14.3 <0.0001*
Heart rate (beats per minute) 68.8±11.6 70.0±12.3 <0.38*
Total cholesterol (mg/dL) 181.6±39.0 197.5±38.3 <0.0001*
Fasting blood glucose (mg/dL) 113.7±37.5 109.9±37.1 <0.35*
Creatinine (mg/dL) 0.98±0.13 0.80±0.15 <0.0001*
Triglycerides (mg/dL) 150.4±80.7 144.8±84.0 <0.58*
HDL (mg/dL) 36.9±10.2 41.4±12.1 <0.002
Hemoglobin (mg/dL) 14.0±1.2 12.5±1.1 <0.0001*
LV mass index (g/m2.7) 46.7±11.2 50.4±14.6 <0.006*
OPR (%) 112.8±18.8 122.7±21.7 <0.0001*
Abdominal obesity (%) 50.6 83.8 <0.004
BMI >25 kg/m2 (%) 44.9 46.9 <0.71*
Hypertension (%) 69.1 54.9 <0.006*
Diabetes mellitus (%) 21.7 18.5 <0.45*
Hypercholesterolemia (%) 18.9 20.8 <0.66*
LV mass index ≥54 g/m2.7 (%) 20.8 36.8 <0.0001*
OPR of LV mass ≥130% (%) 19.6 36.8 <0.0001*
Continuous values are the mean±SD. *p<0.05 adjusted for age. HDL: high density lipoprotein, LV: left ventricular, OPR: observed/predicted ratio of LV mass, BMI: body mass index
Young Hyo Lim, et al.·
141
Patients with iLVM were older (63.0±11.8 vs. 56.1±
14.2 years, p=0.0001) and more likely to be female (73.3% vs. 48.0%, p=0.0001). In the iLVM group, BMI (26.0±3.2 vs. 24.3±3.6, p=0.0001) and total choleste- rol (201.6±36.2 vs. 185.1±36.5 mg/dL, p=0.001) was
higher. The frequencies of abdominal obesity (74.0% vs.
68.4%), diabetes mellitus (23.4% vs. 18.5%) and hyper- tension (58.2% vs. 62.4%) were not different when ad- justed for age and gender (Table 3).
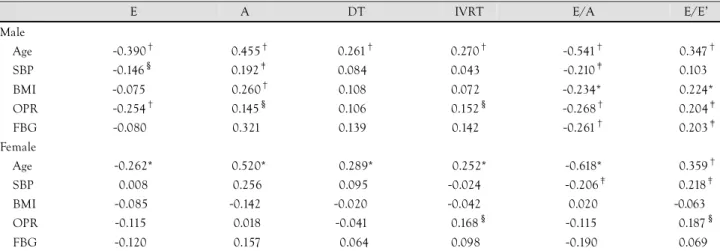
Observed/predicted ratio versus transmitral flow pattern
Among transmitral blood flow parameters, only iso- volumetric relaxation time (IVRT) showed a correlation with OPR in males. In female patients, E, A, E/A, and IVRT showed an association with OPR (Table 4). For both genders, however, only the inverse relationship between E velocity and OPR, when adjusted by age, was significant among the transmitral flow parameters (Table 5).
Table 2. Clinical characteristics of subjects
LV appropriateness (OPR) aLVM iLVM Total Normal (%) 217 (60.3) 46 (12.8) 263 LV mass
index Abnormal (%) 38 (10.5) 59 (16.4) 097
Total 255 105 360
LV: left ventricular, OPR: observed/predicted ratio of left ventricular mass, aLVM: appropriate LV mass, iLVM: inappropriate LV mass
Table 3. Comparison between groups of appropriate LV mass (aLVM) versus inappropriate LV mass (iLVM)
aLVM (n=255) iLVM (n=105) p
Age 56.1±14.2 63.0±11.8 0.0001
Female (%) 48.0 73.3 0.0001
Body mass index (kg/m2) 24.3±3.6 26.0±3.2 0.0001
Abdominal circumference (cm) 90.0±9.86 89.3±9.8 0.40
Systolic blood pressure (mmHg) 129.9±19.7 120.6±17.1 0.0001 Diastolic blood pressure (mmHg) 83.6±13.6 77.3±11.8 0.0001
Heart rate (beats per minute) 69.6±11.7 69.0±12.7 0.45
Total cholesterol (mg/dL) 185.1±36.5 201.6±36.2 0.001
Fasting blood glucose (mg/dL) 109.8±35.1 116.0±41.4 0.14
Creatinine (mg/dL) 0.89±0.17 0.87±0.15 0.51
Triglycerides (mg/dL) 142.8±77.5 160.0±91.5 0.14
HDL (mg/dL) 38.6±10.5 40.8±13.4 0.16
Hemoglobin (mg/dL) 13.1±1.4 13.2±1.4 0.32
Hypercholesterolemia (%) 17.0 29.9 0.01
Diabetes mellitus (%) 18.5 23.4 0.34
Hypertension (%) 62.4 58.2 0.48
Abdominal obesity (%) 68.4 74.0 0.22
Body mass index >25 kg/m2 (%) 41.0 58.1 0.002
Continuous values are the mean±SD adjusted by age, gender, body mass index, systolic blood pressure, heart rate, fasting blood glucose level, and the type of antihypertensive therapy. HDL: high density lipoprotein, LV: left ventricle, DT: deceleration time, IVRT: isovolumetric relaxation time
Table 4. Pearson correlation coefficients between age, SBP, BMI, OPR, FBG, and echocardiographic parameters
E A DT IVRT E/A E/E’
Male
Age -0.390† 0.455† 0.261† 0.270† -0.541† -0.347†
SBP -0.146§ 0.192‡ 0.084 0.043 -0.210‡ -0.103
BMI -0.075 0.260† 0.108 0.072 -0.234* -0.224*
OPR -0.254† 0.145§ 0.106 0.152§ -0.268† -0.204‡
FBG -0.080 0.321 0.139 0.142 -0.261† -0.203‡
Female
Age -0.262* 0.520* 0.289* 0.252* -0.618* -0.359†
SBP 0.008 0.256 0.095 -0.024 -0.206‡ -0.218‡
BMI -0.085 -0.142 -0.020 -0.042 0.020 -0.063
OPR -0.115 0.018 -0.041 0.168§ -0.115 -0.187§
FBG -0.120 0.157 0.064 0.098 -0.190 -0.069
*p=0.001, †p<0.001, ‡p<0.01, §p<0.05. SBP: systolic blood pressure, BMI: body mass index, OPR: observed/predicted ratio of left ventricular mass, FBG: fasting blood glucose, E: early diastolic peak velocity, A: late diastolic peak velocity, E’: early mitral annulus velocity, DT: deceleration time, IVRT: isovolumetric relaxation time
142
·E/E’ and Excessive LV MassObserved/predicted ratio versus early diastolic peak velocity/early mitral annulus velocity
The age, BMI, FBG level, and OPR were significantly correlated with E/E’ in male patients. The age, SBP, and OPR were significantly correlated with E/E’ in female patients (Table 4). In multiple regression analysis, age (β=0.286, p=0.0001), SBP (β=0.120, p=0.019), FBG (β=0.098, p=0.042), male gender (β=0.157, p=0.002), and OPR (β=0.163, p=0.003) were independent factors for E/E’. The cholesterol level was not an independent factor (β=-0.059, p=0.355).
Comparison between groups
When adjusted by age, gender, BMI, SBP, cholesterol level, FBG, and types of antihypertensive medications, both the diastolic LV dimension (5.06±0.46 vs. 4.91±
0.44, p=0.007) and the relative wall thickness (0.38±
0.04 vs. 0.33±0.04, p<0.0001) were higher in the iLVM group. In the iLVM group, peak E flow velocity was significantly lower than in the aLVM group (70.9±15.1 vs. 75.5±17.6, p=0.03), as well as E’ velocity (6.59±
2.04 vs. 7.34±1.50 cm/sec, p=0.001). E/E’ was higher in iLVM group (11.7±3.4 vs. 10.8±3.1, p=0.02) (Ta- ble 6) (Fig. 1). The E/E’ was 10.7±0.2 in normal LV
mass, 10.9±0.5 in patients with iLVM without LVH, 11.2±0.5 in appropriate LVH patients, and 12.1±0.4 in inappropriate LVH patients {analysis of variance (A- NOVA), p=0.02}.
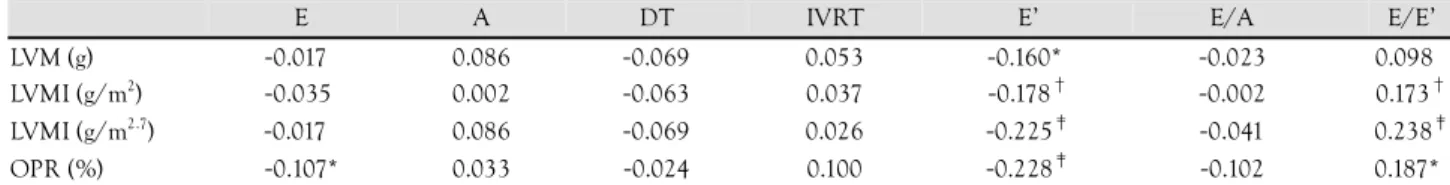
Table 5. Age-adjusted correlation coefficients between LV structure and diastolic function
E A DT IVRT E’ E/A E/E’
LVM (g) -0.017 0.086 -0.069 0.053 -0.160* -0.023 0.098
LVMI (g/m2) -0.035 0.002 -0.063 0.037 -0.178† -0.002 0.173† LVMI (g/m2.7) -0.017 0.086 -0.069 0.026 -0.225‡ -0.041 0.238‡ OPR (%) -0.107* 0.033 -0.024 0.100 -0.228‡ -0.102 0.187*
*p<0.05, †p=0.001, ‡p<0.001. LV: left ventricular, LVM: left ventricular mass, LVMI: left ventricular mass index, OPR: observed/predicted ratio of left ventricular mass, E: early diastolic peak velocity, A: late diastolic peak velocity, DT: deceleration time, IVRT: isovolumic relaxation time, E’: early mitral annulus velocity
Table 6. Left ventricular dimensions and diastolic properties
aLVM (n=255) iLVM (n=105) p
LV diastolic dimension (cm) 4.91±0.44 5.06±0.46 <.007
Relative wall thickness (cm) 0.33±0.04 0.38±0.04 <.0001
LV mass (gram) 157.5±39.2 207.2±44.8 <.0001
LV mass index (gram/m2.7) 44.7±10.9 59.8±12.5 <.0001
OPR (%) 109.1±13.2 141.4±11.6 <.0001
Ejection fraction (%) 68.8±5.72 66.8±4.91 0.005
LA dimension (cm) 3.28±0.53 3.45±0.58 0.17
Peak E flow velocity (cm/sec) 75.5±17.6 70.9±15.1 0.03
Peak A flow velocity (cm/sec) 77.8±18.2 77.0±18.7 0.68
Peak E/A velocity ratio 1.02±0.38 0.97±0.30 0.15
E velocity deceleration time (msec) 214.3±43.2 208.9±44.3 0.34
Isovolumetric relaxation time (msec) 80.7±13.9 82.2±15.2 0.43
E’ velocity (cm/sec) 7.34±1.50 6.59±2.04 0.001
Impaired relaxation (%) 19.9 24.7 0.39
E/E’ 10.8±3.1 11.7±3.4 0.02 Continuous values are the mean±SD adjusted by age, gender, BMI, systolic blood pressure, heart rate, fasting blood glucose level, and the
type of antihypertensive therapy. LA: left atrium, LV: left ventricular, OPR: observed/predicted ratio of LV mass, E: early diastolic peak velocity, A:
late diastolic peak velocity, E’: early mitral annulus velocity, BMI: body mass index
Fig. 1. Adjusted E/E’ by age, gender, BMI, systolic blood pres- sure, cholesterol level, fasting blood glucose level, and types of antihypertensive medication is significantly higher in the inappro- priate LV mass group than the appropriate LV mass group. E:
early diastolic peak velocity, E’: early mitral annulus velocity, BMI:
body mass index, LV: left ventricular.
12
10
8
Normal (n=255) iLVM (n=105) p=0.02
E/E’
Young Hyo Lim, et al.·
143
Discussion
This study was designed to clarify the functional sig- nificance of the inappropriately increased LV mass using a tissue Doppler technique, in addition to the traditional tr- ansmitral flow parameters. The results showed that the appropriateness of LV mass is an independent factor de- termining E/E’, along with age, SBP, gender, and FBG level. The adverse influence of inappropriate LV mass was evidenced by the finding that the adjusted E/E’ va- lue was higher in the iLVM group. In the iLVM group, the E velocity was lower, and the E’ velocity was even lower. Accordingly, the resultant E/E’ was lower in the iLVM group than the aLVM group.
In contrast, with respect to the transmitral flow para- meters, only the inverse correlation between the OPR and the transmitral E velocity was significant when ad- justed for age. The borderline statistical significance for IVRT may be attributable to the smaller sample size com- pared to a previous study.
7)Transmitral flow parameters are widely used for practicality reasons; however, the non-linearity associated with LV function deterioration make it difficult to interpret the functional relevance of the structural changes of the LV. E/E’ is advantageous because of its linear relationship with the left atrial pres- sure or brain natriuretic peptide (BNP).
Some authors have pointed out that the indexation methods of LV mass (e.g., indexation by body surface area or height
2.7) have a different clinical significance.
20)Of note, the functional aspect of these different indexa- tions has not been clarified. Our study showed that age- adjusted partial correlation coefficients between E/E’ and LV mass, regardless of using different indexations, were consistently significant, as well as the OPR of the LV mass (Table 5).
Age, gender and the LV mass are well-known con- tributors for E’ velocity or E/E’.
21)22)There may be an argument against the suggestion that the OPR of the LV mass have additional value to the traditionally defined LV hypertrophy regarding the influence on diastolic dys- function. In our study, the correlation coefficients of the OPR versus LVM, LVMI indexed by body surface area, and LVMI indexed by height
2.7were similar (0.502, 0.590, and 0.647, respectively); however, the correlation coefficient between LVMI indexed by body surface area and LVMI indexed by height
2.7(0.928) was in contrast with the OPR and LVMI indexed by height (0.68)
2.7.
With the limitation that the number of patients in the study did not allow multiple comparisons among gr- oups, only in the inappropriate LVH group, the E/E’
value was higher than the group of normal LV mass. The E/E’ in iLVM without LVH or aLVH was not statistically different from that of the normal LV mass group. These findings suggest that inappropriateness of LV mass is functionally more important in LVH patients. There
might be an additive or synergistic interaction between LVH and the appropriateness of LV mass. For sufficient statistical analysis of the interaction between appropri- ate LVH and inappropriate LVM, a study with a larger sample size is needed.
LV dysfunction was demonstrated in patients with pre- hypertension, and even in normotensive patients
23)and the additive effect of diabetes on myocardial dysfunction in hypertension was also reported.
24)These findings sug- gest that there may be other factors affecting LV dys- function than blood pressure itself. In our study, ano- ther consistent finding with the previously reported data is that BMI was much higher in the iLVM group.
4)The prevalence of abdominal obesity was not different betw- een the groups. This may be attributable to the Asian Pacific criteria for abdominal obesity.
9)Using these crite- ria, the prevalence in the population was relatively high
25)and there is a suggestion for a new cutoff value for abdo- minal obesity for the Korean population.
26)Another po- ssible explanation may be that abdominal obesity may be an early sign of obesity and the difference between abdo- minal obesity is evident only before overt obesity devel- ops.
14)Even though our data derived from the database of the echocardiography laboratory and hospital records included quite heterogeneous subjects, other parameters associated with iLVM, such as anemia, renal insufficiency, and thyroid dysfunction were excluded very cautiously.
Thus, regarding LV diastolic function, the inappropria- teness of LV mass might be another factor to be conside- red in addition to the presence or absence of LVH in pa- tients with a wide spectrum of cardiovascular risk factors.
In conclusion, inappropriateness of LV mass is func- tionally associated with LV dysfunction and high left atrial pressure.
REFERENCES
1) Levy D, Garrison RJ, Savage DD, Kannel WB, Castelli WP. Prog- nostic implications of echocardiographically determined left ven- tricular mass in the Framingham Heart Study. N Engl J Med 1990;322:1561-6.
2) de Simone G, Devereux RB, Kimball TR, et al. Interaction between body size and cardiac workload: influence on left ventricular mass during body growth and adulthood. Hypertension 1998;31:1077- 82.
3) de Simone G, Verdecchia P, Pede S, Gorini M, Maggioni AP.
Prognosis of inappropriate left ventricular mass in hypertension.
Hypertension 2002;40:470-6.
4) Palmieri V, de Simone G, Roman MJ, Schwartz JE, Pickering TG, Devereux RB. Ambulatory blood pressure and metabolic abnor- malities in hypertensive subjects with inappropriately high left ventricular mass. Hypertension 1999;34:1032-40.
5) de Simone G, Pasanisi F, Contaldo F. Link of nonhemodynamic factors to hemodynamic determinants of left ventricular hyper- trophy. Hypertension 2001;38:13-8.
6) Celentano A, Palmieri V, Esposito ND, et al. Inappropriate left ventricular mass in normotensive and hypertensive patients. Am J Cardiol 2001;87:361-3, A10.
144
·E/E’ and Excessive LV Mass7) de Simone G, Kitzman DW, Palmieri V, et al. Association of inap- propriate left ventricular mass with systolic and diastolic dysfunc- tion. Am J Hypertens 2004;17:828-33.
8) World Health Organization. Physical status: the use and interpre- tation of anthropometry. World Health Organ Tech Rep Ser 1995;
854:1-452.
9) Inoue S, Zimmet P. The Asia-Pacific perspective: redefining obe- sity and its treatment. Health Communications Australia Pty Li- mited Sydney 2000;2:5-21.
10) Expert Panel on Detection, Evaluation, and Treatment of High Blood Cholesterol in Adults. Executive Summary of The Third Re- port of The National Cholesterol Education Program (NCEP) Expert Panel on Detection, Evaluation, And Treatment of High Blood Cholesterol In Adults (Adult Treatment Panel III). JAMA 2001;285:2486-97.
11) Devereux RB, Alonso DR, Lutas EM, et al. Echocardiographic assessment of left ventricular hypertrophy: comparison to necro- psy findings. Am J Cardiol 1986;57:450-8.
12) Sohn DW, Choi YJ, Oh BH, Lee MM, Lee YW. Estimation of left ventricular end-diastolic pressure with the difference in pul- monary venous and mitral A durations is limited when mitral E and A waves are overlapped. J Am Soc Echocardiogr 1999;12:
106-12.
13) Lubien E, DeMaria A, Krishnaswamy P, et al. Utility of B-natriu- retic peptide in detecting diastolic dysfunction: comparison with Doppler velocity recordings. Circulation 2002;105:595-601.
14) Shin J, Kim KS, Kim SK, et al. Influences of body size and cardiac workload on the left ventricular mass in healthy Korean adults with normal body weight and blood pressure. Korean Circ J 2005;35:335-40.
15) Conrady AO, Rudomanov OG, Zaharov DV, et al. Prevalence and determinants of left ventricular hypertrophy and remodelling pa- tterns in hypertensive patients. Blood Press 2004;13:101-9.
16) Devereux RB, Dahlof B, Gerdts E, et al. Regression of hyperten- sive left ventricular hypertrophy by losartan compared with aten- olol. Circulation 2004;110:1456-62.
17) Racette SB, Evans EM, Weiss EP, Hagberg JM, Holloszy JO.
Abdominal adiposity is a stronger predictor of insulin resistance than fitness among 50-95 year olds. Diabetes Care 2006;29:673-8.
18) Price GM, Uauy R, Breeze E, Bulpitt CJ, Fletcher AE. Weight, shape, and mortality risk in older persons: elevated waist-hip ra- tio, not high body mass index, is associated with a greater risk of death. Am J Clin Nutr 2006;84:449-60.
19) Ix JH, Shlipak MG, Chertow GM, Ali S, Schiller NB, Whooley MA. Cystatin C, left ventricular hypertrophy, and diastolic dys- function. J Card Fail 2006;12:601-7.
20) Ferrara LA, Vaccaro O, Cardoni O, Laurenzi M, Mancini M, Zan- chetti A. Indexation criteria of ventricular mass and predictive role of blood pressure and body composition. Am J Hypertens 2005;18:1282-7.
21) De Sutter J, De Backer J, van de Veire N, Velghe A, De Buyzere M, Gillebert TC. Effects of age, gender, and left ventricular mass on septal mitral annulus velocity (E’) and the ratio of transmitral early peak velocity to E’ (E/E’). Am J Cardiol 2005;95:1020-3.
22) Rovner A, de las Fuentes L, Waggoner AD, Memon N, Chohan R, Dávila-Román VG. Characterization of left ventricular diasto- lic function in hypertension by use of Doppler tissue imaging and color M-mode techniques. J Am Soc Echocardiogr 2006;19:
872-9.
23) Ahn HS, Kim SJ, Kim MK, et al. The difference of left ventri- cular hypertrophy and diastolic function between prehypertensives and normotensives. Korean Circ J 2006;36:437-42.
24) Cho KI, Park JH, Lee CK, et al. Isolated and combined influen- ces of diabetes and hypertension on the myocardial function and geometry. Korean Circ J 2006;36:411-7.
25) Kim MH, Kim MK, Choi BY, Shin YJ. Prevalence of the meta- bolic syndrome and its association with cardiovascular diseases in Korea. J Korean Med Sci 2004;19:195-201.
26) Lee SY, Park HS, Kim DJ, et al. Appropriate waist circumference cutoff points for central obesity in Korean adults. Diabetes Res Clin Pract 2007;75:72-80.