Effect of Lactobacillus sakei, a Probiotic Derived from Kimchi, on Body Fat in Koreans with Obesity:
A Randomized Controlled Study
Soo Lim1, Ji Hye Moon1, Chol Min Shin1, Dahye Jeong2, Bongjoon Kim3
1Department of Internal Medicine, Seoul National University Bundang Hospital, Seoul National University College of Medicine, Seongnam; 2CJ Foods R&D, CJ CheilJedang Corporation; 3CJ CheilJedang Corporation, Suwon, Korea
Background: The increased prevalence of obesity has led to increases in the prevalence of chronic diseases worldwide. There is in- terest whether probiotics have an effect on obesity, but the effectiveness and safety of only a few probiotics for the treatment of obe- sity have been reported. The purpose of this study was to investigate whether ingestion of Lactobacillus sakei (CJLS03) derived from kimchi causes weight loss in people with obesity.
Methods: This randomized, double-blind, placebo-controlled, clinical trial involved 114 adults with a body mass index (BMI) ≥25 kg/m2 who were assigned randomly to a CJLS03 or placebo group. The groups received two allocations of either 5×10⁹ colony- forming units of CJLS03/allocation or the equivalent vehicle for 12 weeks. Demographic and biochemical parameters, and body composition including fat and muscle mass were measured at baseline and after 12 weeks. Changes in body fat, weight, and waist circumference were compared between the two treatment groups. Adverse events were monitored during study period.
Results: Body fat mass decreased by 0.2 kg in the CJLS03 group and increased by 0.6 kg in the placebo group (0.8 kg difference, P=0.018). After the 12 weeks, waist circumference was 0.8 cm smaller in the CJLS03 group than in the placebo group (P=0.013).
BMI and body weight did not change after the 12 weeks. Adverse events were mild and did not differ between the two groups.
Conclusion: These data suggest that L. sakei (CJLS03) might help people with obesity reduce body fat mass without serious side ef- fects (ClinicalTrials.gov: NCT03248414).
Keywords: Lactobacillus sakei; Probiotics; Obesity; Body fat
INTRODUCTION
Over the past 10 years, the prevalence of obesity has been in- creasing steadily not only in Western countries but also in Korea and other Asian countries [1]. This increase in obesity preva- lence is caused mainly by increased energy intake and decreased physical activity levels, and this trend is expected to continue
for some time [2,3]. The increased prevalence of obesity is as- sociated with increased mortality for type 2 diabetes (T2D), hy- pertension, and cardiovascular disease, and the incidence of some cancers [4]. Safe and effective treatment modalities for obesity are scarce and more research is needed.
An association between the microbiome and obesity was first suggested in 2006 [5]. It has been reported that people with obe-
Received: 6 March 2020, Revised: 21 April 2020, Accepted: 15 May 2020 Corresponding author: Soo Lim
Department of Internal Medicine, Seoul National University Bundang Hospital, Seoul National University College of Medicine, 82 Gumi-ro 173beon-gil, Bundang-gu, Seongnam 13620, Korea
Tel: +82-31-787-7035, Fax: +82-31-787-4051, E-mail: [email protected]
Copyright © 2020 Korean Endocrine Society
This is an Open Access article distributed under the terms of the Creative Com- mons Attribution Non-Commercial License (https://creativecommons.org/
licenses/by-nc/4.0/) which permits unrestricted non-commercial use, distribu- tion, and reproduction in any medium, provided the original work is properly cited.
sity have larger numbers of Firmicutes and fewer Bacteroidetes than lean people [6]. Since then, several gut microorganisms have been found to be associated with obesity or leanness [7-9], and gastrointestinal bacterial flora is now considered to contrib- ute to the development of metabolic diseases including obesity and T2D. In one study, the obesity phenotype was reproduced by transplanting feces of people with obesity to germ-free mice, and body weight was reduced by transplanting feces obtained from humans after metabolic surgery to obese mice [10]. The bacterial flora in the gastrointestinal tract has attracted attention as both a cause and treatment target for obesity [11]. More specifically, significant associations between Lactobacillus and body weight have been reported in human studies [12,13]. However, the types of gut microbiota and their exact phylogenetic level at which they can alter body weight are still under investigation.
Lactobacillus sakei is a gram-positive anaerobic bacterium that is commonly found in meat and fish, and is used to ferment meat in the West. It can be stored in fermented foods for a long time, which guarantees its safety [14,15]. The material produced by L. sakei has a beneficial effect by inhibiting the growth of harmful bacteria. In a previous study, body weight and fat mass were reduced significantly by an 8-week intake of L. sakei from Korean kimchi in C57BL/6 mice with high-fat diet-induced obesity (DIO) [14]. Circulating levels of total cholesterol and triglycerides were also decreased in these DIO mice. Adminis- tration of L. sakei may also decrease plasma triglycerides and low-density lipoprotein (LDL) levels [15].
Based on these findings, the aim of this study was to examine whether administration of L. sakei to people with obesity would cause changes in anthropometric and body composition parame- ters such as weight, body mass index (BMI), waist circumfer-
ence, body fat mass, and muscle mass. We also wanted to exam- ine whether L. sakei altered metabolic factors in these people with obesity.
METHODS
Subjects and study design
The study included 114 men and women aged 20 to 65 years with a BMI ≥25 kg/m2 who understood the content of this study and agreed to participate in this clinical trial. Individuals were excluded if they had any of the following exclusion criteria: had received antiobesity medication or antidiabetic medication, such as glucagon-like peptide-1 analogue, thiazolidinedione, or sodi- um-glucose cotransporter-2 inhibitor; had received any medica- tions that might affect body fat mass, such as systemic steroid and antipsychotic medication; had thyroid dysfunction (except where thyroid function was maintained stably without changing the drug dose for >6 months); had a history of malignant tumors within the past 5 years (except for properly treated squamous cell carcinoma, cervical cancer, or thyroid cancer), or were im- munodeficient or taking immunosuppressive medication.
L. sakei is registered in the food raw materials database of the Food and Drug Administration. According to the Technical Law on Biologicals of the German Food Code, L. sakei is registered in the safe classification group, which indicates its safety.
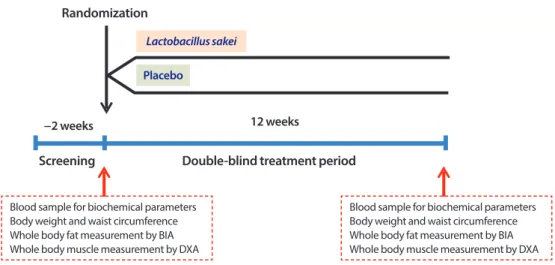
A total of 131 patients were screened for this study; 114 met the inclusion criteria and did not meet the exclusion criteria and were randomized to either the L. sakei (CJLS03) group or pla- cebo group. Participants received daily two allocations of 5×
109 colony-forming units (CFU) of L. sakei/allocation or the equivalent vehicle for 12 weeks (Fig. 1). In this study, a trained
Fig. 1. Study design. BIA, bioelectrical impedance analysis; DXA, dual-energy X-ray absorptiometry.
Randomization
Screening Double-blind treatment period
−2 weeks 12 weeks
Lactobacillus sakei Placebo
Blood sample for biochemical parameters Body weight and waist circumference Whole body fat measurement by BIA Whole body muscle measurement by DXA
Blood sample for biochemical parameters Body weight and waist circumference Whole body fat measurement by BIA Whole body muscle measurement by DXA
research coordinator instructed all participants about achieving a healthy lifestyle, for example, by performing regular exercise
≥3/week with ≥30 minutes for each bout and consuming healthy food. We also encouraged them to maintain this favor- able lifestyle. Good compliance with the treatment was defined as taking 80% to 120% of the allocation.
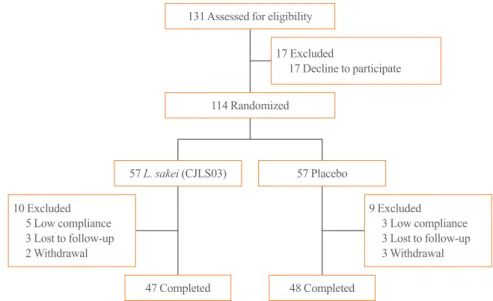
During the study period, 10 participants in the L. sakei group and nine in the placebo group dropped out (Fig. 2). Among those in the L. sakei group who dropped out, five did not meet the cri- teria for medication compliance, three did not visit the research center according to the schedule, and two patients stopped the study without reason. Among the participants who dropped out of the placebo group, three did not meet the criteria for medica- tion compliance, three did not visit the research center according to schedule, and three stopped the study without reason. This study analyzed data according to per-protocol analysis.
This study was conducted according to the management stan- dard of the Ethics Committee of Seoul National University Bundang Hospital (SNUBH). The human application protocol and its changes were also approved by the Ethics Committee of SNUBH (IRB no. B-1511/324-002). This study began after the date of ethical review approval. After listening to detailed ex- planations from the researchers for about 15 minutes, the sub- jects provided written informed consent. This study was regis- tered at the ClinicalTrials.gov (NCT03248414).
Lactobacillus sakei
L. sakei CJLS03 is a lactic acid bacterium derived from kimchi that has long been consumed by humans as a food. This strain
was grown in de Man–Rogosa–Sharpe broth, a specific broth for Lactobacillus (Difco Laboratories, Detroit, MI, USA) and prepared for oral intake. It was grown for 7 hours to reach the late log phase, collected (16,000×g, 5 minutes, 4°C), and washed twice with phosphate-buffered saline. The strain was prepared as a powder about 1×10⁹ CFU/mL.
Primary outcome and secondary outcomes
The primary outcome of this study was the change in fat mass from the baseline to 12 weeks after beginning the treatment.
The key secondary outcomes were changes in BMI, body weight, waist circumference, and muscle mass from the base- line to 12 weeks. Other secondary outcomes were the changes in metabolic parameters from the baseline to 12 weeks.
Assessment of body composition
Body weight and height were measured using standard methods with the subject in light clothing. BMI was calculated as weight (in kg) divided by height (in m) squared. Waist circumference was measured at the umbilical level. Systolic and diastolic blood pressure (SBP/DBP) were measured with an electronic blood pressure meter while the subjects were seated. Blood pressure was measured twice at a 5-minute interval, and the mean value was used in the analysis.
To measure whole-body muscle mass in the study partici- pants, dual-energy X-ray absorptiometry (DXA; Hologic Hori- zon W machine, Hologic Inc., Bedford, MA, USA) was used.
Before the DXA scan, participants were asked to remove all metal objects and to change into a gown. Scanning was per-
Fig. 2. Disposition of the study participants during the study period. L. sakei, Lactobacillus sakei.
131 Assessed for eligibility
114 Randomized
57 L. sakei (CJLS03)
47 Completed
57 Placebo
48 Completed 17 Excluded
17 Decline to participate
9 Excluded 3 Low compliance 3 Lost to follow-up 3 Withdrawal 10 Excluded
5 Low compliance 3 Lost to follow-up 2 Withdrawal
formed with the subject supine, and the scan time was within 15 minutes.
We measured whole-body fat mass using three multifrequen- cy bioelectrical impedance analysis machines (Inbody720, In- Body, Seoul, Korea). The study participants were requested to refrain from smoking, drinking alcohol, and strenuous exercise for 48 hours before the measurement. While in the fasting state, the participant was guided to stand on the platform of the de- vice, age and sex were entered into the machine. After confirm- ing that the participant was standing with both arms apart from the body and both feet on the right spots on the platform, a su- pervisor pushed the start button to perform the assessment.
Measurement of biochemical parameters
The subjects fasted for 12 hours overnight and venous blood samples were taken for biochemistry assays. Plasma glucose concentration was measured using the glucose oxidase method (747 Clinical Chemistry Analyzer, Hitachi, Tokyo, Japan). Gly- cated hemoglobin (HbA1c) level was measured using a Bio- Rad Variant II Turbo HPLC Analyzer (Bio-Rad, Hercules, CA, USA) in a National Glycohemoglobin Standardization Program level II-certified laboratory. Fasting plasma insulin level was measured using a radioimmunoassay (Linco, St. Charles, MO, USA). The homeostasis model assessments of insulin resistance (HOMA-IR) and β-cell function (HOMA-β) were calculated [16].
Aspartate and alanine aminotransferase (AST/ALT) (NADH- UV method), uric acid, blood urea nitrogen (BUN; urease/gluta- mate dehydrogenase method), and creatinine (Jaffe’s kinetic method) were measured using an Architect Ci8200 Analyzer (Abbott Laboratories, Abbott Park, IL, USA). Concentrations of total cholesterol, triglyceride, high-density lipoprotein (HDL)- cholesterol, LDL-cholesterol, and free fatty acids (FFAs) were measured using a 747 Clinical Chemistry Analyzer (Hitachi).
Serum levels of apolipoprotein A1 (ApoA1) and ApoB were measured using an AU5800 instrument (Beckman Coulter, La Brea, CA, USA).
Statistical analysis
No previous studies have reported weight loss in humans after consumption of L. sakei using the same strain as the lactic acid bacteria used in this study. Therefore, the target number of par- ticipants needed was calculated based on the results of a previ- ous study using other strains of Lactobacillus. According to the study by Jung et al. [17], 12 weeks of L. gasseri BNR17 treat- ment resulted in 1.1±2.2 kg of weight loss compared with the
placebo, and an increase of 0.2±2.4 kg in body weight from the baseline. Using these data, we calculated the number of subjects in each group as 60, assuming statistical power of 0.80, two-sid- ed significance level of 0.05, and dropout rate of 10%.
Baseline demographics and clinical data are reported for all subjects as number (percentage) and mean with standard devia- tion. Anthropometric and biochemical parameters at 12 weeks were compared with their baseline values using paired t tests. A paired t test was used to evaluate changes between the baseline and 12 weeks after treatment. We used IBM SPSS Statistics for Windows version 22.0 (IBM Corp., Armonk, NY, USA) and R statistical software v.3.1.1 for Windows (Foundation for Statisti- cal Computing, Vienna, Austria). A P value <0.05 was consid- ered to be significant.
RESULTS
Baseline characteristics
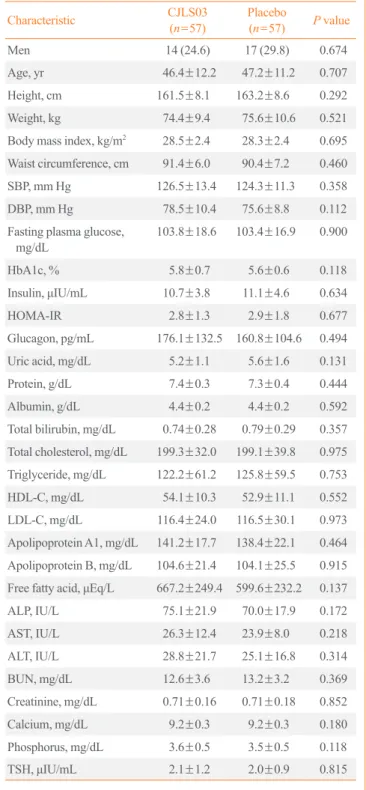
Table 1 provides information about the participants’ baseline characteristics. The sex distribution did not differ significantly between groups: 24.6% (n=14) were men in the L. sakei group and 29.8% (n=17) were men in the placebo group. The mean age was 46.4±12.2 years in the L. sakei group and 47.2±11.2 years in the placebo group. The baseline BMI values were 28.5±2.4 and 28.3±2.4 kg/m2, respectively. The HbA1c level did not differ significantly between groups: 5.8%±0.7% in the L. sakei group and 5.6%±0.6% in the placebo group. Other in- dicators, such as lipid levels and renal and hepatic function markers, did not differ between the two groups. None of the an- thropometric and body composition data, and biochemical pa- rameters differed between the groups.
Participant disposition through the study period and compliance with the medication
Among the 57 participants in each group, 10 participants in the L. sakei group and nine in the placebo group dropped out during the study period (Fig. 2). Among those in the L. sakei group who dropped out, five did not meet the criteria for medication compliance, three did not visit the research center according to the schedule, and two stopped participating in the study without reason. Among the participants who dropped out of the placebo group, three did not meet the criteria for medication compli- ance, three did not visit the research center according to sched- ule, and three stopped participating in the study without reason.
The data in this study were analyzed according to per-protocol analysis.
Primary outcome: change in body fat
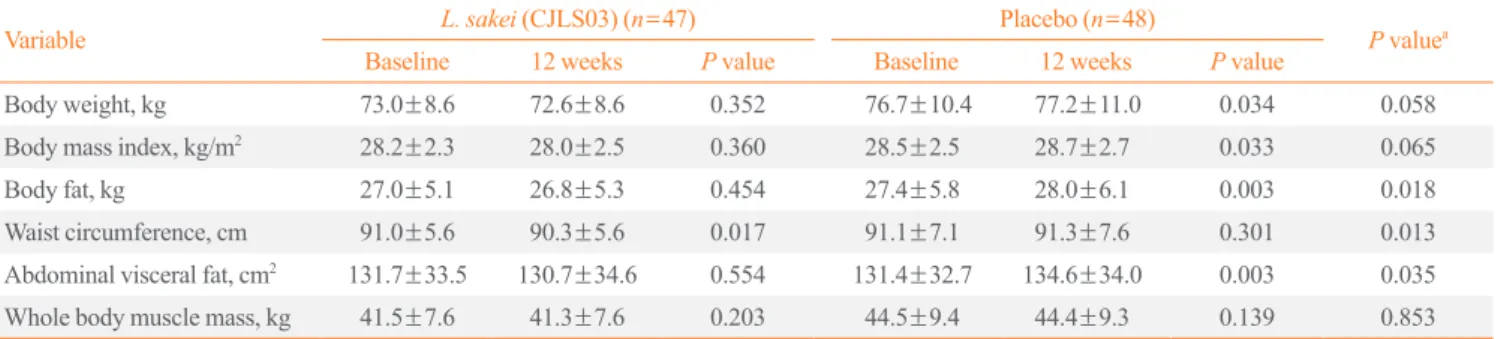
The change in total fat mass, the primary outcome of this study, was calculated as the change in fat mass from the baseline to 12 weeks. Total body fat mass decreased by 0.2 kg in the L. sakei group and increased by 0.6 kg in the placebo group (0.8 kg dif- ference, P=0.018) (Table 2, Fig. 3).
Secondary outcomes
Changes in other anthropometric and body composition parameters
The change in BMI was a secondary outcome measure. BMI decreased by 0.1 kg/m2 in the L. sakei group and increased by 0.2 kg/m2 in the placebo group (0.3 kg/m2 difference, P=0.065) (Table 2, Fig. 3). Body weight decreased by 0.3 kg in the L.
sakei group and increased by 0.5 kg in the placebo group (Table 2). Waist circumference decreased by 0.6 cm in the L. sakei group and increased by 0.2 cm in the placebo group (P=0.013).
The abdominal visceral fat area did not change in the L. sakei group, but increased in the placebo group (Fig. 3), which result- ed in a significant difference in the change in this variable be- tween the groups (Table 2). Muscle mass decreased by 0.24 kg in the L. sakei group and by 0.20 kg in the placebo group.
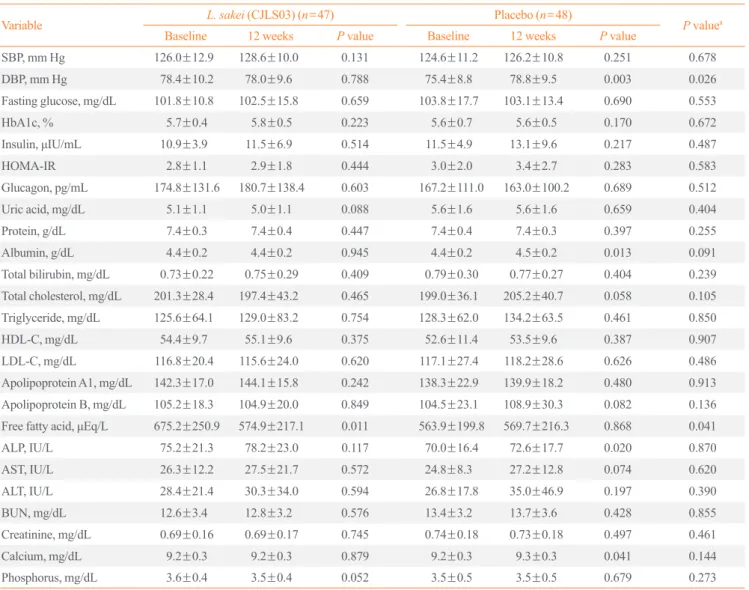
Changes in blood pressure and biochemical parameters
Table 3 shows the metabolic indicators such as measures of blood pressure, blood glucose and lipid levels, liver function, and kidney function at the baseline and after 12 weeks. The change in SBP did not differ significantly between the two groups (–2.6 mm Hg vs. –1.6 mm Hg). DBP did not change sig- nificantly after the 12 weeks in the L. sakei group but increased by 3.5 mm Hg in the placebo group (P=0.026). Fasting blood glucose and HbA1c levels, insulin concentration, and HOMA- IR did not differ significantly between the two groups (Table 3).
The levels of total cholesterol, triglyceride, HDL-cholesterol, LDL-cholesterol, ApoA1, and ApoB did not differ significantly between the two groups. The FFA level decreased significantly in the L. sakei group but did not change in the placebo group;
this resulted in a significant difference between the two groups at 12 weeks (P=0.041). Finally, BUN, creatinine, AST, and ALT levels, and other biochemical parameters did not differ sig- nificantly between groups (Table 3).
Adverse reactions
There were no serious adverse reactions requiring any participant to discontinue use of CJLS03 or hospitalization. Reports of gas- trointestinal discomfort, loose stools, fecal urgency, or flatulence Table 1. Baseline Characteristics in the Lactobacillus sakei
(CJLS03) and Placebo Groups
Characteristic CJLS03
(n=57) Placebo
(n=57) P value
Men 14 (24.6) 17 (29.8) 0.674
Age, yr 46.4±12.2 47.2±11.2 0.707
Height, cm 161.5±8.1 163.2±8.6 0.292
Weight, kg 74.4±9.4 75.6±10.6 0.521
Body mass index, kg/m2 28.5±2.4 28.3±2.4 0.695 Waist circumference, cm 91.4±6.0 90.4±7.2 0.460
SBP, mm Hg 126.5±13.4 124.3±11.3 0.358
DBP, mm Hg 78.5±10.4 75.6±8.8 0.112
Fasting plasma glucose,
mg/dL 103.8±18.6 103.4±16.9 0.900
HbA1c, % 5.8±0.7 5.6±0.6 0.118
Insulin, μIU/mL 10.7±3.8 11.1±4.6 0.634
HOMA-IR 2.8±1.3 2.9±1.8 0.677
Glucagon, pg/mL 176.1±132.5 160.8±104.6 0.494 Uric acid, mg/dL 5.2±1.1 5.6±1.6 0.131
Protein, g/dL 7.4±0.3 7.3±0.4 0.444
Albumin, g/dL 4.4±0.2 4.4±0.2 0.592
Total bilirubin, mg/dL 0.74±0.28 0.79±0.29 0.357 Total cholesterol, mg/dL 199.3±32.0 199.1±39.8 0.975 Triglyceride, mg/dL 122.2±61.2 125.8±59.5 0.753
HDL-C, mg/dL 54.1±10.3 52.9±11.1 0.552
LDL-C, mg/dL 116.4±24.0 116.5±30.1 0.973 Apolipoprotein A1, mg/dL 141.2±17.7 138.4±22.1 0.464 Apolipoprotein B, mg/dL 104.6±21.4 104.1±25.5 0.915 Free fatty acid, μEq/L 667.2±249.4 599.6±232.2 0.137
ALP, IU/L 75.1±21.9 70.0±17.9 0.172
AST, IU/L 26.3±12.4 23.9±8.0 0.218
ALT, IU/L 28.8±21.7 25.1±16.8 0.314
BUN, mg/dL 12.6±3.6 13.2±3.2 0.369
Creatinine, mg/dL 0.71±0.16 0.71±0.18 0.852
Calcium, mg/dL 9.2±0.3 9.2±0.3 0.180
Phosphorus, mg/dL 3.6±0.5 3.5±0.5 0.118
TSH, μIU/mL 2.1±1.2 2.0±0.9 0.815
Values are expressed as number (%) or mean±standard deviation.
SBP, systolic blood pressure; DBP, diastolic blood pressure; HbA1c, glycated hemoglobin; HOMA-IR, homeostasis model assessment of in- sulin resistance; HDL-C, high-density lipoprotein cholesterol; LDL-C, low-density lipoprotein cholesterol; ALP, alkaline phosphatase; AST, aspartate aminotransferase; ALT, alanine aminotransferase; BUN, blood urea nitrogen; TSH, thyroid stimulating hormone.
Table 2. Changes in Body Composition in the Lactobacillus sakei and Placebo Groups after 12 Weeks
Variable L. sakei (CJLS03) (n=47) Placebo (n=48)
P valuea
Baseline 12 weeks P value Baseline 12 weeks P value
Body weight, kg 73.0±8.6 72.6±8.6 0.352 76.7±10.4 77.2±11.0 0.034 0.058
Body mass index, kg/m2 28.2±2.3 28.0±2.5 0.360 28.5±2.5 28.7±2.7 0.033 0.065
Body fat, kg 27.0±5.1 26.8±5.3 0.454 27.4±5.8 28.0±6.1 0.003 0.018
Waist circumference, cm 91.0±5.6 90.3±5.6 0.017 91.1±7.1 91.3±7.6 0.301 0.013
Abdominal visceral fat, cm2 131.7±33.5 130.7±34.6 0.554 131.4±32.7 134.6±34.0 0.003 0.035
Whole body muscle mass, kg 41.5±7.6 41.3±7.6 0.203 44.5±9.4 44.4±9.3 0.139 0.853
Values are expressed as mean±standard deviation.
aP values were calculated using Student’s t test for the difference between groups in the change from the baseline to 12 weeks.
Fig. 3. Differences in (A) body weight, (B) body mass index (BMI), (C) body fat, (D) waist circumference, and (E) abdominal visceral fat area between the Lactobacillus sakei (CJLS03) and placebo groups after 6 and 12 weeks. aP<0.05 for L. sakei vs. placebo.
100 90
80 70 60
50
40
35
30
25
20
200
150
100
50
34 32
30 28 26
24
100
95
90
85
80
Body weight (kg)Body fat (kg)Abdominal visceral fat area (cm) BMI (kg/m2)Waist circumference (cm)
Time (wk)
Time (wk)
Time (wk)
Placebo CJLS03
Placebo CJLS03
Placebo CJLS03
Placebo CJLS03
Placebo CJLS03 Time (wk)
Time (wk) 73.0±8.6
27.0±5.1
131.7±33.5
28.2±2.3
91.0±5.6 76.7±10.4
27.4±5.8
131.4±32.7
28.5±2.5
91.1±7.1 73.2±8.8
27.0±4.9
131.2±32.4
28.2±2.4
90.6±5.8 77.1±10.4
27.7±5.9
132.6±32.9
28.7±2.6
90.9±7.1 72.6±8.6
26.8±5.3
130.7±34.6
28.0±2.5
90.3±5.6 77.2±11.0
28.0±6.1
134.6±34.0
28.7±2.7
91.3±7.6
0 6 12
0 6 12
0 6 12
0 6 12
0 6 12
A
C
E
B
D
a a
did not differ significantly between the two groups (Table 4).
DISCUSSION
In this study, we investigated the effects of 12 weeks of L. sakei (CJLS03) ingestion on fat mass, body weight, BMI, and waist circumference in people with obesity whose baseline BMI was
≥25 kg/m2. Body fat mass differed significantly between the two groups at 12 weeks: that is, body fat mass decreased by 0.2 kg in the L. sakei group but increased by 0.6 kg in the placebo group. Similar trends were seen for body weight, BMI, and
Table 3. Changes in Anthropometric Parameters and Biomarkers in the Lactobacillus sakei and Placebo Groups after 12 Weeks
Variable L. sakei (CJLS03) (n=47) Placebo (n=48)
P valuea
Baseline 12 weeks P value Baseline 12 weeks P value
SBP, mm Hg 126.0±12.9 128.6±10.0 0.131 124.6±11.2 126.2±10.8 0.251 0.678
DBP, mm Hg 78.4±10.2 78.0±9.6 0.788 75.4±8.8 78.8±9.5 0.003 0.026
Fasting glucose, mg/dL 101.8±10.8 102.5±15.8 0.659 103.8±17.7 103.1±13.4 0.690 0.553
HbA1c, % 5.7±0.4 5.8±0.5 0.223 5.6±0.7 5.6±0.5 0.170 0.672
Insulin, μIU/mL 10.9±3.9 11.5±6.9 0.514 11.5±4.9 13.1±9.6 0.217 0.487
HOMA-IR 2.8±1.1 2.9±1.8 0.444 3.0±2.0 3.4±2.7 0.283 0.583
Glucagon, pg/mL 174.8±131.6 180.7±138.4 0.603 167.2±111.0 163.0±100.2 0.689 0.512
Uric acid, mg/dL 5.1±1.1 5.0±1.1 0.088 5.6±1.6 5.6±1.6 0.659 0.404
Protein, g/dL 7.4±0.3 7.4±0.4 0.447 7.4±0.4 7.4±0.3 0.397 0.255
Albumin, g/dL 4.4±0.2 4.4±0.2 0.945 4.4±0.2 4.5±0.2 0.013 0.091
Total bilirubin, mg/dL 0.73±0.22 0.75±0.29 0.409 0.79±0.30 0.77±0.27 0.404 0.239
Total cholesterol, mg/dL 201.3±28.4 197.4±43.2 0.465 199.0±36.1 205.2±40.7 0.058 0.105
Triglyceride, mg/dL 125.6±64.1 129.0±83.2 0.754 128.3±62.0 134.2±63.5 0.461 0.850
HDL-C, mg/dL 54.4±9.7 55.1±9.6 0.375 52.6±11.4 53.5±9.6 0.387 0.907
LDL-C, mg/dL 116.8±20.4 115.6±24.0 0.620 117.1±27.4 118.2±28.6 0.626 0.486
Apolipoprotein A1, mg/dL 142.3±17.0 144.1±15.8 0.242 138.3±22.9 139.9±18.2 0.480 0.913 Apolipoprotein B, mg/dL 105.2±18.3 104.9±20.0 0.849 104.5±23.1 108.9±30.3 0.082 0.136 Free fatty acid, μEq/L 675.2±250.9 574.9±217.1 0.011 563.9±199.8 569.7±216.3 0.868 0.041
ALP, IU/L 75.2±21.3 78.2±23.0 0.117 70.0±16.4 72.6±17.7 0.020 0.870
AST, IU/L 26.3±12.2 27.5±21.7 0.572 24.8±8.3 27.2±12.8 0.074 0.620
ALT, IU/L 28.4±21.4 30.3±34.0 0.594 26.8±17.8 35.0±46.9 0.197 0.390
BUN, mg/dL 12.6±3.4 12.8±3.2 0.576 13.4±3.2 13.7±3.6 0.428 0.855
Creatinine, mg/dL 0.69±0.16 0.69±0.17 0.745 0.74±0.18 0.73±0.18 0.497 0.461
Calcium, mg/dL 9.2±0.3 9.2±0.3 0.879 9.2±0.3 9.3±0.3 0.041 0.144
Phosphorus, mg/dL 3.6±0.4 3.5±0.4 0.052 3.5±0.5 3.5±0.5 0.679 0.273
Values are expressed as mean±standard deviation. P values were calculated using paired t tests between the baseline and after 12 weeks.
SBP, systolic blood pressure; DBP, diastolic blood pressure; HbA1c, glycated hemoglobin; HOMA-IR, homeostasis model assessment of insulin resis- tance; HDL-C, high-density lipoprotein cholesterol; LDL-C, low-density lipoprotein cholesterol; ALP, alkaline phosphatase; AST, aspartate aminotrans- ferase; ALT, alanine aminotransferase; BUN, blood urea nitrogen.
aP values were calculated using Student’s t test for the difference between groups in the change from the baseline to 12 weeks.
Table 4. Gastrointestinal Symptoms Reported by the Lactoba- cillus sakei (CJLS03) and Placebo Groups
Variable L. sakei
(CJLS03) (n=47)
Placebo
(n=48) P value Gastrointestinal discomfort 15 (31.9) 13 (27.1) 0.657 Loose stools 18 (38.3) 18 (37.5) 1.000 Fecal urgency 17 (36.2) 17 (35.4) 1.000
Flatulence 17 (36.2) 17 (35.4) 1.000
Values are expressed as number (%).
waist circumference in the L. sakei group.
Scientific evidence supports the idea that consumed food changes the human gut microbiota profile and that dietary pat- terns are important in the association between the gut microbio- ta and obesity progression [18-20]. Furthermore, changes in the composition and activity of the gut microbiota may contribute to alterations in body weight and composition [21,22].
Several studies that investigated whether Lactobacillus spp., including L. rhamnosus, L. casei, and L. plantarum have an an- tiobesity effect [12,13]. Administration of these lactic acid bac- teria species has been reported to cause a 5% of weight loss be- cause of appetite suppression, which decreased dietary intake and to slow the rate of weight gain after consumption of a high fat diet [23]. However, weight loss has not been reported after short-term administration in humans, and the long-term effects have not been confirmed.
Several studies have investigated the antiobesity effects of L.
gasseri [24,25]. A study of Koreans showed that administration of L. gasseri to 62 Korean adults with BMI >23 kg/m2 and fast- ing blood glucose level >100 mg/dL for 12 weeks decreased body weight, although body weight did not differ significantly from that of the placebo group [24]. Another study in Koreans with BMI >25 kg/m2 and waist circumference >85 cm reported no differences in body weight and waist circumference between after adding probiotics and placebo in addition to treatment with a herbal medicine [26]. A meta-analysis that combined 15 stud- ies with probiotics found changes in body weight and body fat in obese people with BMI >25 kg/m2: that is, the average weight and BMI lost were 0.6 kg and 0.27 kg/m2, but body fat level did not decrease significantly [2].
Another study investigated the effects of three strains of L.
sakei (CJLS03, CJB38, and CJB46) on weight and biochemical parameters in a C57BL/6 mouse model of DIO [15]. After 7 weeks of treatment, three strains were found to reduce the gain in weight compared with the control group. Administration of L.
sakei (CJLS03) was accompanied by decreases in the levels of triglycerides, AST, and LDL [15]. The high dose of CJLS03 (1×10¹⁰ CFU/day) had the greatest effects on the changes in weight and biomarkers related to cardiometabolic risk com- pared with the high-fat-fed control group. Based on these re- sults, we chose to use the CJLS03 strain for our human study.
In our study, administration of L. sakei (CJLS03) to people with obesity with basal BMI ≥25 kg/m2 led to reduction in fat mass, body weight, BMI, and waist circumference. L. sakei is a gram-positive anaerobic bacterium that is used mainly to fer- ment meat [14,15]. In a previous study, treatment of L. sakei for
8 weeks significantly decreased body weight in high-fat-fed mice [14]. The L. sakei CJLS03-treated group showed a signifi- cant fat reduction in the mesenteric, epididymal, and subcutane- ous adipose tissues. Notably, L. sakei supplementation signifi- cantly reduced the average size of adipocytes in the epididymal, subcutaneous, and mesenteric tissues [15].
The fat-reducing effect of L. sakei in our study was not as ro- bust as in animal studies. This may partly reflect interindividual variations in the gut microbiota and metabolic activity in hu- mans with age, diet, use of antibiotics, genetics, and other envi- ronmental factors [27]. Data from the Human Microbiome Proj- ect and the Metagenomics of the Human Intestinal Tract project show that these variables may be more critical than the actual differences between the lean and obese phenotypes [28,29]. We note that previous studies of obesity have reported weight gains in the placebo control groups. Similarly, the loss of body weight in the L. sakei-administered group in our study was not impres- sive, but this resulted in a 0.8 kg difference in body weight after 12 weeks.
The mechanisms underlying the role of gut microbiota in the etiology of obesity have been proposed [30]. The energy-har- vesting capability of the gut microbiota in obese people is thought to be set at a higher threshold than in lean people. Peo- ple with obesity have higher short-chain fatty acid (SCFA) lev- els in their fecal samples than lean adults [31]. SCFAs are ab- sorbed by the intestinal cells by passive diffusion and monocar- boxylic acid transporters such as monocarboxylate transporter 1.
SCFAs have substantial metabolic roles. For instance, acetate is a precursor for lipogenesis [32], propionate is a substrate neces- sary for gluconeogenesis [33] and reduces food intake and cho- lesterol synthesis [32], and butyrate is involved in cell growth and differentiation [34].
Several mechanisms may be proposed to explain how admin- istration of L. sakei can induce weight loss. In a study that used the same strain of microbiota as our study, significantly elevated SCFA levels were detected in fecal and serum samples of the mice fed with L. sakei [15]. Butyrate is known to protect against DIO without causing hypophagia, reduces insulin resistance in mice [35], and has anti-inflammatory properties in humans [32].
Another possible mechanism for the beneficial effects of L.
sakei is the inhibition of the production of lipopolysaccharide and induction of the expression of tight junction protein in the intestine [14]. The gut microbiota also affects appetite control and energy balance [36]. The capacity for receiving energy from food is higher in the gut microbiota in people with obesity than in lean people [37].
During the 12 weeks of administration of L. sakei (CJLS03) or placebo, we observed no clinically significant side effects.
The compliance in both groups was >95%, which supports the idea that L. sakei, a lactic acid bacterium derived from kimchi, is safe.
Our study has strengths and limitations. This was a well-de- signed randomized controlled study with a high adherence rate.
Highly purified and sufficient amounts of the bacteria were used. However, we did not investigate possible alterations in the microbiota in the participants. Modulation of the intestinal mi- crobiota and SCFA composition by L. sakei CJLS03 treatment was reported in a previous study [15]. The 12 weeks of treat- ment may not have been long enough to causes significant changes in body fat and weight. Further studies are needed to determine whether the viability of L. sakei CJLS03 is main- tained in the lower gastrointestinal tract and whether supple- mentation alters the intestinal environment and other intestinal flora.
In conclusion, in this randomized, double-blind clinical trial, administration of L. sakei (CJLS03) led to significant reductions in total fat mass and waist circumference, and borderline trends for reductions in BMI and body weight. These data suggest that L. sakei (CJLS03) may be a good auxiliary candidate as a mi- crobiome-targeted therapy for obesity prevention and treatment.
CONFLICTS OF INTEREST
This study was supported by a research grant from the CJ Foods R&D, CJ CheilJedang Corporation, Suwon, Korea and by the Korean Endocrine Society of Endocrinology and Metabolism Research Award 2019. The funders had no role in study design, data collection and analysis, or preparation of the manuscript.
ACKNOWLEDGMENTS
We thank Dr. Tae Jung Oh for her support in the initial step.
AUTHOR CONTRIBUTIONS
Conception or design: S.L. Acquisition, analysis, or interpreta- tion of data: S.L., J.H.M., D.J., B.K. Drafting the work: S.L. Fi- nal approval of the manuscript: S.L., J.H.M., C.M.S., D.J., B.K.
ORCID
Soo Lim https://orcid.org/0000-0002-4137-1671
REFERENCES
1. NCD Risk Factor Collaboration (NCD-RisC). Worldwide trends in body-mass index, underweight, overweight, and obesity from 1975 to 2016: a pooled analysis of 2416 popu- lation-based measurement studies in 128·9 million children, adolescents, and adults. Lancet 2017;390:2627-42.
2. Borgeraas H, Johnson LK, Skattebu J, Hertel JK, Hjelmesa- eth J. Effects of probiotics on body weight, body mass in- dex, fat mass and fat percentage in subjects with overweight or obesity: a systematic review and meta-analysis of ran- domized controlled trials. Obes Rev 2018;19:219-32.
3. Church T, Martin CK. The obesity epidemic: a consequence of reduced energy expenditure and the uncoupling of energy intake? Obesity (Silver Spring) 2018;26:14-6.
4. Bhaskaran K, Dos-Santos-Silva I, Leon DA, Douglas IJ, Smeeth L. Association of BMI with overall and cause-spe- cific mortality: a population-based cohort study of 3·6 mil- lion adults in the UK. Lancet Diabetes Endocrinol 2018;6:
944-53.
5. Ley RE, Turnbaugh PJ, Klein S, Gordon JI. Microbial ecol- ogy: human gut microbes associated with obesity. Nature 2006;444:1022-3.
6. Human Microbiome Project Consortium. Structure, function and diversity of the healthy human microbiome. Nature 2012;486:207-14.
7. Million M, Maraninchi M, Henry M, Armougom F, Richet H, Carrieri P, et al. Obesity-associated gut microbiota is en- riched in Lactobacillus reuteri and depleted in Bifidobacteri- um animalis and Methanobrevibacter smithii. Int J Obes (Lond) 2012;36:817-25.
8. Miele L, Giorgio V, Alberelli MA, De Candia E, Gasbarrini A, Grieco A. Impact of gut microbiota on obesity, diabetes, and cardiovascular disease risk. Curr Cardiol Rep 2015;17:
120.
9. Castaner O, Goday A, Park YM, Lee SH, Magkos F, Shiow STE, et al. The gut microbiome profile in obesity: a system- atic review. Int J Endocrinol 2018;2018:4095789.
10. Fontane L, Benaiges D, Goday A, Llaurado G, Pedro-Botet J. Influence of the microbiota and probiotics in obesity. Clin Investig Arterioscler 2018;30:271-9.
11. Amabebe E, Robert FO, Agbalalah T, Orubu ESF. Microbial dysbiosis-induced obesity: role of gut microbiota in homoeo- stasis of energy metabolism. Br J Nutr 2020;123:1127-37.
12. Sanchez M, Darimont C, Drapeau V, Emady-Azar S, Lepage M, Rezzonico E, et al. Effect of Lactobacillus rhamnosus
CGMCC1.3724 supplementation on weight loss and mainte- nance in obese men and women. Br J Nutr 2014;111:1507- 19.
13. Nagata S, Chiba Y, Wang C, Yamashiro Y. The effects of the Lactobacillus casei strain on obesity in children: a pilot study. Benef Microbes 2017;8:535-43.
14. Ji Y, Chung YM, Park S, Jeong D, Kim B, Holzapfel WH.
Dose-dependent and strain-dependent anti-obesity effects of Lactobacillus sakei in a diet induced obese murine model.
PeerJ 2019;7:e6651.
15. Ji Y, Park S, Chung Y, Kim B, Park H, Huang E, et al. Ame- lioration of obesity-related biomarkers by Lactobacillus sakei CJLS03 in a high-fat diet-induced obese murine mod- el. Sci Rep 2019;9:6821.
16. Matthews DR, Hosker JP, Rudenski AS, Naylor BA, Treach- er DF, Turner RC. Homeostasis model assessment: insulin resistance and beta-cell function from fasting plasma glucose and insulin concentrations in man. Diabetologia 1985;28:
412-9.
17. Jung SP, Lee KM, Kang JH, Yun SI, Park HO, Moon Y, et al. Effect of Lactobacillus gasseri BNR17 on overweight and obese adults: a randomized, double-blind clinical trial.
Korean J Fam Med 2013;34:80-9.
18. Kim B, Choi HN, Yim JE. Effect of diet on the gut microbio- ta associated with obesity. J Obes Metab Syndr 2019;28:216- 24.
19. Walker AW, Ince J, Duncan SH, Webster LM, Holtrop G, Ze X, et al. Dominant and diet-responsive groups of bacteria within the human colonic microbiota. ISME J 2011;5:220- 30.
20. Maruvada P, Leone V, Kaplan LM, Chang EB. The human microbiome and obesity: moving beyond associations. Cell Host Microbe 2017;22:589-99.
21. De Filippis F, Pellegrini N, Vannini L, Jeffery IB, La Storia A, Laghi L, et al. High-level adherence to a Mediterranean diet beneficially impacts the gut microbiota and associated metabolome. Gut 2016;65:1812-21.
22. Lee G, Han JH, Maeng HJ, Lim S. Three-month daily con- sumption of sugar-sweetened beverages affects the liver, adi- pose tissue, and glucose metabolism. J Obes Metab Syndr 2020;29:26-38.
23. Lee E, Jung SR, Lee SY, Lee NK, Paik HD, Lim SI. Lacto- bacillus plantarum strain ln4 attenuates diet-induced obesity, insulin resistance, and changes in hepatic mRNA levels as- sociated with glucose and lipid metabolism. Nutrients 2018;
10:643.
24. Kim J, Yun JM, Kim MK, Kwon O, Cho B. Lactobacillus gasseri BNR17 supplementation reduces the visceral fat ac- cumulation and waist circumference in obese adults: a ran- domized, double-blind, placebo-controlled trial. J Med Food 2018;21:454-61.
25. Ogawa A, Kadooka Y, Kato K, Shirouchi B, Sato M. Lacto- bacillus gasseri SBT2055 reduces postprandial and fasting serum non-esterified fatty acid levels in Japanese hypertria- cylglycerolemic subjects. Lipids Health Dis 2014;13:36.
26. Lee SJ, Bose S, Seo JG, Chung WS, Lim CY, Kim H. The effects of co-administration of probiotics with herbal medi- cine on obesity, metabolic endotoxemia and dysbiosis: a randomized double-blind controlled clinical trial. Clin Nutr 2014;33:973-81.
27. Delzenne NM, Neyrinck AM, Backhed F, Cani PD. Target- ing gut microbiota in obesity: effects of prebiotics and pro- biotics. Nat Rev Endocrinol 2011;7:639-46.
28. Finucane MM, Sharpton TJ, Laurent TJ, Pollard KS. A taxo- nomic signature of obesity in the microbiome? Getting to the guts of the matter. PLoS One 2014;9:e84689.
29. Qin J, Li R, Raes J, Arumugam M, Burgdorf KS, Manichanh C, et al. A human gut microbial gene catalogue established by metagenomic sequencing. Nature 2010;464:59-65.
30. Khan MJ, Gerasimidis K, Edwards CA, Shaikh MG. Role of gut microbiota in the aetiology of obesity: proposed mechanisms and review of the literature. J Obes 2016;2016:
7353642.
31. Fernandes J, Su W, Rahat-Rozenbloom S, Wolever TM, Co- melli EM. Adiposity, gut microbiota and faecal short chain fatty acids are linked in adult humans. Nutr Diabetes 2014;
4:e121.
32. Chakraborti CK. New-found link between microbiota and obesity. World J Gastrointest Pathophysiol 2015;6:110-9.
33. Davis CD. The gut microbiome and its role in obesity. Nutr Today 2016;51:167-74.
34. Carvalho BM, Saad MJ. Influence of gut microbiota on sub- clinical inflammation and insulin resistance. Mediators In- flamm 2013;2013:986734.
35. Gao Z, Yin J, Zhang J, Ward RE, Martin RJ, Lefevre M, et al. Butyrate improves insulin sensitivity and increases ener- gy expenditure in mice. Diabetes 2009;58:1509-17.
36. van de Wouw M, Schellekens H, Dinan TG, Cryan JF. Mi- crobiota-gut-brain axis: modulator of host metabolism and appetite. J Nutr 2017;147:727-45.
37. Mitev K, Taleski V. Association between the gut microbiota and obesity. Open Access Maced J Med Sci 2019;7:2050-6.