D I A B E T E S & M E T A B O L I S M J O U R N A L
This is an Open Access article distributed under the terms of the Creative Commons At- tribution Non-Commercial License (http://creativecommons.org/licenses/by-nc/3.0/) which permits unrestricted non-commercial use, distribution, and reproduction in any medium, provided the original work is properly cited.
Increasing Prevalence of Type 2 Diabetes in a Rural Bangladeshi Population: A Population Based Study for 10 Years
Bishwajit Bhowmik1, Faria Afsana2, Lien My Diep1,3, Sanjida Binte Munir4, Erica Wright5, Sharif Mahmood6, A. K. Azad Khan2, Akhtar Hussain1
1Department of Community Medicine, Institute of Health and Society, University of Oslo Faculty of Medicine, Oslo, Norway,
2Department of Endocrinology, Bangladesh Institute of Research and Rehabilitation in Diabetes, Endocrine and Metabolic Disorders (BIRDEM), Dhaka, Bangladesh,
3Unit for Biostatistics and Epidemiology, Oslo University Hospital, Oslo, Norway,
4Executive Diabetes Care Centre, NHN, Diabetic Association of Bangladesh, Dhaka, Bangladesh,
5ACT Diabetes Service, Division of Medicine, Canberra Hospital, Canberra, Australia,
6Institutes of Statistical Research and Training, University of Dhaka, Dhaka, Bangladesh
Background: To observe changes in the prevalence of type 2 diabetes mellitus (DM) and impaired fasting glucose (IFG) and its associated risk factors in a rural Bangladeshi population over a 10-year period.
Methods: Three cross-sectional studies were undertaken in a rural community (aged ≥20 years) in 1999, 2004, and 2009. Struc- tured questionnaires including sociodemographic parameters, anthropometric measurements, blood pressure, and blood glu- cose values were recorded. DM and IFG were diagnosed using 1999 World Health Organization criteria.
Results: Age standardized prevalence of DM increased significantly (P<0.001) from 1999 to 2009 (2.3%, 6.8%, and 7.9% in 1999, 2004, and 2009, respectively). The prevalence of IFG increased significantly (P=0.011) from 4.6% to 5.8% between 1999 and 2004 but then decreased from 5.8% to 5.3% during 2004 to 2009. Significant linear trends were shown in both sexes for general and central obesity as indicated by body mass index, waist circumference, and waist hip ratio (WHR). Increasing age and systolic blood pressure were significant risk factors for DM in all three studies. WHR for males was also significantly associated with the risk of DM in all three studies. WHR for females was only significantly associated with DM in 2009.
Conclusion: A significant rise in the prevalence of DM was observed in this population over 10 years. This increase was seen in both sexes, and in all age groups. A significant increase in the prevalence of the associated risk factors of general and central obe- sity was observed in both sexes.
Keywords: Bangladesh; Diabetes mellitus; Impaired fasting glucose; Population based study; Prevalence
Corresponding author: Bishwajit Bhowmik
Department of Community Medicine, Institute of Health and Society, University of Oslo Faculty of Medicine, P.O. Box 1130, Blindern, N-0317 Oslo, Norway
E-mail: [email protected]
INTRODUCTION
The prevalence of diabetes mellitus (DM) continues to increase worldwide, especially in Asia [1]. In 2010, an estimated 140 million people living in Asia had DM and globally 60% of the people with DM were of Asian descent [2]. In addition, to a possible genetic predisposition, other environmental factors,
have been identified as contributing to the DM epidemic in Asia. These includes rapid socioeconomic change, urbaniza- tion, sedentary lifestyle, and changes in dietary patterns. Re- cent epidemiological studies have shown an increased preva- lence of DM in India (12.1%), Pakistan (11.1%), and China (6.1%) [3-5]. In recent years, Bangladesh has experienced rap- id urbanization [6,7]. A number of population based studies http://dx.doi.org/10.4093/dmj.2013.37.1.46
pISSN 2233-6079 · eISSN 2233-6087
conducted in Bangladesh have revealed an increasing preva- lence of DM in both rural and urban populations [8-10]. How- ever, there are major limitations in understanding the tempo- ral changes in the prevalence of DM in Bangladesh from these studies due to the different study populations, methodologies, and the times at which the studies were conducted. In 1999, 2004 and 2009, we conducted three consecutive cross-section- al studies in an area called Chandra, located approximately 40 km from Dhaka, the capital of Bangladesh. These studies aimed to evaluate and compare the temporal change in the prevalence of diabetes, and, identify associated risk factors in a rural area of Bangladesh.
METHODS
The same methodology was applied in the same population in the three studies. Each study participant was allocated a unique identification number which included their household number.
Study area and population
In 1999, the demographic and social characteristic profile of the general population of Chandra, was described as rural, without urban facilities. The main livelihood of the population was agricultural and other agrarian activities. Ten villages were randomly selected from five areas. The total population of these villages was approximately 20,000 aged ≥20 years. Dur- ing the recruitment period all persons aged ≥20 years, willing to participate and able to communicate were included in the study. Pregnant women and those with a diagnosed acute physical or mental illness were excluded. Description of the population and recruitment process were described earlier in brief [10]. In 1999, 5,000 subjects were recruited and of these 4,757 (95%) agreed to participate. In 2004, 5,000 subjects were again recruited and of these 3,981 (80%) subjects participated.
In 2009, 3,000 of same age group subjects were randomly se- lected and among them 2,376 (79.2%) participated. After ex- clusion of 83 participants with missing glucose values, 2,293 participants were included for the analysis.
Ethics
Verbal consent was obtained from each participant prior to their inclusion in the study as the majority of participants were illiterate. This procedure was adopted to avoid selection bias and individual discrimination. Information, explaining the
study objectives and protocol were read aloud to the partici- pants, including, their right to refuse and withdraw at any stage of the study or to exclude their data from analyses. The protocol was approved by the Norwegian National Committee for Medical and Health Research Ethics and the Ethical Re- view Committee of the Diabetic Association of Bangladesh.
Diabetes survey and data collection
On completion of the selection procedure, participants were requested to visit a nearby field centre. In the 1999 and 2004 studies, capillary whole blood was used to measure the fasting blood glucose (FBG) after an overnight fast of 8 to 12 hours, using a Hemocue blood glucose analyzer. Internal quality con- trol tests were conducted each day, using recommended glu- cose solutions, to ensure accuracy and reliability of the results.
DM and impaired fasting glucose (IFG) were diagnosed using World Health Organization (WHO) criteria [11]. Diagnosis of DM was made if the FBG was ≥6.1 mmol/L. IFG was diag- nosed if the FBG was between ≥5.6 to <6.1 mmol/L. In 2009, venous plasma glucose (VPG) samples were collected on the morning following an overnight fast. DM was diagnosed if the FBG value was ≥7.0 mmol/L. IFG was diagnosed if the FBG was between ≥6.1 to <7.0 mmol/L [11]. In addition, known DM was defined by the use insulin or oral antidiabetic medication(s) and self-reported DM. VPG samples were col- lected in a tube containing sodium fluoride and were centri- fuged on site within 30 minutes of collection. Separated plas- ma samples were sent to the Bangladesh Institute of Research and Rehabilitation in Diabetes, Endocrine and Metabolic Dis- orders (BIRDEM) in ice gel packed cooling boxes and stored at minus 70°C until laboratory assays. Plasma glucose was measured by the glucose oxidase method using Dimension RxL Max (Siemens AG, Erlangen, Germany) on the same day.
In the 2009 study, quality control on the blood glucose mea- surement was checked by measuring the fasting plasma glu- cose values using the glucose oxidase method in every 10th sample. The intra-assay coefficient of variation was 1.24% at a mean of 5.86 mmol/L, and the inter-assay coefficient of varia- tion was 2.10% at a mean of 5.23 mmol/L. The correlation be- tween capillary whole blood (using point of care meter) and venous plasma blood was calculated using Pearson’s correla- tion methods (r=0.94, P<0.001). All study participants were informed of their glucose tolerance status as soon as the re- sults were available.
Interview
Socioeconomic and demographic information, parental and personal health history were verbally obtained using stan- dardised questionnaires and anthropometric measurements were recorded. These were carried out through trained re- searchers.
Measurements of height, weight, and waist circumference (WC), and hip circumference (HC) were taken with partici- pants in light clothes and without shoes. For height, the par- ticipant stood erect against a wall, with the occiput, back, hip, and heels in contact with the wall while looking straight ahead and keeping the tragus and lateral orbital margin in the same horizontal plane. WC was measured by placing a plastic tape horizontally midway between 12th rib and iliac crest on the midaxillary line. Similarly, HC was measured by placing the tape measure at the level of maximum posterior extension of the buttocks and horizontal around the body. Body mass in- dex (BMI) was calculated as weight divided by height squared (kg/m2). Obesity was defined as a BMI of 25 kg/m2 or greater for Asian Indians [12,13]. Central obesity indicated by WC
≥90 cm for male and ≥80 cm for female and waist hip ratio (WHR) ≥0.90 for male, ≥0.80 for female. Blood pressure (BP) was measured by 1) ensuring the participant rested for 10 minutes prior to the BP being measured, 2) using standard cuffs for adults fitted with a standard mercury sphygmoma- nometer, and 3) placing the stethoscope bell lightly over the pulsatile brachial artery on the right arm. The average of two BP readings taken at a 5-minute interval in both sitting and standing positions was recorded. Hypertension (HTN) was defined as a systolic BP (SBP) of ≥140 mm Hg and/or diastolic BP (DBP) of ≥90 mm Hg or diagnosed HTN by a physician prior to the survey and reported regular in place of daily use of antihypertensive medication(s).
Statistical analysis
All the continuous variables were presented as mean (95%
confidence interval [CI]) and categorical data as percentage (95% CI). Differences between the three study cohorts of means and proportions adjusted for age was tested by analysis of covariance (ANCOVA) and logistic regression respectively.
Multiple comparisons were performed using the Bonferroni method. The prevalence of DM and IFG were age standardised by the direct standardization method. Age standardised preva- lence was estimated on the basis of 1991 census data adjusted in 2000 for all three surveys [14]. Multiple logistic regression
models were used to test for linear trends in the age standardised prevalence and estimate adjusted odds ratios with 95% CIs for all three studies. Two-sided P values were given and the signif- icance level was set at 0.05. STATA 11 for Windows (STATA Co., College Station, TX, USA) was used to estimate the age standardized prevalence and creating the figures. Otherwise PASW statistics version 18 for Windows (SPSS Inc., Chicago, IL, USA) was used.
RESULTS
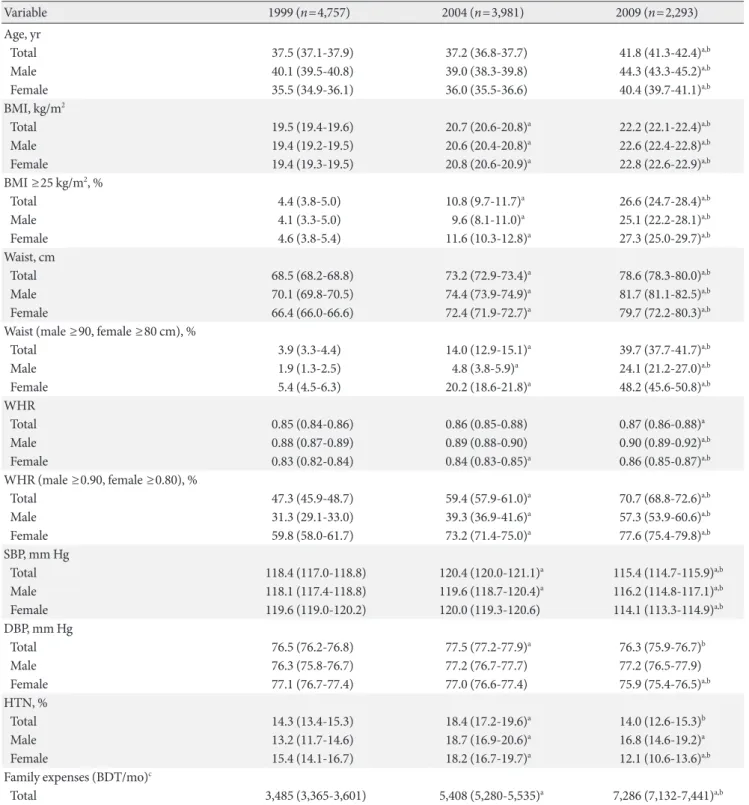
Table 1 shows the population characteristics of the three stud- ies. The mean values and 95% CIs for age, BMI, WHR, WC in- creased significantly in both sexes (Table 1). A small mean re- duction was observed for both SBP and DBP in 2009. There was a significant time-related change in the prevalence of gen- eral obesity indicated by BMI of ≥25 kg/m2 (P<0.001) and central obesity indicated by WC (male ≥90, female ≥80 cm) (P<0.001) and WHR (male ≥0.90, female ≥0.80) (P<0.001) in 2009 compared to 1999 and 2004. The prevalence of obesity was higher in females than males in all three studies. Preva- lence of HTN increased 22.3% from 1999 (14.3%) to 2004 (18.4%) but decreased by 23.9% from 2004 to 2009 (14.0%).
Fig. 1 shows the age and sex standardised prevalence of DM and IFG. The prevalence of DM in the study population was higher in 2009 compared to 1999 and 2004. The prevalence of DM increased 66% (from 2.3% to 6.8% during 1999 to 2004) and a further increase of 14% (from 6.8% to 7.9% during 2004 to 2009). The trend was statistically significant for DM (linear trend, P<0.001) in both sexes (linear trend, P<0.001). The prevalence of IFG increased 21% in the 5 years between the first two studies, from 4.6% (95% CI, 4.0%, 5.2%) to 5.8% (95%
CI, 5.1%, 6.5%) but decreased 9% from 5.8% (95% CI, 5.1%, 6.5%) to 5.3% (95% CI, 4.4%, 6.2%) during 2004 to 2009. IFG among males showed a significant linear increasing trend (P=
0.031). Female participants had a higher prevalence of DM and IFG in 1999 and 2004. Male participants had a higher prevalence of DM in 2009 with an associated higher preva- lence of IFG. The prevalence of DM and IFG increased with age in both sexes in each of the studies.
Table 2 shows the association of risk factors with DM in the three studies. Increasing age and SBP were found to be signifi- cant risk factors for the occurrence of DM after controlling for potential confounders in all three studies. The increase in BMI was associated with increased prevalence of DM in 2004 and
Table 1. Details of population characteristics of 1999, 2004, and 2009 surveys
Variable 1999 (n=4,757) 2004 (n=3,981) 2009 (n=2,293)
Age, yr
Total 37.5 (37.1-37.9) 37.2 (36.8-37.7) 41.8 (41.3-42.4)a,b
Male 40.1 (39.5-40.8) 39.0 (38.3-39.8) 44.3 (43.3-45.2)a,b
Female 35.5 (34.9-36.1) 36.0 (35.5-36.6) 40.4 (39.7-41.1)a,b
BMI, kg/m2
Total 19.5 (19.4-19.6) 20.7 (20.6-20.8)a 22.2 (22.1-22.4)a,b
Male 19.4 (19.2-19.5) 20.6 (20.4-20.8)a 22.6 (22.4-22.8)a,b
Female 19.4 (19.3-19.5) 20.8 (20.6-20.9)a 22.8 (22.6-22.9)a,b
BMI ≥25 kg/m2, %
Total 4.4 (3.8-5.0) 10.8 (9.7-11.7)a 26.6 (24.7-28.4)a,b
Male 4.1 (3.3-5.0) 9.6 (8.1-11.0)a 25.1 (22.2-28.1)a,b
Female 4.6 (3.8-5.4) 11.6 (10.3-12.8)a 27.3 (25.0-29.7)a,b
Waist, cm
Total 68.5 (68.2-68.8) 73.2 (72.9-73.4)a 78.6 (78.3-80.0)a,b
Male 70.1 (69.8-70.5) 74.4 (73.9-74.9)a 81.7 (81.1-82.5)a,b
Female 66.4 (66.0-66.6) 72.4 (71.9-72.7)a 79.7 (72.2-80.3)a,b
Waist (male ≥90, female ≥80 cm), %
Total 3.9 (3.3-4.4) 14.0 (12.9-15.1)a 39.7 (37.7-41.7)a,b
Male 1.9 (1.3-2.5) 4.8 (3.8-5.9)a 24.1 (21.2-27.0)a,b
Female 5.4 (4.5-6.3) 20.2 (18.6-21.8)a 48.2 (45.6-50.8)a,b
WHR
Total 0.85 (0.84-0.86) 0.86 (0.85-0.88) 0.87 (0.86-0.88)a
Male 0.88 (0.87-0.89) 0.89 (0.88-0.90) 0.90 (0.89-0.92)a,b
Female 0.83 (0.82-0.84) 0.84 (0.83-0.85)a 0.86 (0.85-0.87)a,b
WHR (male ≥0.90, female ≥0.80), %
Total 47.3 (45.9-48.7) 59.4 (57.9-61.0)a 70.7 (68.8-72.6)a,b
Male 31.3 (29.1-33.0) 39.3 (36.9-41.6)a 57.3 (53.9-60.6)a,b
Female 59.8 (58.0-61.7) 73.2 (71.4-75.0)a 77.6 (75.4-79.8)a,b
SBP, mm Hg
Total 118.4 (117.0-118.8) 120.4 (120.0-121.1)a 115.4 (114.7-115.9)a,b
Male 118.1 (117.4-118.8) 119.6 (118.7-120.4)a 116.2 (114.8-117.1)a,b
Female 119.6 (119.0-120.2) 120.0 (119.3-120.6) 114.1 (113.3-114.9)a,b
DBP, mm Hg
Total 76.5 (76.2-76.8) 77.5 (77.2-77.9)a 76.3 (75.9-76.7)b
Male 76.3 (75.8-76.7) 77.2 (76.7-77.7) 77.2 (76.5-77.9)
Female 77.1 (76.7-77.4) 77.0 (76.6-77.4) 75.9 (75.4-76.5)a,b
HTN, %
Total 14.3 (13.4-15.3) 18.4 (17.2-19.6)a 14.0 (12.6-15.3)b
Male 13.2 (11.7-14.6) 18.7 (16.9-20.6)a 16.8 (14.6-19.2)a
Female 15.4 (14.1-16.7) 18.2 (16.7-19.7)a 12.1 (10.6-13.6)a,b
Family expenses (BDT/mo)c
Total 3,485 (3,365-3,601) 5,408 (5,280-5,535)a 7,286 (7,132-7,441)a,b
Values are presented as means (95% confidence interval [CI]) or percentage (95% CI) adjusted for age as indicated.
Linear trend of general obesity: BMI ≥25 kg/m2 (total, P<0.001; male, P<0.001; female, P<0.001).
Linear trend of central obesity: waist (male ≥90, female ≥80 cm) (total, P<0.001; male, P<0.001; female, P<0.001); WHR (male ≥0.90, female
≥0.80) (total, P<0.001; male, P<0.001; female, P<0.001).
BMI, body mass index; WHR, waist hip ratio; SBP, systolic blood pressure; DBP, diastolic blood pressure; HTN, hypertension; BDT, Bangla- deshi taka (currency).
aP<0.05 vs. 1999, bP<0.05 vs. 2004, c1 USD=84 BDT.
2009. WHR was found to be a potential risk factor for men in all three studies. However, in females the WHR showed signif- icant association with DM in 2009 only.
DISCUSSION
There is a significant increase in the age standardized preva- lence of DM amongst study participants observed over the last 10 years. Prevalence in this rural Bangladesh population has increased more than threefold, from 2.3% to 7.9% in the last 10 years. Further, the prevalence in this population in 2009 is higher than the prevalence found in rural China 6.1% in 2005, India 6.4% in 2004, and Turkey 7.2% in 2002 [5,15,16]. How- ever, the observed prevalence rate for DM reported here is lower than that of rural populations in Hawaii (20.4%) [17].
Differences in prevalence rates may be influenced by differen- tial methodologies applied in different populations.
The age adjusted prevalence of IFG has moderately in- creased in the first 5 years, from 4.6% to 5.8% and then shown minor decrease to 5.3% in 2009. In 1999, we had observed a relatively high prevalence of IFG in a population where the prevalence of DM was moderate [18]. This may have indicated a lower prevalence of DM than IFG in this rural population of Bangladesh. The present lower prevalence of IFG could be due to vulnerability of the participants to environmental changes resulting in rapid conversion to DM. Alternatively, a rapid deterioration of susceptible normoglycemic subjects to DM could be occurring, as suggested by Mohan et al. [19]. The
trend in decreasing prevalence of IFG was also noted in an ur- ban population of India and Mauritius [20,21]. In 2009, we found a clear male predominance of IFG. This has been a con- sistent finding in many other populations [22,23].
A number of structural and industrial changes have oc- curred in the study region between 1999 and 2009, which may have changed rural life to a more sedentary lifestyle. House- hold expenses have increased 50% since 1999 in this popula- tion which may be related to rising economy. Recent studies have shown an association between urbanization, economic development and increased prevalence of DM in developing countries [15,20,24]. Mean values for BMI, WHR, and WC re- corded in the studies have increased since the initial study in 1999. In between 2004 to 2009 the rate of increase in these fac- tors has also risen when compared to the period between 1999 and 2004. The higher prevalence of DM in 2009, and the in- creased rate of change in risk factors in successive studies can be aligned with the increasing urbanization that has occurred in recent years.
Obesity is an established risk factor for DM. A significant association between higher BMI and the occurrence of DM was found in 2004 and 2009 study. It is of concern that mean BMI has significantly increased in last 10 years (mean BMI from 19.5 to 22.2 from the year 1999 to 2009). WHR was sig- nificantly associated with DM in men in all the studies. How- ever, a significant association for women and WHR was only shown in 2009. The association between WHR and DM is also evident in previous studies conducted in Bangladesh [10,18].
The SBP was found to be associated with DM in all surveys.
A decreasing trend in HTN among new study participants was observed. Similar to our findings, a declining trend of mean BP and prevalence of HTN has also been observed in several general populations [25-28]. The reason for reduce prevalence of HTN found in our study and in both sexes is unclear. Increased awareness of HTN and increased efforts aimed at treating and controlling HTN in the last 10 years, es- pecially among women, may be a contributing factor. The im- proved awareness and treatment of HTN among women has been consistently documented [29,30] however the reasons for these changes are not entirely clear. Differences in health seeking behaviour, and a greater opportunity for opportunistic BP screening, due to more frequent contacts with the health care system may contribute to this gender related difference. It should be also noted that availability of low-priced antihyper- tensive medications and nonpharmacological measures for Fig. 1. Age-adjusted prevalence by sex of diabetes mellitus
(DM) and impaired fasting glucose (IFG) in rural Bangladesh for 1999, 2004, and 2009. Linear trend of diabetes (total, P<
0.001; male, P<0.001; female, P=0.001), linear trend of IFG (total, P=0.357; male, P=0.031; female, P=0.49).
1999 2004 2009
DM male DM femaleDM total IFG male IFG female IFG total Age-adjusted prevalence (%) by sex10
8 6 4 2 0
the prevention and management of HTN have been intro- duced to improve the possibilities for the effective lowering of BP in Bangladesh for the last couple of years. One recent study conducted by Centre for Control of Chronic Diseases in Ban- gladesh, International Centre for Diarrhoeal Disease Research, Bangladesh reported that in rural Bangladesh; village doctors (unqualified practitioners), played an almost equal role to graduate medical doctors in diagnosing HTN [31]. Village doctors and pharmacies supply as much as 67% of the primary health care in Bangladesh [32] as they are the preferred health-
care providers because they are perceived to be more available, accessible, and affordable than other public health care options [33]. Longitudinal data obtained from a nationally representa- tive sample are necessary to examine true causal relationships between BP and relevant factors.
Limitations of the study
Capillary whole blood was used in the first two studies and ve- nous plasma blood in the third study. These methods were used to confirm the diagnosis of DM and IFG. WHO cutoff Table 2. Results of multiple logistic regression analysis following FBG showing association of risk factors with diabetes in rural Bangladesh for 1999, 2004, and 2009
Variable 1999 2004 2009
No. OR (95% CI) No. OR (95% CI) No. OR (95% CI)
Age
20-30 2,080 1.0 1,613 1.0 548 1.0
31-40 1,252 1.4 (0.9-2.2) 1,106 2.7 (1.8-3.9) 702 1.6 (0.9-2.7)
41-50 655 2.0 (1.1-3.6) 609 2.9 (1.9-4.5) 562 2.0 (1.2-3.5)
≥51 770 2.6 (1.5-4.5) 653 4.5 (3.0-6.8) 481 1.9 (1.1-3.6)
Sex
Male 2,037 1.0 1,598 1.0 842 1.0
Female 2,720 1.4 (1.0-2.2) 2,383 0.9 (0.7-1.2) 1,451 0. 6 (0.4-0.8)
SBP, mm Hg
<140 4,432 1.0 3,642 1.0 2,069 1.0
≥140 325 2.0 (1.0-3.9) 339 2.0 (1.2-3.3) 224 2.0 (1.1-3.5)
DBP, mm Hg
<90 4,445 1.0 3,705 1.0 1,989 1.0
≥90 312 0.7 (0.3-1.5) 276 0.8 (0.5-1.5) 304 1.2 (0.7-2.0)
BMI
<16.0 372 0.8 (0.4-1.7) 163 0.7 (0.3-1.3) 59 0.9 (0.2-1.2)
16.0-18.4 1,649 0.7 (0.5-1.2) 915 0.9 (0.6-1.2) 269 0.5 (0.2-2.4)
18.5-24.9 2,547 1.0 2,479 1.0 1,364 1.0
25.0-29.9 165 1.6 (0.7-3.7) 378 2.2 (1.5-3.2) 514 1.5 (1.0-2.2)
≥30 24 4.1 (0.5-7.3) 46 2.8 (1.2-6.6) 87 1.7 (0.8-3.5)
WHR (male)
<0.9 1,735 1.0 982 1.0 344 1.0
≥0.9 302 1.7 (1.1-2.7) 616 1.6 (1.0-2.5) 498 2.8 (1.4-5.7)
WHR (female)
<0.8 847 1.0 645 1.0 307 1.0
≥0.8 1,873 1.0 (0.6-1.6) 1,738 0.8 (0.5-1.3) 1,144 3.7 (1.5-6.8)
Adjusted odds ratio (ORs) and 95% confidence intervals (CIs) by multiple logistic regressions using for age, sex, SBP, DBP, BMI, and WHR.
FBG, fasting blood glucose; SBP, systolic blood pressure; DBP, diastolic blood pressure; BMI, body mass index; WHR, waist hip ratio.
glucose values used should reflect equivalent glucose values for capillary and venous plasma blood. However, the use of point of care blood glucose meters in a multi operator setting in large populations may have adversely influenced the inter- rater reliability of the researchers’ technique and glucose val- ues in the first two studies. Health questionnaires were admin- istered by researchers who obtained self-report information verbally and recorded it as the majority of the participants were illiterate. Therefore, the interpretation and recording of the results is a potential bias in the studies. The studies were conducted in a rural area of Bangladesh which during the 10- year period had undergone rapid urbanization and associated environmental change. Therefore the extent to which the re- sults are generalizable or representative of other populations in Bangladesh is not known.
Conclusions
The prevalence of DM has continued to increase in the past 10 years in a rural population of Bangladesh. The higher preva- lence of DM may also be indicative of other changing environ- mental factors where rapid urbanization as a pretext for eco- nomic development may have influenced individual lifestyles and dietary behaviors. The increased prevalence of risk factors for DM, amongst the study populations includes obesity and central obesity, as indicated by BMI, WC, and WHR. The sig- nificant increase of these risk indicators demonstrates the po- tential impact on health in a developing country. More large scale studies with control populations may be helpful in recog- nizing the confounding factors responsible for increased prev- alence of DM and IFG in rural Bangladesh.
CONFLICTS OF INTEREST
No potential conflict of interest relevant to this article was re- ported.
ACKNOWLEDGMENTS
We acknowledge the contribution of our survey team mem- bers, participants, the village leaders, volunteers, and lab tech- nicians for their continuous effort in the collection of data. We also express our admiration to the authority of Diabetic Asso- ciation of Bangladesh for providing us with local logistic sup- port and University of Oslo for their financial support.
REFERENCES
1. Wild S, Roglic G, Green A, Sicree R, King H. Global preva- lence of diabetes: estimates for the year 2000 and projections for 2030. Diabetes Care 2004;27:1047-53.
2. International Diabetes Federation: Diabetes atlas. Available from: http://www.eatlas.idf.org/atlasmap/atlasmap (updated 2012 Nov 14).
3. Ramachandran A, Snehalatha C, Kapur A, Vijay V, Mohan V, Das AK, Rao PV, Yajnik CS, Prasanna Kumar KM, Nair JD;
Diabetes Epidemiology Study Group in India (DESI). High prevalence of diabetes and impaired glucose tolerance in India:
National Urban Diabetes Survey. Diabetologia 2001;44:1094- 101.
4. Shera AS, Rafique G, Khwaja IA, Baqai S, Khan IA, King H.
Pakistan National Diabetes Survey prevalence of glucose intol- erance and associated factors in North West at Frontier Prov- ince (NWFP) of Pakistan. J Pak Med Assoc 1999;49:206-11.
5. Dong Y, Gao W, Nan H, Yu H, Li F, Duan W, Wang Y, Sun B, Qian R, Tuomilehto J, Qiao Q. Prevalence of type 2 diabetes in urban and rural Chinese populations in Qingdao, China. Dia- bet Med 2005;22:1427-33.
6. Laskar SI. Urbanization in Bangladesh: some contemporary observations. Bangladesh Dev Stud 1996;24:207-16.
7. Bangladesh Bureau of Statistics. Statistical pocketbook of Ban- gladesh 2004. Dhaka: Bangladesh Bureau of Statistics; 2006.
8. Sayeed MA, Ali L, Hussain MZ, Rumi MA, Banu A, Azad Khan AK. Effect of socioeconomic risk factors on the difference in prevalence of diabetes between rural and urban populations in Bangladesh. Diabetes Care 1997;20:551-5.
9. Sayeed MA, Mahtab H, Akter Khanam P, Abdul Latif Z, Kera- mat Ali SM, Banu A, Ahren B, Azad Khan AK. Diabetes and impaired fasting glycemia in a rural population of Bangladesh.
Diabetes Care 2003;26:1034-9.
10. Hussain A, Rahim MA, Azad Khan AK, Ali SM, Vaaler S. Type 2 diabetes in rural and urban population: diverse prevalence and associated risk factors in Bangladesh. Diabet Med 2005;22:
931-6.
11. Report of the Expert Committee on the Diagnosis and Classi- fication of Diabetes Mellitus. Diabetes Care 1997;20:1183-97.
12. Kanematsu N, Shibata KI. Investigation of DNA reactivity of endodontic agents by rec-assay. Gifu Shika Gakkai Zasshi 1990;17:592-7.
13. World Health Organization Regional Office for the Western Pacific, International Association for the Study of Obesity, In-
ternational Obesity Task Force. The Asia-Pacific perspective:
redefining obesity and its treatment. Sydney: Health Commu- nications Australia; 2000.
14. Singha AC. Statistical pocketbook of Bangladesh 2000. Dhaka:
Bangladesh Bureau of Statistics; 2002.
15. Ramachandran A, Snehalatha C, Baskar AD, Mary S, Kumar CK, Selvam S, Catherine S, Vijay V. Temporal changes in prev- alence of diabetes and impaired glucose tolerance associated with lifestyle transition occurring in the rural population in India. Diabetologia 2004;47:860-5.
16. Satman I, Yilmaz T, Sengul A, Salman S, Salman F, Uygur S, Bastar I, Tutuncu Y, Sargin M, Dinccag N, Karsidag K, Kalaca S, Ozcan C, King H. Population-based study of diabetes and risk characteristics in Turkey: results of the turkish diabetes epidemiology study (TURDEP). Diabetes Care 2002;25:1551-6.
17. Grandinetti A, Chang HK, Mau MK, Curb JD, Kinney EK, Sa- gum R, Arakaki RF. Prevalence of glucose intolerance among native Hawaiians in two rural communities. Native Hawaiian Health Research (NHHR) Project. Diabetes Care 1998;21:549- 54.
18. Rahim MA, Hussain A, Azad Khan AK, Sayeed MA, Keramat Ali SM, Vaaler S. Rising prevalence of type 2 diabetes in rural Bangladesh: a population based study. Diabetes Res Clin Pract 2007;77:300-5.
19. Mohan V, Deepa M, Deepa R, Shanthirani CS, Farooq S, Ga- nesan A, Datta M. Secular trends in the prevalence of diabetes and impaired glucose tolerance in urban South India: the Chennai Urban Rural Epidemiology Study (CURES-17). Dia- betologia 2006;49:1175-8.
20. Ramachandran A, Mary S, Yamuna A, Murugesan N, Snehal- atha C. High prevalence of diabetes and cardiovascular risk factors associated with urbanization in India. Diabetes Care 2008;31:893-8.
21. Soderberg S, Zimmet P, Tuomilehto J, de Courten M, Dowse GK, Chitson P, Gareeboo H, Alberti KG, Shaw JE. Increasing prevalence of type 2 diabetes mellitus in all ethnic groups in Mauritius. Diabet Med 2005;22:61-8.
22. Harris MI, Flegal KM, Cowie CC, Eberhardt MS, Goldstein DE, Little RR, Wiedmeyer HM, Byrd-Holt DD. Prevalence of diabe- tes, impaired fasting glucose, and impaired glucose tolerance in U.S. adults. The Third National Health and Nutrition Examina- tion Survey, 1988-1994. Diabetes Care 1998;21:518-24.
23. Unwin N, Shaw J, Zimmet P, Alberti KG. Impaired glucose tol- erance and impaired fasting glycaemia: the current status on definition and intervention. Diabet Med 2002;19:708-23.
24. Ramachandran A, Snehalatha C, Dharmaraj D, Viswanathan M. Prevalence of glucose intolerance in Asian Indians. Urban- rural difference and significance of upper body adiposity. Dia- betes Care 1992;15:1348-55.
25. Ong KL, Cheung BM, Man YB, Lau CP, Lam KS. Prevalence, awareness, treatment, and control of hypertension among United States adults 1999-2004. Hypertension 2007;49:69-75.
26. Kuulasmaa K, Tunstall-Pedoe H, Dobson A, Fortmann S, Sans S, Tolonen H, Evans A, Ferrario M, Tuomilehto J. Estimation of contribution of changes in classic risk factors to trends in coronary-event rates across the WHO MONICA Project pop- ulations. Lancet 2000;355:675-87.
27. Ikeda N, Gakidou E, Hasegawa T, Murray CJ. Understanding the decline of mean systolic blood pressure in Japan: an analy- sis of pooled data from the National Nutrition Survey, 1986- 2002. Bull World Health Organ 2008;86:978-88.
28. Pourmoghaddas M, Khosravi A, Kelishadi R, Sarrafzadegan N, Shirani S, Ansari R, Sabet B. Trends in blood pressure level, prevalence and control of hypertension in Isfahan, Iran. Iran Heart J 2004;5:33-8.
29. Fuentes R, Ilmaniemi N, Laurikainen E, Tuomilehto J, Nissin- en A. Hypertension in developing economies: a review of pop- ulation-based studies carried out from 1980 to 1998. J Hyper- tens 2000;18:521-9.
30. Klungel OH, de Boer A, Paes AH, Seidell JC, Bakker A. Sex differences in the pharmacological treatment of hypertension:
a review of population-based studies. J Hypertens 1997;15:
591-600.
31. Determinants of qualified hypertension diagnosis in surveil- lance sites of Bangladesh: findings from a cross-sectional study. Health Sci Bull 2011;9:15-8.
32. Mahmood SS, Iqbal M, Hanifi SM, Wahed T, Bhuiya A. Are
‘Village Doctors’ in Bangladesh a curse or a blessing? BMC Int Health Hum Rights 2010;10:18.
33. Cockcroft A, Andersson N, Milne D, Hossain MZ, Karim E.
What did the public think of health services reform in Bangla- desh? Three national community-based surveys 1999-2003.
Health Res Policy Syst 2007;5:1.