ABSTRACT
Purpose: This study investigated the association between health status and tooth loss based on data from the National Health Insurance Service-Health Examinee Cohort in 2002–2015.
Methods: Multivariate Cox proportional hazards regression analyses were applied to a longitudinal retrospective database, which was updated and newly released in 2018, to assess the association between health status and tooth loss while adjusting for potential confounders among sociodemographic and economic factors (sex, age, household income, insurance, and presence of disability), general and oral health status (body mass index [BMI], smoking and drinking status, periodic dental visits and scaling, and brushing before sleep), and comorbid disease (hypertension, diabetes mellitus [DM], and Charlson comorbidity index [CCI]).
Results: Among 514,866 participants from a South Korean population, 234,247 (45.5%) participants satisfying the inclusion criteria were analyzed. In the adjusted multivariate analysis, sex, age, household income, insurance, presence of disability, BMI, smoking and drinking status, periodic scaling, tooth brushing before sleep, DM, and CCI showed statistically significant associations with the loss of at least 1 tooth. The risk of experiencing a loss of ≥4 teeth was associated with an increase in age (in those 50–59 years of age: hazard ratio [HR], 1.98; 95% confidence interval [CI], 1.93–2.03; in those 60–69 years of age: HR, 2.93; 95% CI, 2.85–3.02; and in those 70–79 years of age: HR, 2.93; 95%, CI 2.81–3.05), smoking (HR, 1.69; 95% CI, 1.65–1.73), and DM (HR, 1.43; 95% CI, 1.38–1.48).
Conclusions: The results of this study showed that the risk of experiencing tooth loss was related to multiple determinants. DM and smoking were especially significantly associated with tooth loss.
Keywords: Cohort analysis; Dental caries; Periodontal disease; Tooth extraction; Tooth loss
Research Article
Received: Mar 13, 2019 Revised: May 9, 2019 Accepted: Jun 10, 2019
*Correspondence:
Jae-Hong Lee
Department of Periodontology, Daejeon Dental Hospital, Wonkwang University College of Dentistry, 77 Dunsan-ro, Seo-gu, Daejeon 35233, Korea.
E-mail: [email protected] Tel: +82-42-366-1114 Fax: +82-42-366-1115
†Yeon-Tae Kim and Jung-Kyu Choi contributed equally to this study.
Copyright © 2019. Korean Academy of Periodontology
This is an Open Access article distributed under the terms of the Creative Commons Attribution Non-Commercial License (https://
creativecommons.org/licenses/by-nc/4.0/).
ORCID iDs Yeon-Tae Kim
https://orcid.org/0000-0001-7209-3208 Jung-Kyu Choi
https://orcid.org/0000-0001-5176-0534 Do-Hyung Kim
https://orcid.org/0000-0001-7846-6175 Seong-Nyum Jeong
https://orcid.org/0000-0003-4890-989X Jae-Hong Lee
https://orcid.org/0000-0002-2375-0141 Funding
This study was supported by Wonkwang University in 2019.
Yeon-Tae Kim 1,†, Jung-Kyu Choi 2,†, Do-Hyung Kim 1, Seong-Nyum Jeong 1, Jae-Hong Lee 1,*
1 Department of Periodontology, Daejeon Dental Hospital, Institute of Wonkwang Dental Research, Wonkwang University College of Dentistry, Daejeon, Korea
2Department of Health Insurance Research, Ilsan Hospital, National Health Insurance Service, Goyang, Korea
Association between health status and tooth loss in Korean adults:
longitudinal results from the National Health Insurance Service-Health
Examinee Cohort, 2002–2015
Periodontal Science
Author Contributions
Conceptualization: Yeon-Tae Kim, Jung-Kyu Choi, Jae-Hong Lee; Formal analysis: Yeon-Tae Kim, Jung-Kyu Choi, Do-Hyung Kim, Seoung- Nyum Jeong, Jae-Hong Lee; Investigation:
Yeon-Tae Kim, Jung-Kyu Choi, Do-Hyung Kim, Seoung-Nyum Jeong, Jae-Hong Lee;
Methodology: Yeon-Tae Kim, Jung-Kyu Choi, Jae-Hong Lee; Project administration:
Seoung-Nyum Jeong, Jae-Hong Lee; Writing - original draft: Yeon-Tae Kim, Jung-Kyu Choi, Do-Hyung Kim; Writing - review & editing:
Seoung-Nyum Jeong, Jae-Hong Lee.
Conflict of Interest
No potential conflict of interest relevant to this article was reported.
INTRODUCTION
The proportion of the elderly among patients with intraoral soft and hard tissue diseases has increased rapidly as aging or super-aging populations have increased in recent years [1]. Various risk factors contribute to tooth loss caused by declining oral health. Despite improvements in dental care and strategies to maintain teeth, tooth loss remains a significant public health concern. Among the primary causes of tooth loss in Korea, periodontal disease and dental caries, which were ranked as the third (approximately 7.9 million people) and seventh (approximately 5.37 million people) most common causes in 2010, have increased by 1.9-fold and 1.1-fold to rank second (approximately 15 million people) and sixth (6 million people) in 2017, respectively.
As well as the occurrence of chronic non-communicable diseases (NCDs, including cardiovascular disease, hypertension, diabetes mellitus [DM], cancer, osteoporosis, erectile dysfunction, and dementia), the occurrence of tooth loss has also been steadily increasing [2,3].
Teeth are an important anatomical structure and tooth loss negatively affects mastication and nutrient intake, pronunciation, smile, appearance, and quality of life [4]. In addition, tooth loss may be a modifiable risk indicator or factor for NCDs; furthermore, NCDs may also affect tooth loss, resulting in a mutual causal and bidirectional relationship between these factors [5].
Due to the continuous and gradual expansion in the target population and the applicable range of dental health insurance coverage (DHIC) in Korea, public awareness and interest in oral health have been enhanced and the physical and economic accessibility of dental clinics has improved. Preventive periodontal scaling (once-yearly plaque and calculus removal) for adults 20 years and older was included in DHIC starting in July 2013 and was subsequently expanded to include adults 19 years and older in 2017. Sealant resin (sealants for preventing dental caries and light-curing composite resin restoration in permanent teeth) treatment for children and prosthodontic treatments (including partial and full dentures as well as dental implants) for the elderly (individuals aged 65 years or older) are also included in DHIC.
Ninety-seven percent of Koreans are obligatorily enrolled in the national health insurance system, and all medical and dental expense claims are supervised by the National Health Insurance Service (NHIS) and the Health Insurance Review and Assessment Service (HIRA).
The NHIS and HIRA provide researchers with large public health databases for research on disease prevention, diagnosis, treatment, rehabilitation, and mortality [6]. The cohort database, which is easier to access for research purposes, was released in 2013, and large- scale epidemiological studies have been actively conducted in various medical and dental fields [7,8]. Similarly, studies have also investigated the associations between general and oral health status and tooth loss, but few of them have reflected the recent DHIC modifications [9,10]. Therefore, the present study evaluated the associations between health status and tooth loss based on data from the NHIS-Health Examinee Cohort (NHIS-HEC) in 2002–2015, which was updated and newly released in 2018.
MATERIALS AND METHODS
Study design and sample
This study used information from the NHIS-HEC database provided by the National Health Insurance Sharing Service (https://nhiss.nhis.or.kr). The Institutional Review
Board of Daejeon Dental Hospital, Wonkwang University approved this study (approval no.
W1710/002–001). This study conformed to the Strengthening the Reporting of Observational Studies in Epidemiology guidelines (www.strobe-statement.org). Because of the
retrospective nature of the study and because the data were obtained from the NHIS (NHIS- 2019-2-013), the need for written and informed consent was waived.
The NHIS-HEC targeted individuals who received a general health examination (40–79 years of age between 2002 and 2003). A total of 514,866 participants (10% of 51.5 million examinees) were extracted based on random stratified sampling. This database includes sociodemographic and economic information, information on medical and dental health care claims, general and dental health examinations (primary and secondary), general and dental health examinations of the life-span transition period (primary and secondary, for people aged 40 years and 66 years), cancer examinations, and infant/child health examinations, as well as elderly care facility information and other variables related to disabilities and mortality.
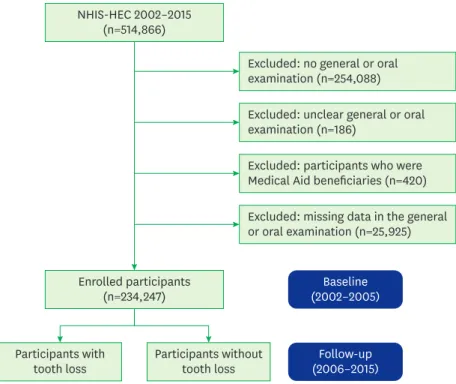
Among the 514,866 participants included in the NHIS-HEC, those with no general or oral examination records (n=254,088), with unclear general or oral examination records (n=186), who were Medical Aid beneficiaries (n=420), and with missing data in the general or oral examination records (n=25,925) were excluded. As a result, 234,247 participants were selected for the current study and the period between 2002 and 2005 was set as the baseline (Figure 1).
Independent and confounding variables
In the present study, the following variables reflecting sociodemographic and economic factors, general and oral health status, and comorbid diseases in the NHIS-HEC data were included in the models: sex, age (40–79 years of age, in 10-year groups), household income (quintiles 1–5, grouped by the insurance fee imposed on each household), insurance status,
NHIS-HEC 2002–2015 (n=514,866)
Enrolled participants (n=234,247)
Participants without tooth loss
Baseline (2002–2005)
Follow-up (2006–2015) Participants with
tooth loss
Excluded: no general or oral examination (n=254,088) Excluded: unclear general or oral examination (n=186)
Excluded: participants who were Medical Aid beneficiaries (n=420) Excluded: missing data in the general or oral examination (n=25,925)
Figure 1. Flowchart of the inclusion and exclusion of participants in the NHIS-HEC (a South Korean population in 2002–2015) according to their experience of tooth loss.
NHIS-HEC: National Health Insurance Service-Health Examinee Cohort.
presence of disability (as classified by the Handicapped Welfare Law), body mass index (BMI, classified as follows: <18.5 kg/m2 as underweight, 18.5–23 kg/m2 as normal, 23–25 kg/m2 as overweight, and >25 kg/m2 as obese), smoking (classified as non-smokers/former smokers and current smokers) and drinking (classified as non-drinkers, drinkers who drink <3 times a week, and drinkers who drink ≥3 times a week) status, periodic dental visits and periodontal scaling at least once a year, tooth brushing before sleep, hypertension (International Classification of Diseases, tenth revision [ICD-10] codes: I10 and I15), DM (ICD-10 codes:
E10–E15), and Charlson Comorbidity Index (CCI).
Comorbid disease was diagnosed by medical doctors and the diagnostic and prescription codes were obtained for each participant. The CCI is an index used to assess disease severity by assigning weights according to the type of comorbidity for a total of 17 diseases as follows:
1 point for acute myocardial infarction (ICD-10 codes I21, I22, and I252), congestive heart disease (ICD-10 code I50), peripheral vascular disease (ICD-10 codes I71, I739, I790, R02, Z958, and Z959), cerebral vascular accident (ICD-10 codes I60–I69, G450–G452, G454, G458, G459, and G46), dementia (ICD-10 codes F00–F02 and F051), pulmonary disease (ICD-10 codes J40–J47 and J61–J67), connective tissue disorders (ICD-10 codes M32–M35, M058–M060, M063, and M069), peptic ulcer (ICD-10 codes K25–K28), liver disease (ICD-10 codes K702, K703, K717, K73, K740, and K742–K746), and DM without end-organ damage (ICD-10 codes E101, E105, E109, E111, E115, E119, E131, E135, E139, E141, E145, and E149); 2 points for DM complications (ICD-10 codes E102–104, E112–114, E132–134, and E142–144), paraplegia (ICD-10 codes G041 and G81–G822), renal disease (ICD-10 codes N01, N03, N052–N056, N072, N18, N19, and N25), and cancer (ICD-10 codes C0–C96); 3 points for metastatic tumor (ICD-10 code C77–C80) and serious liver disease (ICD-10 codes: K721, K729, K766, and K767); and 6 points for human immunodeficiency virus (ICD-10 codes: B20–B24). The CCI is classified as mild for scores of 0, moderate for scores of 1–2, and severe for scores ≥3 [11]. The present study classification used scores of 0, 1, and ≥2, for mild, moderate, and severe, respectively.
Statistical analysis
We performed χ2, univariate, and multivariate Cox proportional hazards regression analyses to evaluate the effects of health status and tooth loss. Hazard ratios (HRs) with 95% confidence intervals (CIs) were calculated while adjusting for possible confounding factors including sociodemographic and economic factors, general and oral health status, and comorbid disease. The cumulative incidence of participants experiencing the loss of at least 1 tooth was estimated using the adjusted Kaplan-Meier method. P values <0.05 were considered to indicate statistical significance and all data used in this study were analyzed using SAS version 9.4 (SAS Institute, Cary, NC, USA) from the Department of Health Insurance Research, Ilsan Hospital, NHIS.
RESULTS
Baseline characteristics
Of the 234,247 total participants, 136,658 (58.3%) were male and 97,589 (41.7%) were female.
Among them, 119,538 (51.0%) had experienced the loss of at least 1 tooth. The highest prevalence of tooth loss occurred in the 60–69-years age group (n=26,096, 63.7%) and those belonging to the third income quintile (n=18,289, 53.7%). The probability of experiencing the loss of least 1 tooth was high among self-employed participants in the NHIS (n=38,136, 52.7%), those with a disability (n=692, 55.4%), those with a BMI ≥25 kg/m2 (n=44,295,
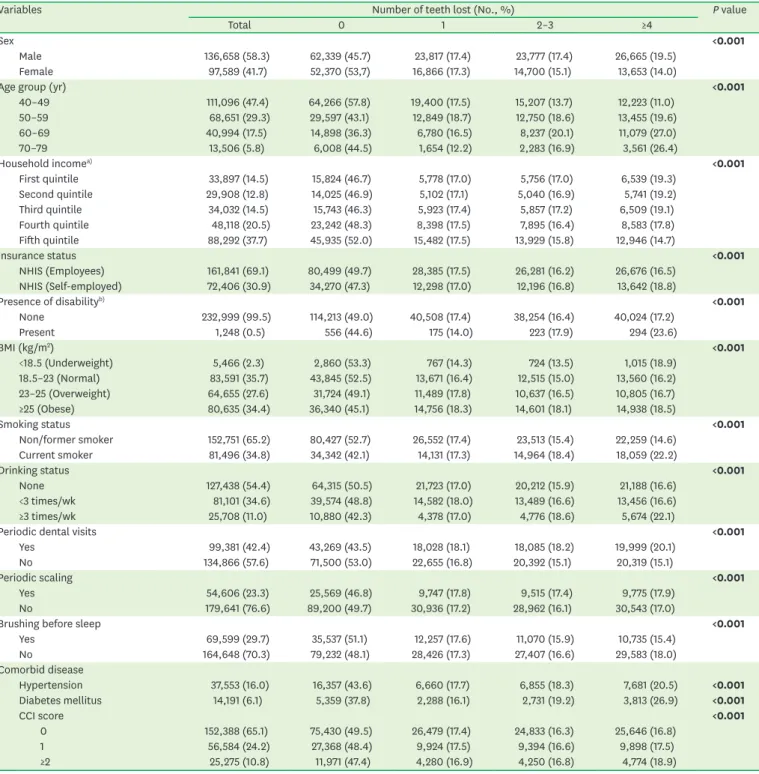
54.9%), current smokers (n=47,154, 57.9%), drinkers who drank ≥3 times a week (n=14,828, 57.7%), those with periodic dental visits (n=56,112, 56.5%), those who received periodic scaling (n=26,037, 53.2%), those who did not brush their teeth before sleep (n=85,416, 51.9%), those with hypertension (n=21,196, 56.4%), those with DM (n=8,832, 62.2%), and those with a CCI ≥ 2 (n=13,304, 52.6%) (Table 1).
Table 1. Baseline characteristics of the population included in the National Health Insurance Service–Health Examinee Cohort according to their experience of tooth loss
Variables Number of teeth lost (No., %) P value
Total 0 1 2–3 ≥4
Sex <0.001
Male 136,658 (58.3) 62,339 (45.7) 23,817 (17.4) 23,777 (17.4) 26,665 (19.5)
Female 97,589 (41.7) 52,370 (53,7) 16,866 (17.3) 14,700 (15.1) 13,653 (14.0)
Age group (yr) <0.001
40–49 111,096 (47.4) 64,266 (57.8) 19,400 (17.5) 15,207 (13.7) 12,223 (11.0)
50–59 68,651 (29.3) 29,597 (43.1) 12,849 (18.7) 12,750 (18.6) 13,455 (19.6)
60–69 40,994 (17.5) 14,898 (36.3) 6,780 (16.5) 8,237 (20.1) 11,079 (27.0)
70–79 13,506 (5.8) 6,008 (44.5) 1,654 (12.2) 2,283 (16.9) 3,561 (26.4)
Household incomea) <0.001
First quintile 33,897 (14.5) 15,824 (46.7) 5,778 (17.0) 5,756 (17.0) 6,539 (19.3)
Second quintile 29,908 (12.8) 14,025 (46.9) 5,102 (17.1) 5,040 (16.9) 5,741 (19.2)
Third quintile 34,032 (14.5) 15,743 (46.3) 5,923 (17.4) 5,857 (17.2) 6,509 (19.1)
Fourth quintile 48,118 (20.5) 23,242 (48.3) 8,398 (17.5) 7,895 (16.4) 8,583 (17.8)
Fifth quintile 88,292 (37.7) 45,935 (52.0) 15,482 (17.5) 13,929 (15.8) 12,946 (14.7)
Insurance status <0.001
NHIS (Employees) 161,841 (69.1) 80,499 (49.7) 28,385 (17.5) 26,281 (16.2) 26,676 (16.5)
NHIS (Self-employed) 72,406 (30.9) 34,270 (47.3) 12,298 (17.0) 12,196 (16.8) 13,642 (18.8)
Presence of disabilityb) <0.001
None 232,999 (99.5) 114,213 (49.0) 40,508 (17.4) 38,254 (16.4) 40,024 (17.2)
Present 1,248 (0.5) 556 (44.6) 175 (14.0) 223 (17.9) 294 (23.6)
BMI (kg/m2) <0.001
<18.5 (Underweight) 5,466 (2.3) 2,860 (53.3) 767 (14.3) 724 (13.5) 1,015 (18.9)
18.5–23 (Normal) 83,591 (35.7) 43,845 (52.5) 13,671 (16.4) 12,515 (15.0) 13,560 (16.2)
23–25 (Overweight) 64,655 (27.6) 31,724 (49.1) 11,489 (17.8) 10,637 (16.5) 10,805 (16.7)
≥25 (Obese) 80,635 (34.4) 36,340 (45.1) 14,756 (18.3) 14,601 (18.1) 14,938 (18.5)
Smoking status <0.001
Non/former smoker 152,751 (65.2) 80,427 (52.7) 26,552 (17.4) 23,513 (15.4) 22,259 (14.6)
Current smoker 81,496 (34.8) 34,342 (42.1) 14,131 (17.3) 14,964 (18.4) 18,059 (22.2)
Drinking status <0.001
None 127,438 (54.4) 64,315 (50.5) 21,723 (17.0) 20,212 (15.9) 21,188 (16.6)
<3 times/wk 81,101 (34.6) 39,574 (48.8) 14,582 (18.0) 13,489 (16.6) 13,456 (16.6)
≥3 times/wk 25,708 (11.0) 10,880 (42.3) 4,378 (17.0) 4,776 (18.6) 5,674 (22.1)
Periodic dental visits <0.001
Yes 99,381 (42.4) 43,269 (43.5) 18,028 (18.1) 18,085 (18.2) 19,999 (20.1)
No 134,866 (57.6) 71,500 (53.0) 22,655 (16.8) 20,392 (15.1) 20,319 (15.1)
Periodic scaling <0.001
Yes 54,606 (23.3) 25,569 (46.8) 9,747 (17.8) 9,515 (17.4) 9,775 (17.9)
No 179,641 (76.6) 89,200 (49.7) 30,936 (17.2) 28,962 (16.1) 30,543 (17.0)
Brushing before sleep <0.001
Yes 69,599 (29.7) 35,537 (51.1) 12,257 (17.6) 11,070 (15.9) 10,735 (15.4)
No 164,648 (70.3) 79,232 (48.1) 28,426 (17.3) 27,407 (16.6) 29,583 (18.0)
Comorbid disease
Hypertension 37,553 (16.0) 16,357 (43.6) 6,660 (17.7) 6,855 (18.3) 7,681 (20.5) <0.001
Diabetes mellitus 14,191 (6.1) 5,359 (37.8) 2,288 (16.1) 2,731 (19.2) 3,813 (26.9) <0.001
CCI score <0.001
0 152,388 (65.1) 75,430 (49.5) 26,479 (17.4) 24,833 (16.3) 25,646 (16.8)
1 56,584 (24.2) 27,368 (48.4) 9,924 (17.5) 9,394 (16.6) 9,898 (17.5)
≥2 25,275 (10.8) 11,971 (47.4) 4,280 (16.9) 4,250 (16.8) 4,774 (18.9)
NHIS: National Health Insurance Service, CCI: Charlson comorbidity index, BMI: body mass index.
Boldface denotes statistical significance (P<0.05).
a)Divided into 5 quintiles based on the insurance fee imposed on each household; b)Classified by the Handicapped Welfare Law in South Korea.
Tooth loss
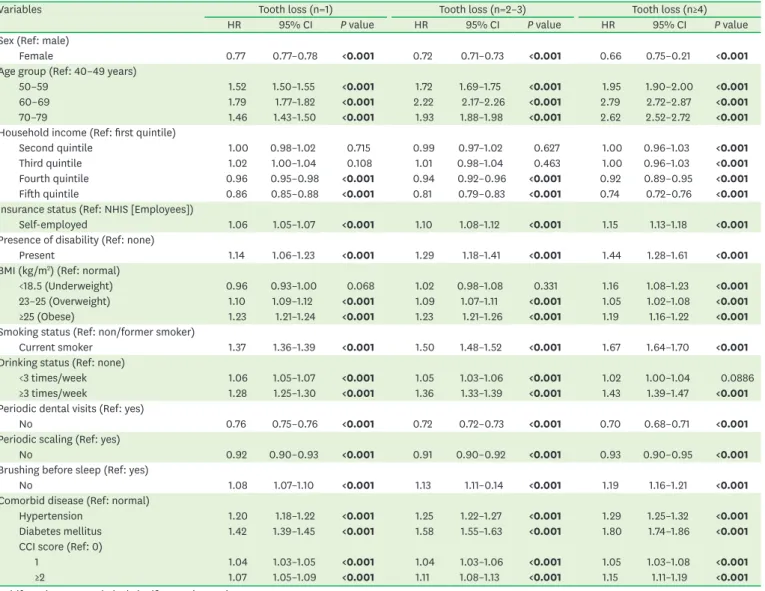
The univariate analysis (Table 2) showed that all included variables were significantly associated with the loss of at least 1 tooth. In particular, participants with DM had a 1.80-fold (95% CI, 1.74–1.86; P<0.001) increased risk of experiencing the loss of ≥4 teeth, while smoking and drinking ≥3 times a week was associated with 1.67-fold (95% CI, 1.64–1.70; P<0.001) and 1.43-fold (95% CI, 1.39–1.47; P<0.001) increased risks of experiencing a loss of ≥4 teeth, respectively.
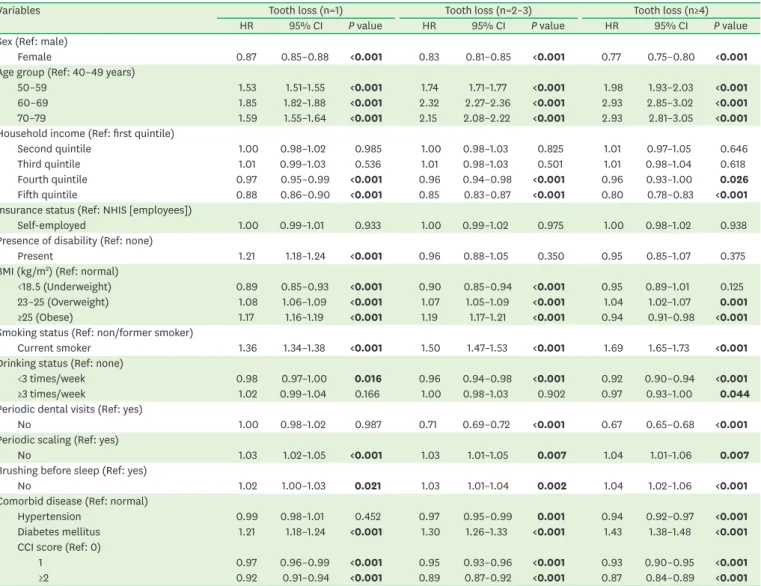
The adjusted multivariate analysis (Table 3) revealed that sex, age, household income, the presence of a disability, BMI, smoking and drinking status, periodic scaling, tooth brushing before sleep, DM, and the CCI were significantly associated with the loss of at least 1 tooth.
Women had a 0.77-fold (95% CI, 0.75–0.80; P<0.001) lower risk of experiencing the loss of ≥4 teeth than men and the risk of tooth loss in the fifth (highest) quintile of household income was 0.80-fold (95% CI, 0.78–0.83; P<0.001) lower than that in the first quintile. Unlike the findings of the univariate analysis, participants with a disability showed a lower risk of tooth loss than
Table 2. Associations of tooth loss with general and oral health status (univariate analysis)
Variables Tooth loss (n=1) Tooth loss (n=2–3) Tooth loss (n≥4)
HR 95% CI P value HR 95% CI P value HR 95% CI P value
Sex (Ref: male)
Female 0.77 0.77–0.78 <0.001 0.72 0.71–0.73 <0.001 0.66 0.75–0.21 <0.001
Age group (Ref: 40–49 years)
50–59 1.52 1.50–1.55 <0.001 1.72 1.69–1.75 <0.001 1.95 1.90–2.00 <0.001
60–69 1.79 1.77–1.82 <0.001 2.22 2.17–2.26 <0.001 2.79 2.72–2.87 <0.001
70–79 1.46 1.43–1.50 <0.001 1.93 1.88–1.98 <0.001 2.62 2.52–2.72 <0.001
Household income (Ref: first quintile)
Second quintile 1.00 0.98–1.02 0.715 0.99 0.97–1.02 0.627 1.00 0.96–1.03 <0.001
Third quintile 1.02 1.00–1.04 0.108 1.01 0.98–1.04 0.463 1.00 0.96–1.03 <0.001
Fourth quintile 0.96 0.95–0.98 <0.001 0.94 0.92–0.96 <0.001 0.92 0.89–0.95 <0.001
Fifth quintile 0.86 0.85–0.88 <0.001 0.81 0.79–0.83 <0.001 0.74 0.72–0.76 <0.001
Insurance status (Ref: NHIS [Employees])
Self-employed 1.06 1.05–1.07 <0.001 1.10 1.08–1.12 <0.001 1.15 1.13–1.18 <0.001
Presence of disability (Ref: none)
Present 1.14 1.06–1.23 <0.001 1.29 1.18–1.41 <0.001 1.44 1.28–1.61 <0.001
BMI (kg/m2) (Ref: normal)
<18.5 (Underweight) 0.96 0.93–1.00 0.068 1.02 0.98–1.08 0.331 1.16 1.08–1.23 <0.001
23–25 (Overweight) 1.10 1.09–1.12 <0.001 1.09 1.07–1.11 <0.001 1.05 1.02–1.08 <0.001
≥25 (Obese) 1.23 1.21–1.24 <0.001 1.23 1.21–1.26 <0.001 1.19 1.16–1.22 <0.001
Smoking status (Ref: non/former smoker)
Current smoker 1.37 1.36–1.39 <0.001 1.50 1.48–1.52 <0.001 1.67 1.64–1.70 <0.001
Drinking status (Ref: none)
<3 times/week 1.06 1.05–1.07 <0.001 1.05 1.03–1.06 <0.001 1.02 1.00–1.04 0.0886
≥3 times/week 1.28 1.25–1.30 <0.001 1.36 1.33–1.39 <0.001 1.43 1.39–1.47 <0.001
Periodic dental visits (Ref: yes)
No 0.76 0.75–0.76 <0.001 0.72 0.72–0.73 <0.001 0.70 0.68–0.71 <0.001
Periodic scaling (Ref: yes)
No 0.92 0.90–0.93 <0.001 0.91 0.90–0.92 <0.001 0.93 0.90–0.95 <0.001
Brushing before sleep (Ref: yes)
No 1.08 1.07–1.10 <0.001 1.13 1.11–0.14 <0.001 1.19 1.16–1.21 <0.001
Comorbid disease (Ref: normal)
Hypertension 1.20 1.18–1.22 <0.001 1.25 1.22–1.27 <0.001 1.29 1.25–1.32 <0.001
Diabetes mellitus 1.42 1.39–1.45 <0.001 1.58 1.55–1.63 <0.001 1.80 1.74–1.86 <0.001
CCI score (Ref: 0)
1 1.04 1.03–1.05 <0.001 1.04 1.03–1.06 <0.001 1.05 1.03–1.08 <0.001
≥2 1.07 1.05–1.09 <0.001 1.11 1.08–1.13 <0.001 1.15 1.11–1.19 <0.001
Boldface denotes statistical significance (P<0.05).
HR: hazard ratio, CI: confidence interval, BMI: body mass index, CCI: Charlson comorbidity index.
their counterparts in the multivariate analysis; however, the difference was not statistically significant. The probability of experiencing tooth loss increased with age; in particular, participants aged 60–69 years (95% CI, 2.85–3.02; P<0.001) and 70–79 years (95% CI, 2.81–3.05;
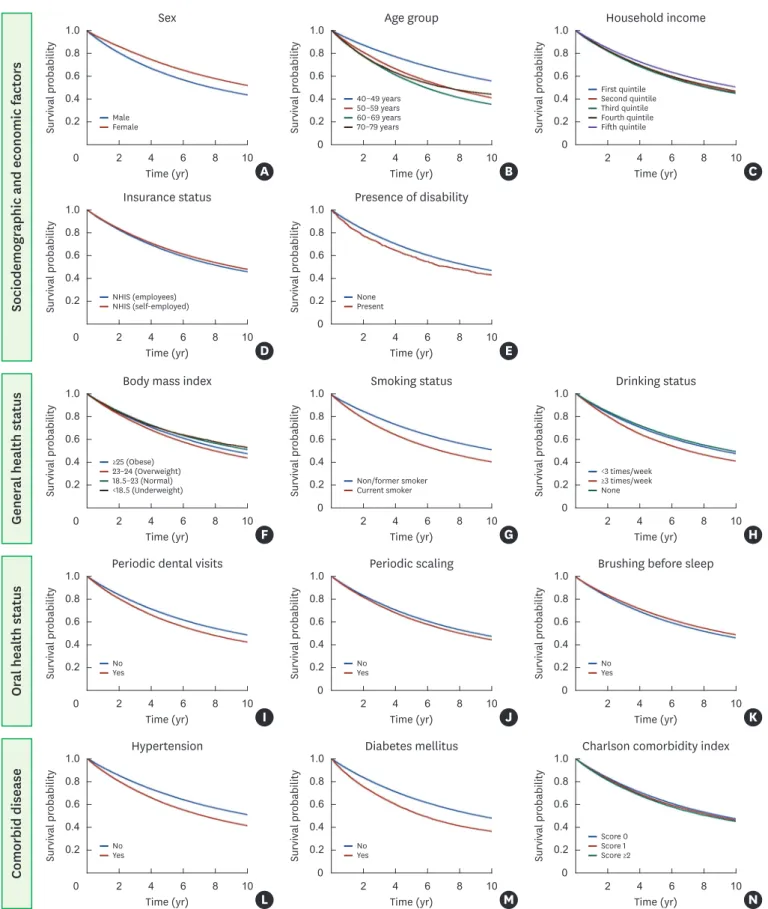
P<0.001) showed a 2.93-fold increased risk of experiencing a loss of ≥4 teeth than participants aged 40–49 years group. Current smokers had a 1.69-fold (95% CI, 1.65–1.73; P<0.001) increased risk of experiencing a loss of ≥4 teeth, while those with DM showed a 1.43-fold (95% CI, 1.38–1.48; P<0.001) increased risk. Adjusted Kaplan-Meier curves also showed that sociodemographic and economic factors, general and oral health status, and comorbid disease were statistically significantly associated with the loss of at least 1 tooth (Figure 2).
Table 3. Association of tooth loss with general and oral health status (multivariate analysis)
Variables Tooth loss (n=1) Tooth loss (n=2–3) Tooth loss (n≥4)
HR 95% CI P value HR 95% CI P value HR 95% CI P value
Sex (Ref: male)
Female 0.87 0.85–0.88 <0.001 0.83 0.81–0.85 <0.001 0.77 0.75–0.80 <0.001
Age group (Ref: 40–49 years)
50–59 1.53 1.51–1.55 <0.001 1.74 1.71–1.77 <0.001 1.98 1.93–2.03 <0.001
60–69 1.85 1.82–1.88 <0.001 2.32 2.27–2.36 <0.001 2.93 2.85–3.02 <0.001
70–79 1.59 1.55–1.64 <0.001 2.15 2.08–2.22 <0.001 2.93 2.81–3.05 <0.001
Household income (Ref: first quintile)
Second quintile 1.00 0.98–1.02 0.985 1.00 0.98–1.03 0.825 1.01 0.97–1.05 0.646
Third quintile 1.01 0.99–1.03 0.536 1.01 0.98–1.03 0.501 1.01 0.98–1.04 0.618
Fourth quintile 0.97 0.95–0.99 <0.001 0.96 0.94–0.98 <0.001 0.96 0.93–1.00 0.026
Fifth quintile 0.88 0.86–0.90 <0.001 0.85 0.83–0.87 <0.001 0.80 0.78–0.83 <0.001
Insurance status (Ref: NHIS [employees])
Self-employed 1.00 0.99–1.01 0.933 1.00 0.99–1.02 0.975 1.00 0.98–1.02 0.938
Presence of disability (Ref: none)
Present 1.21 1.18–1.24 <0.001 0.96 0.88–1.05 0.350 0.95 0.85–1.07 0.375
BMI (kg/m2) (Ref: normal)
<18.5 (Underweight) 0.89 0.85–0.93 <0.001 0.90 0.85–0.94 <0.001 0.95 0.89–1.01 0.125
23–25 (Overweight) 1.08 1.06–1.09 <0.001 1.07 1.05–1.09 <0.001 1.04 1.02–1.07 0.001
≥25 (Obese) 1.17 1.16–1.19 <0.001 1.19 1.17–1.21 <0.001 0.94 0.91–0.98 <0.001
Smoking status (Ref: non/former smoker)
Current smoker 1.36 1.34–1.38 <0.001 1.50 1.47–1.53 <0.001 1.69 1.65–1.73 <0.001
Drinking status (Ref: none)
<3 times/week 0.98 0.97–1.00 0.016 0.96 0.94–0.98 <0.001 0.92 0.90–0.94 <0.001
≥3 times/week 1.02 0.99–1.04 0.166 1.00 0.98–1.03 0.902 0.97 0.93–1.00 0.044
Periodic dental visits (Ref: yes)
No 1.00 0.98–1.02 0.987 0.71 0.69–0.72 <0.001 0.67 0.65–0.68 <0.001
Periodic scaling (Ref: yes)
No 1.03 1.02–1.05 <0.001 1.03 1.01–1.05 0.007 1.04 1.01–1.06 0.007
Brushing before sleep (Ref: yes)
No 1.02 1.00–1.03 0.021 1.03 1.01–1.04 0.002 1.04 1.02–1.06 <0.001
Comorbid disease (Ref: normal)
Hypertension 0.99 0.98–1.01 0.452 0.97 0.95–0.99 0.001 0.94 0.92–0.97 <0.001
Diabetes mellitus 1.21 1.18–1.24 <0.001 1.30 1.26–1.33 <0.001 1.43 1.38–1.48 <0.001
CCI score (Ref: 0)
1 0.97 0.96–0.99 <0.001 0.95 0.93–0.96 <0.001 0.93 0.90–0.95 <0.001
≥2 0.92 0.91–0.94 <0.001 0.89 0.87–0.92 <0.001 0.87 0.84–0.89 <0.001
Boldface denotes statistical significance (P<0.05). The multivariate Cox regression analysis was adjusted for sociodemographic and economic factors (sex, age, household income, insurance status, presence of disability), general health status (BMI, smoking, and drinking status), oral health status (periodic dental visits and scaling, brushing before sleep), and comorbid disease (hypertension, diabetes mellitus, and CCI).
HR: hazard ratio, CI: confidence interval, NHIS: National Health Insurance Service, BMI: body mass index, CCI: Charlson comorbidity index.
0 2 4 6 8 10 0.6
1.0
0.4 0.8
0.2
A 2 4 6 8 10 2 4 6 8 10
Sex
Survival probability 0.6
1.0
0.4 0.8
obabilitySurvival pr 0.2 0.6
1.0
0.4 0.8
obabilitySurvival pr 0.2 0
B Age group
Time (yr) Time (yr)
Sociodemographic and economic factors
Time (yr) 0
C Household income
0 2 4 6 8 10
0.6 1.0
0.4 0.8
0.2
D 2 4 6 8 10
Insurance status
Survival probability 0.6
1.0
0.4 0.8
obabilitySurvival pr 0.2 0
E Presence of disability
Time (yr) Time (yr)
First quintile Second quintile Third quintile Fourth quintile Fifth quintile MaleFemale
40–49 years 50–59 years 60–69 years 70–79 years
NHIS (employees)
NHIS (self-employed) None
Present
0 2 4 6 8 10
0.6 1.0
0.4 0.8
0.2
F 2 4 6 8 10 2 4 6 8 10
Body mass index
Survival probability 0.6
1.0
0.4 0.8
obabilitySurvival pr 0.2 0.6
1.0
0.4 0.8
obabilitySurvival pr 0.2 0
G Smoking status
Time (yr) Time (yr) Time (yr)
0
H Drinking status
General health status
≥25 (Obese) 23–24 (Overweight) 18.5–23 (Normal)
<18.5 (Underweight)
<3 times/week
≥3 times/week Non/former smoker None
Current smoker
Comorbid disease
0 2 4 6 8 10
0.6 1.0
0.4 0.8
0.2
L 2 4 6 8 10 2 4 6 8 10
Hypertension
Survival probability 0.6
1.0
0.4 0.8
obabilitySurvival pr 0.2 0.6
1.0
0.4 0.8
obabilitySurvival pr 0.2 0
M Diabetes mellitus
Time (yr) Time (yr) Time (yr)
0
N Charlson comorbidity index
Score 0 Score 1 Score ≥2
NoYes No
Yes
Oral health status
0 2 4 6 8 10
0.6 1.0
0.4 0.8
0.2
I 2 4 6 8 10 2 4 6 8 10
Periodic dental visits
Survival probability 0.6
1.0
0.4 0.8
obabilitySurvival pr 0.2 0.6
1.0
0.4 0.8
obabilitySurvival pr 0.2 0
J Periodic scaling
Time (yr) Time (yr) Time (yr)
0
K Brushing before sleep
NoYes No
Yes No
Yes
Figure 2. The cumulative incidence of tooth loss was estimated using the Kaplan-Meier method.
DISCUSSION
Epidemiological studies have reported significant differences in the accessibility of dental care services depending on variables including sex, age, household income, education level, insurance status, physical or mental disability, dental compliance and health status, and comorbidities, which are closely related to tooth loss [12,13]. In particular, chronic and severe periodontal disease and DM were found to be the primary causes of the loss of multiple teeth in elderly patients [14,15]. The results of the present study confirmed these previous findings and suggestions.
Women had a significantly lower risk of losing ≥4 teeth than men. This may reflect both the protective effects of estrogens on the alveolar bone and differences in attitudes toward oral health care [16,17]. The fifth (highest) quintile had a lower frequency of tooth loss than the first quintile, which is also in agreement with previous studies. This discrepancy can be explained by the tendency for economic and social stability to facilitate more attention and treatment opportunities for oral conditions [9,18].
In terms of oral health status, periodic dental visits, annual periodontal scaling, and tooth brushing before sleep showed statistically significant associations with tooth loss.
Participants who did not receive periodic periodontal scaling and who did not regularly brush their teeth before sleep showed higher risks of tooth loss, whereas those who did not visit the dentist regularly had a lower risk of tooth loss, with an especially low risk of experiencing a loss of ≥4 teeth. Previous studies have reported that the act of visiting a dental clinic itself is closely associated with tooth loss. Furthermore, better access to dental care services both decreases tooth loss and improves oral hygiene [9].
Numerous studies have reported that high levels of alcohol intake increase the risk of periodontal disease [19,20]. Excessive drinking suppresses various immune responses, thereby increasing the incidence of infectious diseases [21]. Moreover, alcohol can also interfere with protein metabolism and tissue healing, stimulate bone resorption, and exert toxic effects directly on the periodontal tissues [22]. However, controversy remains regarding the direct association between the amount and frequency of drinking and tooth loss. In the present study, an association between drinking frequency and tooth loss could not be confirmed [23].
The accumulation of glucose-mediated advanced glycation end products due to DM promotes the proliferation of periodontal pathogens, including Porphyromonas gingivalis, Treponema denticola, and Prevotella intermedia. Smoking also creates a favorable environment for the growth of periodontal pathogens by interfering with blood flow and lowering the oxygen density in the periodontal pocket [24,25]. An increase in the number of obligate anaerobic bacteria triggers a hyper-inflammatory response and increased secretion of inflammatory-mediated cytokines with acute-phase proteins, including C-reactive protein, interleukin-6, and tumor necrosis factor alpha. These changes in periodontal tissue cause the destruction of tooth- supporting periodontal tissue and increase the probability of tooth loss [26-28].
Many studies have reported uncontrolled DM, regardless of type and smoking status (including former smokers), to be a major risk factor responsible for at least a 2-fold increase in the risk of tooth loss [29,30]. The findings of the present study also confirmed that DM and smoking were closely associated with tooth loss, with 1.43-fold (95% CI, 1.38–1.48; P<0.001)
and 1.69-fold (95% CI, 1.65–1.73; P<0.001) increased risks of experiencing the loss of ≥4 teeth, respectively. Patel et al. [31] reported that patients with DM had a significantly higher number of missing teeth compared to healthy people and Taylor et al. [32] also reported more tooth loss in patients with DM.
Obesity is a chronic metabolic disorder in which various cytokines and hormones secreted from adipose tissues are involved in systemic inflammatory processes [33]. Previous studies using data from the National Health and Nutrition Examination Survey (NHANES) showed that a higher BMI was associated with a higher prevalence of periodontal disease [34,35].
The combined effects of the 5 factors associated with metabolic syndrome—excess body fat around the waist, abnormal cholesterol or triglyceride levels, and high blood pressure and glucose levels—increased the risk of periodontal disease and tooth loss [36,37].
The CCI considers 17 systemic diseases and assigns scores (1–6 points) according to the severity and mortality risk of those conditions, making it a useful tool to assess the overall severity of systemic diseases. In the present study, participants with higher CCI scores showed a lower risk of tooth extraction, which is inconsistent with previous studies reporting that people with more severe disabilities or systemic diseases have poorer oral care and hygiene [38,39]. Selection bias may have resulted from limiting the participant population of the present study to those who received general and oral health screenings.
This interpretation is supported by the consistent observation of low HRs for experiencing tooth loss among those with a low household income, physical and mental disability, and less access to medical and dental care services [11].
The multiple variables that have an impact on tooth loss represent a complex interaction between biological and social factors. Previous studies have shown that adequate oral health control reduces tooth loss compared to otherwise, but this study showed a different result. As dental implants have become widely accepted and more common in recent years, and have been included in DHIC, the number of cases involving tooth extraction and dental implant placement has increased significantly. Therefore, when interpreting tendencies of tooth loss, changes in dental healthcare policies must be carefully considered. However, there are no data about the number of implants installed during the time period analyzed in this study, for which reason we could not investigate implant placement in this study. Further study is needed.
Tooth loss can have impact on patients' quality of life, including factors such as chewing, appearance, and speaking. For instance, Joshipura et al. [40] proposed that tooth loss might cause changes in patients' diet, such as reduced fiber intake, which might increase the risk of cardiovascular disease. Our study provides evidence of associations between health status and tooth loss, even though the biological and/or pathological mechanisms underneath these associations remain unclear. This result underscores the principle that the role of teeth in health should not be overlooked.
Lastly, this study has several limitations. First, unlike the NHANES, there was no direct calibration training for the medical doctors and dentists performing general and oral examinations and questionnaire surveys. Accordingly, intra and inter-examiner reliability and repeatability were not assessed; therefore, the possibility of underestimation or overestimation should be considered in the interpretation of the clinical parameters.
Second, because tooth loss was reviewed and selected based on prescription codes, we could not identify the specific causes of tooth loss (e.g., caries, trauma, orthodontic treatment,
prosthodontic treatment, endodontic treatment, and periodontal disease). The factors affecting tooth loss may be diverse, ranging from genetic reasons to improper habits. It is difficult to elucidate the influence of a single factor in tooth loss, since tooth loss is caused by the complex interactions of multiple factors. Thus, this study alone has limitations in assessing the impact of health status on tooth loss. Moreover, another major limitation of the present study was the fact that the severity and type of comorbidities—especially the severity of DM and its associated complications—were not assessed because insufficient data were present in the medical records. Further interventional and observational studies should assess other diabetes-related measures related to oral health. Despite continuous population-level improvements in oral health and environmental conditions, more than 51%
of participants had experienced the loss of 1 or more teeth. The findings of this study also confirmed that various health status variables, especially DM and smoking, were significantly associated with tooth loss.
REFERENCES
1. Petersen PE. World Health Organization global policy for improvement of oral health--World Health Assembly 2007. Int Dent J 2008;58:115-21.
PUBMED | CROSSREF
2. Choi JK, Kim YT, Kweon HI, Park EC, Choi SH, Lee JH. Effect of periodontitis on the development of osteoporosis: results from a nationwide population-based cohort study (2003–2013). BMC Womens Health 2017;17:77.
PUBMED | CROSSREF
3. Lee JH, Kweon HH, Choi JK, Kim YT, Choi SH. Association between periodontal disease and prostate cancer: results of a 12-year longitudinal cohort study in South Korea. J Cancer 2017;8:2959-65.
PUBMED | CROSSREF
4. N'gom PI, Woda A. Influence of impaired mastication on nutrition. J Prosthet Dent 2002;87:667-73.
PUBMED | CROSSREF
5. Mealey BL. Periodontal disease and diabetes. A two-way street. J Am Dent Assoc 2006;137 Suppl:26S-31S.
PUBMED | CROSSREF
6. Lee JH, Jeong SN, Choi SH. Predictive data mining for diagnosing periodontal disease: the Korea National Health and Nutrition Examination Surveys (KNHANES V and VI) from 2010 to 2015. J Public Health Dent 2018;79:44-52.
PUBMED | CROSSREF
7. Lee JH, Lee JS, Park JY, Choi JK, Kim DW, Kim YT, et al. Association of lifestyle-related comorbidities with periodontitis: a nationwide cohort study in Korea. Medicine (Baltimore) 2015;94:e1567.
PUBMED | CROSSREF
8. Lee JH, Lim NK, Cho MC, Park HY. Epidemiology of heart failure in Korea: present and future. Korean Circ J 2016;46:658-64.
PUBMED | CROSSREF
9. Lee JH, Oh JY, Choi JK, Kim YT, Park YS, Jeong SN, et al. Trends in the incidence of tooth extraction due to periodontal disease: results of a 12-year longitudinal cohort study in South Korea. J Periodontal Implant Sci 2017;47:264-72.
PUBMED | CROSSREF
10. Lee JH, Lee JS, Choi JK, Kweon HI, Kim YT, Choi SH. National dental policies and socio-demographic factors affecting changes in the incidence of periodontal treatments in Korean: a nationwide population- based retrospective cohort study from 2002-2013. BMC Oral Health 2016;16:118.
PUBMED | CROSSREF
11. Lee JH, Choi JK, Jeong SN, Choi SH. Charlson comorbidity index as a predictor of periodontal disease in elderly participants. J Periodontal Implant Sci 2018;48:92-102.
PUBMED | CROSSREF
12. Reisine ST, Psoter W. Socioeconomic status and selected behavioral determinants as risk factors for dental caries. J Dent Educ 2001;65:1009-16.
PUBMED
13. Petersen PE. Sociobehavioural risk factors in dental caries - international perspectives. Community Dent Oral Epidemiol 2005;33:274-9.
PUBMED | CROSSREF
14. Tonetti MS, Muller-Campanile V, Lang NP. Changes in the prevalence of residual pockets and tooth loss in treated periodontal patients during a supportive maintenance care program. J Clin Periodontol 1998;25:1008-16.
PUBMED | CROSSREF
15. Lee JH, Oh JY, Youk TM, Jeong SN, Kim YT, Choi SH. Association between periodontal disease and non- communicable diseases: a 12-year longitudinal health-examinee cohort study in South Korea. Medicine (Baltimore) 2017;96:e7398.
PUBMED | CROSSREF
16. Meisel P, Reifenberger J, Haase R, Nauck M, Bandt C, Kocher T. Women are periodontally healthier than men, but why don't they have more teeth than men? Menopause 2008;15:270-5.
PUBMED | CROSSREF
17. Russell SL, Gordon S, Lukacs JR, Kaste LM. Sex/Gender differences in tooth loss and edentulism:
historical perspectives, biological factors, and sociologic reasons. Dent Clin North Am 2013;57:317-37.
PUBMED | CROSSREF
18. Bernabé E, Marcenes W. Income inequality and tooth loss in the United States. J Dent Res 2011;90:724-9.
PUBMED | CROSSREF
19. Pitiphat W, Merchant AT, Rimm EB, Joshipura KJ. Alcohol consumption increases periodontitis risk. J Dent Res 2003;82:509-13.
PUBMED | CROSSREF
20. Hach M, Holm-Pedersen P, Adegboye AR, Avlund K. The effect of alcohol consumption on periodontitis in older Danes. Int J Dent Hyg 2015;13:261-7.
PUBMED | CROSSREF
21. Reynolds MA. Modifiable risk factors in periodontitis: at the intersection of aging and disease.
Periodontol 2000 2014;64:7-19.
PUBMED | CROSSREF
22. Tezal M, Grossi SG, Ho AW, Genco RJ. The effect of alcohol consumption on periodontal disease. J Periodontol 2001;72:183-9.
PUBMED | CROSSREF
23. Susin C, Wagner MC, Haas AN, Oppermann RV, Albandar JM. The association between alcohol consumption and periodontitis in southern Brazilian adults. J Periodontal Res 2015;50:622-8.
PUBMED | CROSSREF
24. Agnihotri R, Gaur S. Implications of tobacco smoking on the oral health of older adults. Geriatr Gerontol Int 2014;14:526-40.
PUBMED | CROSSREF
25. Khader YS, Dauod AS, El-Qaderi SS, Alkafajei A, Batayha WQ. Periodontal status of diabetics compared with nondiabetics: a meta-analysis. J Diabetes Complications 2006;20:59-68.
PUBMED | CROSSREF
26. Kaur G, Holtfreter B, Rathmann W, Schwahn C, Wallaschofski H, Schipf S, et al. Association between type 1 and type 2 diabetes with periodontal disease and tooth loss. J Clin Periodontol 2009;36:765-74.
PUBMED | CROSSREF
27. Lalla E, Papapanou PN. Diabetes mellitus and periodontitis: a tale of two common interrelated diseases.
Nat Rev Endocrinol 2011;7:738-48.
PUBMED | CROSSREF
28. Scannapieco FA. Position paper of the American Academy of Periodontology: periodontal disease as a potential risk factor for systemic diseases. J Periodontol 1998;69:841-50.
PUBMED
29. Taylor GW. Bidirectional interrelationships between diabetes and periodontal diseases: an epidemiologic perspective. Ann Periodontol 2001;6:99-112.
PUBMED | CROSSREF
30. Calsina G, Ramón JM, Echeverría JJ. Effects of smoking on periodontal tissues. J Clin Periodontol 2002;29:771-6.
PUBMED | CROSSREF
31. Patel MH, Kumar JV, Moss ME. Diabetes and tooth loss: an analysis of data from the National Health and Nutrition Examination Survey, 2003–2004. J Am Dent Assoc 2013;144:478-85.
PUBMED | CROSSREF
32. Taylor GW, Manz MC, Borgnakke WS. Diabetes, periodontal diseases, dental caries, and tooth loss: a review of the literature. Compend Contin Educ Dent 2004;25:179-84, 86-8, 90.
PUBMED
33. Pischon N, Heng N, Bernimoulin JP, Kleber BM, Willich SN, Pischon T. Obesity, inflammation, and periodontal disease. J Dent Res 2007;86:400-9.
PUBMED | CROSSREF
34. Al-Zahrani MS, Bissada NF, Borawskit EA. Obesity and periodontal disease in young, middle-aged, and older adults. J Periodontol 2003;74:610-5.
PUBMED | CROSSREF
35. Wood N, Johnson RB, Streckfus CF. Comparison of body composition and periodontal disease using nutritional assessment techniques: Third National Health and Nutrition Examination Survey (NHANES III). J Clin Periodontol 2003;30:321-7.
PUBMED | CROSSREF
36. Baek HJ, Lee SG, Song KB, Kwon HJ. The association of metabolic syndrome and periodontitis in Korean adult population. J Korean Acad Oral Health 2010;34:338-45.
37. Shimazaki Y, Saito T, Yonemoto K, Kiyohara Y, Iida M, Yamashita Y. Relationship of metabolic syndrome to periodontal disease in Japanese women: the Hisayama Study. J Dent Res 2007;86:271-5.
PUBMED | CROSSREF
38. Faulks D, Hennequin M. Evaluation of a long-term oral health program by carers of children and adults with intellectual disabilities. Spec Care Dentist 2000;20:199-208.
PUBMED | CROSSREF
39. Altun C, Guven G, Akgun OM, Akkurt MD, Basak F, Akbulut E. Oral health status of disabled individuals attending special schools. Eur J Dent 2010;4:361-6.
PUBMED
40. Joshipura KJ, Douglass CW, Willett WC. Possible explanations for the tooth loss and cardiovascular disease relationship. Ann Periodontol 1998;3:175-83.
PUBMED | CROSSREF