DOI : 10.3341/jkos.2009.50.5.710
= 증례보고 = 접수번호 : 50-05-10-06
정상인에서 시간 도메인과 스펙트럼 도메인 빛간섭단층촬영으로 측정한 황반두께 측정의 반복성 및 일치도
오세범⋅조원빈⋅문준웅⋅김형찬 건국대학교 의학전문대학원 안과학교실
목적: 정상인에서 time domain (TD) OCT와 spectral domain (SD) OCT로 황반두께를 측정해 그 반복성과 일치도를 비교해 보고자 하였다.
대상과 방법: 정상인 34안을 대상으로 TD OCT와 SD OCT로 3회 연속 황반두께와 총황반부피를 측정해 비교하였다. 개체 내 표준편차, 변동계수, 급내상관계수로 반복성을 알아보았고, Bland Altman plot으로 두 OCT의 일치도를 평가하였다. 또한 Pearson 상관계수 및 다중회기분석을 통해 두 OCT 사이의 상관관계에 대해서도 알아보았다.
결과: TD OCT와 SD OCT로 측정한 중심와두께, 총황반두께, 총황반부피의 개체 내 표준편차는 각각 11.53 μm/6.69 μm, 7.58 μm/2.55 μm, 0.48 mm3/0.09 mm3로 SD OCT에서 유의하게 낮았다. 변동계수와 급내상관계수는 TD OCT에서 각각 1.10~2.78%, 0.78~0.96%이었고, SD OCT에서 각각 0.29~0.94%, 0.92~0.99%이었다. 중심와두께, 총황반두께, 총황반부피의 95% 일치도 범위는 각각 67.94 μm, 29.01 μm, 0.98 mm3이었다. 두 OCT 사이의 모든 황반두께와 총황반부피는 통계적으로 유의한 상관관계를 보였다.
결론: 두 OCT 모두 황반두께 측정에서 높은 신뢰성을 보이나, SD OCT에서 더 높은 반복성을 보였다. 두 OCT로 측정한 황반두께는 측정기준의 차이 때문에 낮은 일치도를 보여 상호 교환적이지 못하나 유의한 상관관계를 보였다.
<대한안과학회지 2009;50(5):710-716>
■ 접 수 일: 2008년 10월 10일 ■ 심사통과일: 2009년 1월 14일
■ 통 신 저 자: 김 형 찬
서울시 광진구 화양동 4-12 건국대학교병원 안과
Tel: 02-2030-5270, Fax: 02-2030-5273 E-mail: [email protected]
황반질환에서 황반두께를 측정하는 것은 진단과 치료 후 효과를 판정하는 데 매우 중요하다. 황반두께를 측정하는 방법으로 세극등현미경을 이용한 안저검사, 형광안저혈관 조영술 등 여러 가지가 있으나 안저검사의 경우 검사자의 주관이 많이 개입되며 형광안저혈관조영술은 형광누출의 확인에는 유용하지만 황반두께를 객관적으로 측정할 수 없 다는 단점이 있다.1,2 이러한 단점을 보완하기 위해 개발된 장비로 망막두께분석기(retinal thickness analyzer, RTA)와 빛간섭단층촬영(optical coherence tomography, OCT)이 있다. RTA의 경우 50 μm의 비교적 높은 해상도 황반두께 측정이 가능하나 안축장의 길이와 굴절력에 의해 측정값에 오차가 발생할 수 있다.3 이에 비해 OCT는 민감도가 매우 높고 해상력이 높아 망막의 여러 층을 정확히 알 수 있으며, 정량적인 측정이 가능하여 황반질환 진단에 가장 널리 쓰 이고 있는 장비이다.4,5
지금까지도 널리 쓰이고 있는 time domain (TD) OCT는 10 μm의 axial 해상도를 가지고 초당 400 A–scan의 속도를 보이는 반면, 최근 개발된 spectral domain (SD) OCT는 5 μm의 고해상도를 가지고 초당 20,000 이상의 A–scan 속
도를 갖고 있다. 작동원리는 두 OCT가 비슷하지만, TD OCT 는 망막 두께정보를 reference mirror가 움직이면서 시간에 따른 신호를 측정해 속도가 느리나, SD OCT는 reference mirror가 고정되어 있으며 간섭계(interferometer)에서 나온 light spectrum이 동시에 분광계(spectrometer)에 의해 탐 지된 후 푸리에 변환(Fourier transform)에 의해 망막의 두 께 정보를 측정하게 된다. 또한 황반을 가로지르는A scan의 스캔 배열(array)에 차이가 있는데, TD OCT는 황반 중심 을 가로지르는 방사상의 6개 선형을 따라 표본 추출을 하기 때문에 전체 황반의 5%만 측정이 가능하며, 이런 문제점을 보완하기 위해 황반의 해부학적 특성에 의존하여 황반두께 정보를 외삽법(extrapolation)으로 추정하게 된다. 이에 비 해 SD OCT는 황반 주위를 격자 모양으로 고르게 분배해 수평 주사선을 화면의 위에서부터 아래로 내려가면서 옆으 로 끌듯이 한 줄씩 주사하여 화면을 형성하는 래스터 주사 (raster scan)으로 더 많은 표본 추출을 할 수 있으며 이런 차이로 SD OCT는 TD OCT에 비해 망막 내 구조를 더 자 세하게 보여줄 수 있다.6,7 그러나 SD OCT의 빠른 속도와 높은 해상도가 황반두께 측정에 있어 더 높은 신뢰도를 보 일지에 대한 정량적 평가는 아직까지 정확하게 이루어지지 않았다.
반복성이란 한 사람이 같은 측정 장비를 이용하여 동일 한 대상을 여러 번 측정했을 때 얼마나 같은 결과를 보일 수 있는지를 알 수 있는 지표로서, 임상에 있어 어떤 측정
장비의 반복성은 그 결과에 대한 해석에 많은 영향을 미칠 수 있다. 따라서 본 연구의 목적은 정상인에서 TD OCT와 SD OCT로 측정한 황반두께와 총황반부피를 비교하여 이 들의 반복성(repeatability)과 일치도(agreement)를 알아 보고자 하는데 있다.
대상과 방법
이번 연구에 자원한 피검자 중 신체 건강한 정상 성인 34 명을 대상으로 하였다. 대상인의 기준은 특별한 전신 및 안 과적 질환이 없고, 안과 수술의 기왕력이 없으며 최대교정 시력이 0.8 이상이고, 안압은 정상범위 이내이며, 굴절이상은 –3.0에서 +3.0D 이내이고, 안저검사에서 정상인 경우로 하 였다. 황반질환의 임상적 소견이 있거나 과거에 굴절수술을 한 경우, 신경학적 질환이나 당뇨와 고혈압이 있는 경우는 제외하였다.
황반두께는 무작위로 한쪽 눈을 선택해 비산동 상태에서 단일 검사자에 의해 3회 연속적으로 TD OCT 및 SD OCT를 이용하여 측정하였다. 그리고 두 OCT의 측정 시 피검자에게 검사기구에 대한 설명 없이 하는 단순맹검법으로 연구를 진행하였다. TD OCT는 Stratus OCT (Carl Zeiss Meditec, Dublin, CA, USA)를 사용하였다. 황반두께는 중심와를 지 나는 6개의 6 mm 길이의 선형스캔이 30° 간격으로 방사상 주사를 하는 fast macular map을 이용하였으며, 황반두께 지도(macular thickness map)로 분석하였다. 황반두께지 도는 중심와를 중심으로 직경 1 mm 이내의 중심원과 3 mm 의 안쪽원, 그리고 6 mm의 바깥쪽원으로 구성되며, 안쪽원과 바깥쪽원은 상측, 비측, 하측, 이측의 4분역으로 나누어 모두 9개의 구역이 된다. 측정된 값은 retinal thickness analysis system을 통해 분석하였다. 그리고 좋은 상을 얻기 위해 모든 scan은 적어도 7 이상의 signal strength를 보인 것만을 선택 하였다. SD OCT는 Spectralis OCT (HeidelbergEngineer- ing, Dossenheim, Germany)를 사용하였다. Spectralis OCT 는 광원으로 50 nm의 bandwidth와 840 nm의 파장을 가진 다이오드 레이저를 사용하고, 초당 40,000개의 A–scan을 조사한다. 황반두께 측정은 래스터 주사(raster scan) 방식 으로 황반을 중심으로 수평, 수직이 각각 768 pixel (9.2 mm)×
496 pixel (1.9 mm)인 scan 방식으로 이루어졌다. Spectralis OCT는Stratus OCT에서와 같이 직경 1, 3, 6 mm의 동심 원을 9개 분역으로 나누어 분석하였고, 좋은 상을 얻기 위해 모든이미지는 제조사에서 권장한 16dB 이상보다 더 높은 27dB 이상의 signal strength를 보인 것만을 선택하였다
통계적 분석은 SPSS version 15.0 (SPSS Inc, Chicago, III) 을사용하였다. 두 OCT의 측정치는 반복성(repeatability)을
평가하기 위해 개체내 표준편차[2.77×within subject standa- rd deviation (Sw)], 변동계수(coefficient of variation, CVw) [100×Sw/overall mean], 급내상관계수(intraclass corre- lation coefficient, ICC)를 계산하여 비교하였다. 일치도를 평가하기위해 Bland and Altman plots을 이용하였다.8 그 리고 Pearson상관계수 및 다중회기분석(multiple regre- ssion analysis)을통해 두 OCT 사이의 상관관계에 대해 서도 알아보았다.
자료 값과 평균 차이 값의 제곱의 합을 도수의 합으로 나 눈 것이 분산이며, 이것의 제곱근이 표준편차이다. 표준편차 는 절대치 크기로 표현되기 때문에 데이터의 단위가 서로 다 른 값들의 산포도를 비교할 수 없으며 또한 평균이 다르면 산포도의 정도를 비교하기 곤란한 경우가 있다. 이러한 경우 단위에 영향을 받지 않는 변동계수, 즉, 표준편차를 평균으로 나눈 값을 사용함으로써 산포도, 즉 데이터의 퍼짐 정도를 알 수 있다. 변동계수는 값이 작을수록 산포가 크지 않고 특 성의 차이가 없는 균일한 것을 의미하게 된다. 급내상관계수 (ICC)는 개체 간 분산(inter–subject variance)을 개체 간 분산에 개체 내 분산(within subject variance)을 더한 총분 산(total variance)으로 나눈 값으로서, 반복적인 측정의 일치 정도를 설명하는 값으로 1에 가까울수록 높은 반복성을 나타 낸다. 두 OCT에 의해 측정된 황반두께와 총황반부피의 개체 내 분산은 log화된 데이터로 전환한 후 paired t–test로 비교 하였다.9 모든 통계적인 유의성은 p<0.05 미만으로 하였다.
결 과
대상인 34명 중 남자는 20명(59%)이었고, 평균 연령은 24.6±
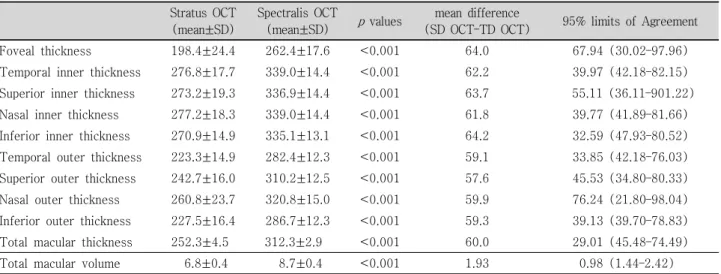
7.23세이었고, 평균 구면렌즈 대응치(spherical equivalent)는 –0.32±0.43D이었다. TD OCT의 signal strength에 해당하 는 평균 이미지 질 값(image quality score)은 7.4±0.62이 었고, SD OCT는 28.02±0.73dB이었다. 두 OCT에 의해 측 정된 중심와두께(foveal thickness)는 각각 198.4±24.4 μm와 262±17.6 μm이었고, 총황반두께(total macular thickness) 는 각각 252.3±4.5 μm와 312.3±2.9 μm, 총황반부피(total macular volume)는 각각 6.8±0.4 mm3와 8.7±0.4 mm3이었 으며, SD OCT로 측정한 전체 및 구역별 황반두께와 총황반 부피는 TD OCT로 측정한 것보다 통계적으로 유의하게 높은 값을 보였다(Table 1).
표 2는 두 OCT로 측정한 황반두께와 총황반부피에 대한 개체 내 표준편차, 변동계수, 급내상관계수를 보여주고있다.
TD OCT와 SD OCT로 측정한 중심와두께, 총황반두께, 총 황반부피의 개체내 표준편차는 각각 11.53 μm/6.69 μm, 7.58 μm/2.55 μm, 0.48 mm3/0.09 mm3로 SD OCT에서 높
Stratus OCT (mean±SD)
Spectralis OCT
(mean±SD) pvalues mean difference
(SD OCT–TD OCT) 95% limits of Agreement
Foveal thickness 198.4±24.4 262.4±17.6 <0.001 64.0 67.94 (30.02–97.96)
Temporal inner thickness 276.8±17.7 339.0±14.4 <0.001 62.2 39.97 (42.18–82.15) Superior inner thickness 273.2±19.3 336.9±14.4 <0.001 63.7 55.11 (36.11–901.22) Nasal inner thickness 277.2±18.3 339.0±14.4 <0.001 61.8 39.77 (41.89–81.66) Inferior inner thickness 270.9±14.9 335.1±13.1 <0.001 64.2 32.59 (47.93–80.52) Temporal outer thickness 223.3±14.9 282.4±12.3 <0.001 59.1 33.85 (42.18–76.03) Superior outer thickness 242.7±16.0 310.2±12.5 <0.001 57.6 45.53 (34.80–80.33) Nasal outer thickness 260.8±23.7 320.8±15.0 <0.001 59.9 76.24 (21.80–98.04) Inferior outer thickness 227.5±16.4 286.7±12.3 <0.001 59.3 39.13 (39.70–78.83) Total macular thickness 252.3±4.5 312.3±2.9 <0.001 60.0 29.01 (45.48–74.49) Total macular volume 6.8±0.4 8.7±0.4 <0.001 1.93 0.98 (1.44–2.42)
Table 2.Within–subject standard deviation (Sw), coefficient of variation (CVw), and intraclass correlation coefficient (ICC) of total and regional macular thicknesses obtained with time domain OCT and spectral domain OCT
Foveal thickness
Temporal Inner Thickness
Superior Inner Thickness
Nasal Inner Thickness
Inferior Inner Thickness
Temporal Outer Thickness
Superior Outer Thickness
Nasal Outer Thickness
Inferior Outer Thickness
Total macular Thickness
Total volume
Sw TD OCT 11.53 14.55 21.06 17.03 15.82 12.94 14.05 16.09 12.89 7.58 0.48
SD OCT 6.69 7.54 3.81 7.54 3.69 7.47 5.07 6.96 7.73 2.55 0.09
CVw TD OCT 2.13 1.92 2.78 2.25 2.12 2.16 2.13 2.23 2.05 1.10 2.53
SD OCT 0.90 0.78 0.40 0.78 0.39 0.94 0.60 0.78 0.97 0.29 0.36
ICC TD OCT 0.957 0.871 0.777 0.839 0.788 0.854 0.851 0.910 0.879 0.942 0.703
SD COT 0.976 0.947 0.986 0.947 0.985 0.930 0.969 0.961 0.923 0.991 0.992
pvalues* <0.001 <0.001 <0.001 <0.001 <0.001 <0.001 <0.001 <0.001 <0.001 <0.001 <0.001
*Comparison of within–subject variances between Stratus OCT and Spectralis OCT (paired t test on log–transformed data).
Table 1.Comparison of regional and total macular thicknesses measured by spectral domain and time domain optical coherence tomography
Figure 1.Bland‐Altman plots of foveal thickness measurements obtained by Stratus OCT and Spectralis OCT. Solid line indicates the average mean difference, while dotted lines delineates the 95% confidence limits of agreement.
은 반복성을 보였다. SD OCT의 변동계수는 모든 황반두께 측정치와 총황반부피에서 TD OCT보다 낮게 나타났다. SD OCT는 중심와두께에서 0.90%의 변동계수로 6.69 μm의 반복성을 보였다. 이는 SD OCT인 Sprectralis OCT로 측정 했을 때 중심와두께의 전체 평균의 차이는 95%의 신뢰구 간에서 6.69 μm보다 작다는 것을 의미한다. 급내상관계수 에서도 TD OCT에서 총황반부피는 0.703이었고, 황반두께는 0.777 (superior inner thickness)~0.957 (foveal thickness) 의범위를 보였으나, SD OCT에서 총황반부피는 0.992이 었고, 황반두께는 0.923 (inferior outer thickness)~0.991 (total macular thickness) 범위의 값을 보여 높은 반복성 을 보였다. 또한 두 OCT 사이의 모든 황반두께 측정치와 총황반부피의 개체 내 분산은 SD OCT에서 통계적으로 유 의하게 낮았다(p<0.001).
중심와두께, 총황반두께, 총황반부피에 대한 95%의 일치 도 범위는 각각 67.94 μm, 29.01 μm, 0.98 mm3이었다(Fig.
1, 2, 3). 두 OCT에 대한 95%의 일치도 범위는 d-1.96s에 서d+1.96s [d; SD OCT 평균값 -TD OCT 평균값, s; 표
Figure 2. Bland‐Altman plots of total macular thickness obtained by Stratus OCT and Spectralis OCT. Solid line indicates the average mean difference, while dotted lines delineates the 95% confidence limits of agreement.
Figure 3. Bland‐Altman plots of total macular volume obtained by Stratus OCT and Spectralis OCT. Solid line indicates the average mean difference, while dotted lines delineates the 95% confidence limits of agreement.
Table 3.Pearson correlation coefficient of macular thicknesses and total macular volume obtained with time domain OCT and spectral domain OCT
Fovealt thickness
Temporal Inner Thickness
Superior Inner Thickness
Nasal Inner Thickness
Inferior Inner Thickness
Temporal Outer Thickness
Superior Outer Thickness
Nasal Outer Thickness
Inferior Outer Thickness
Total macular Thickness
Total volume Pearson
correlation coefficient
0.686 0.752 0.595 0.752 0.742 0.739 0.629 0.536 0.725 0.820 0.708
pvalues* <0.001 <0.001 <0.001 <0.001 <0.001 <0.001 <0.001 <0.001 <0.001 <0.001 <0.001
*Pearson’s correlation coefficient between Stratus OCT and Spectralis OCT.
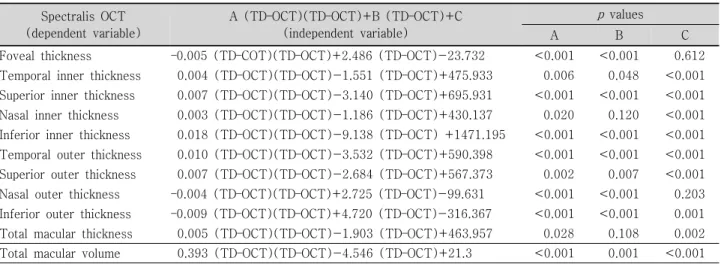
Table 4. Multiple regression analysis between time domain OCT and spectral domain OCT Spectralis OCT
(dependent variable)
A (TD–OCT)(TD–OCT)+B (TD–OCT)+C (independent variable)
p values
A B C
Foveal thickness –0.005 (TD–COT)(TD–OCT)+2.486 (TD–OCT)-23.732 <0.001 <0.001 0.612 Temporal inner thickness 0.004 (TD–OCT)(TD–OCT)-1.551 (TD–OCT)+475.933 0.006 0.048 <0.001 Superior inner thickness 0.007 (TD–OCT)(TD–OCT)-3.140 (TD–OCT)+695.931 <0.001 <0.001 <0.001 Nasal inner thickness 0.003 (TD–OCT)(TD–OCT)-1.186 (TD–OCT)+430.137 0.020 0.120 <0.001 Inferior inner thickness 0.018 (TD–OCT)(TD–OCT)-9.138 (TD–OCT) +1471.195 <0.001 <0.001 <0.001 Temporal outer thickness 0.010 (TD–OCT)(TD–OCT)-3.532 (TD–OCT)+590.398 <0.001 <0.001 <0.001 Superior outer thickness 0.007 (TD–OCT)(TD–OCT)-2.684 (TD–OCT)+567.373 0.002 0.007 <0.001 Nasal outer thickness –0.004 (TD–OCT)(TD–OCT)+2.725 (TD–OCT)-99.631 <0.001 <0.001 0.203 Inferior outer thickness –0.009 (TD–OCT)(TD–OCT)+4.720 (TD–OCT)-316.367 <0.001 <0.001 0.001 Total macular thickness 0.005 (TD–OCT)(TD–OCT)-1.903 (TD–OCT)+463.957 0.028 0.108 0.002 Total macular volume 0.393 (TD–OCT)(TD–OCT)-4.546 (TD–OCT)+21.3 <0.001 0.001 <0.001 준편차]이므로, 중심와두께에서 두 OCT 평균값 차이의 95%
일치도 범위는 40.02 μm에서 107.96 μm까지이다(Fig. 1, Table 1).
두 OCT로 측정한 황반두께 측정값 사이의 상관관계를 알아보기 위한 Pearson 상관계수는 총황반두께(0.820)에서 가장 높았고, 바깥쪽원의 비측(0.536)에서 가장 낮았다.
그리고 두 OCT 사이의 모든 황반두께와 총황반부피의 상
관계수는 통계적으로 유의하였다(p<0.001, Table 3). 그리 고 다중회기분석을 통한 SD–OCT 및 TD–OCT 측정치 사이의 상관관계를 알아본 결과, Spectralis thickness=A (Stratus thickness)(Stratus thickness)+B (Stratus thickness)+C 이란 공식을 구할 수 있었다. 이 공식에서 안쪽원의 비측과 총황반두께에서의 상수 B값, 중심와두께와 바깥쪽원의 비 측의 상수 C값을 제외하고 모든 상수는 통계적으로 유의하
였다(Table 4).
고 찰
황반부는 여러 망막질환에서 그 두께의 변화가 나타나며 이러한 황반두께의 변화를 정량적으로 평가하는 것은 시력 예후, 치료시기 판정, 치료효과 평가에 대단히 중요하다. 황 반두께를 측정할 수 있는 방법은 여러 가지가 있으나 현재 가장 널리 쓰이고 있는 것은 빛간섭단층촬영인 OCT이다.
OCT는 비접촉성, 비침습성 영상기술로 초음파 B–scan과 유사하나 음파 대신 적외선 계열의 광선을 사용하며 안 조직 에서 반사되어 나오는 반향반사지연시간(echo delay time) 을 통해 망막의 두께를 정량적으로 측정할 수 있는 진단도구 로서 약 10 μm의 고해상도 단층상을 얻을 수 있다.
일반적으로 변동계수가 10% 미만일 때 신뢰할 수 있는 검사로 인정되며,10,11 TD OCT인 Stratus OCT로 측정한 황반두께가 신뢰할 수 있다는 보고는 많이 있다. Gurses–
Ozden et al은 OCT 검사에서 변동계수가 중심와두께에서 4.7~6.4%이었고, 총황반부피에서는 0.7~1.1%이었다고 보 고하였다.12 Paunescu et al의 연구에서는 전체와 구역별 황반두께의 급내상관계수가 0.55~0.97%의 값을 보였다.13 그리고 Yoon et al의 연구에서는 모든 황반두께 측정치에서 2% 미만의 변동계수를 보였다.14
이번 연구에서 Stratus OCT에서 측정된 황반두께의 변동 계수는 1.01%~2.78%이었고, 급내상관계수는 0.78~0.96%
의 값을 보였다. 이에 비해 Spectralis OCT에서의 변동계수 는 모든 황반두께 측정에서 1% 미만의 값을 보였고, 급내 상관계수는 0.92~0.99%의 값을 보였다.
Spectralis OCT로 측정한 중심와두께, 총황반두께, 총황 반부피는 각각 262±17.6 μm 312.3±2.9 μm, 198.4±24.4 μm, 8.7±0.4 mm3로 Stratus OCT로 측정한 198.4±24.4 μm, 252.3±4.5 μm, 6.8±0.4 mm3에 비해 통계적으로 유의하게 높은 값을 보였다. Spectralis OCT의 황반두께 측정치가 Stratus OCT에 비해 더 높음에도 불구하고 개체 내 분산 (within–subject variances)은 통계적으로 의미 있게 낮았다 (p<0.001). Spectralis OCT의 더 나은 반복성은 훨씬 빨라진 속도와 더 많은 추출 프레임(sampling frame)에 의한 것으로 볼 수 있다.
본 연구에서 전체 및 구역별 황반두께와 총황반부피는 SD OCT에서 통계적으로 유의하게 더 높게 측정되었는데, 그 이유는 황반두께의 측정 기준이 두 OCT가 다르기 때문 이다. Stratus OCT는 황반두께 측정에 있어 유리체–망막면 에서 시세포층의 내/외절 연접부 사이의 거리를 기준으로 하나, Spectralis OCT는 유리체–망막면에서 브루크막을
경계로 하기 때문이다. 즉, 두 OCT 사이의 황반두께의 차이 는황반부의 시세포 외절과 망막색소상피(retinal pigment epithelium, RPE)의 두께에 상응하는 값으로 생각할 수 있 다. 정상안에서 시세포 외절의 길이는 50 μm이고,15RPE의 두께는 11.3 μm 정도로 알려져 있다.16본 연구에서 나타난 두 OCT의 구역별 황반두께 차이는 57.3~64.0 μm로 시세포 외절 길이와 RPE 두께에 상응하는 범위를 보였다. 이처럼 두 OCT는 황반두께를 측정할 때 그 기준면이 다르므로 여 기서 얻은 황반두께의 측정치는 서로 다르며 일치도가 낮을 수밖에 없다. 이는 Stratus OCT에서 측정된 황반두께와 부 피는 Spectralis OCT의 측정결과와 상호 교환될 수는 없다는 것을 의미한다.
그러나 모든 황반두께 및 총황반부피에서 측정한 두 OCT 사이의 Pearson 상관계수는 0.54에서 0.82로서 모두 통계 적으로 유의하였고, 또한 두 측정치 사이의 공식을 구할 수 있었다. 이러한 결과는 두 OCT로 측정했을 때 그 결과들은 직접적으로 상호 교환적이지는 못하지만 공식을 통해 다른 OCT의 측정치를 간접적으로 구할 수 있고, 이를 통해 치료 전 후, 혹은 자연 경과 등 여러 황반질환의 경과관찰 시 황반 두께의 추이를 알아보는 데는 상호 도움이 될 수 있다는 점을 시사한다.
결론적으로 본 연구에서 저자들은 TD OCT인 Stratus OCT와 SD OCT인 Spectralis OCT는 황반두께와 총황반 부피 측정치의 차이가 있음에도 두 OCT 모두 황반부 측정 에 있어 높은 신뢰성을 보였고, SD OCT인 Spectralis OCT는 TD OCT인 Stratus OCT에 비해 더 높은 반복성을 보이며, 상호 교환적이지는 않지만 유의한 상관관계를 보인다는 사 실을 알 수 있었다.
앞으로 저자들은 정상인이 아닌 여러 황반질환 환자들을 대상으로 SD OCT의 임상적인 유용성에 대한 추가적인 연 구를 시행할 예정이다.
참고문헌
1) Zeimer RC, Mori MT, Khoobehi B. Feasibility test of a new method to measure retinal thickness noninvasively. Invest Oph- thalmol Vis Sci 1989;30:2099-105.
2) Gieser JP, Rusin MM, Mori M, et al. Clinical assessment of the macular by retinal topography and thickness mapping. Am J Ophthalmol 1997;124:648-60.
3) Polito A, Shah SM, Haller JA, et al. Comparision between retinal thickness analyzer and optical coherence tomography for assess- ment of foveal thickness in eyes with macular disease. Am J Ophthalmol 2002;134:240-51.
4) Puliafito CA, Hee MR, Schuman JS, et al. Optical coherence tomography of ocular disease. Thorofare, NJ: Slack, 1996;369-74.
5) Muscat S, Parks S, Kemp E, et al. Repeatability and repro-
ducibility of macular thickness measurements with the Humphrey system. Invest Ophthalmol Vis Sci 2002;43;490-5.
6) Hangai M, Ojima Y, Gotoh N, et al. Three-dimensional imaging of macular holes with high-speed optical coherence tomography.
Ophthalmology. 2007;114:763-73.
7) Ahlers C, Michels S, Beckendorf A, et al. Three-dimensional imaging of pigment epithelial detachment in age-related macular degeneration using optical coherence tomography, retinal thickness analysis and topographic angiography. Graefes Arch Clin Exp Ophthalmol 2006;244:1233-9.
8) Bland JM, Altman DG. Statistical methods for assessing agree- ment between two methods of clinical measurement. Lancet 1986;1:307-10.
9) Bland JM. Comparing within-subject variance in a study to compare two methods of measurement. Available at http://www- users.york.ac.uk~/mb55/meas/compsd.pdf.
10) Massin P, Vicaut E, Haouchine B, et al. Reproducibility of retinal mapping using optical coherence tomography. Arch Ophthalmol 2001;119:1135-42.
11) Shrout PE, Fleiss JL. Intraclass correlations: uses in assessing rater reliability. Pshychol Bull 1979:428-9.
12) Gurses-Ozden R, Teng C, Vessani R, et al. Macular and retinal nerve fiber layer thickness measurement reproducibility using optical coherence tomography (OCT-3). J Glaucoma 2004;13:
238-44.
13) Paunescu LA, Schuman JS, Price LL, et al. Reproducibility of nerve fiber thickness, macular thickness, and optic nerve head measurements using Stratus OCT. Invest Ophthalmol Vis Sci 2004;45:1716-24.
14) Yoon SC, Lee DY, Nam DH. Macular thickness in healthy Korean eyes using OCT3 comparing with normative data. J Korean Ophthalmol Soc 2008;49:601-10.
15) Hendrickson A, Drucker D. The development of parafoveal and mid-peripheral human retina. Behav Brain Res 1992;49:21-31.
16) Spraul CW, Lang GE, Grossniklaus HE. Morphometric analysis of the choroid, Bruch’s membrane, and retinal pigment epithelium in eyes with age-related macular degeneration. Invest Ophthalmol Vis Sci 1997;38:1290-2.
=ABSTRACT=
Repeatability and Agreement of Macular Thickness Measurement Using Time Domain OCT and Spectral Domain OCT in Normal Subjects
Se Beum Oh, MD, Won Bin Cho, MD, Jun Woong Moon, MD, Hyung Chan Kim, MD
Department of Ophthalmology, College of Medicine, Konkuk University, Seoul, Korea
Purpose: To compare the repeatability and agreement of macular thickness measurements using time domain (TD) optical coherence tomography (OCT) and spectral domain (SD) OCT in normal subjects.
Methods: Thirty-four normal subjects were included. Three consecutive macular measurements were taken with TD OCT and SD OCT. Total and regional macular thickness and total macular volume obtained by the two OCTs were compared. Within- subject standard deviation (Sw), coefficient of variation (CVw), and the intraclass correlation coefficient (ICC) were calculated to evaluate repeatability. The agreement was examined with Bland Altman plots. The correlation was also evaluated with Pearson correlation coefficients and multiple regression analysis.
Results: Sw for foveal thickness, total macular thickness, and total macular volume were 11.53 μm, 7.58 μm, and 0.48 mm3 for TD OCT and 6.69 μm, 2.55 μm, and 0.09 mm3 for SD OCT, respectively. The values for SD OCT were consistently lower, and this result was statistically significant. The range of the respective CVw and ICC values were 1.10~2.78% and 0.78~0.96% for TD OCT, and 0.29~0.94% and 0.92~0.99% for SD OCT, respectively. The SD OCT showed better repeatability for macular thickness measurements(all with p≤0.001). The spans of 95% limits of agreement for foveal thickness, total macular thickness, and total macular volume were 67.94 μm, 29.01 μm, and 0.98 mm3, respectively. The Pearson correlation coefficient of foveal thickness, total macular thickness, and total macular volume between the two OCT’s was statistically significant.
Conclusions: Although both OCTs are reliable for macular thickness measurements, SD OCT shows better repeatability compared with TD OCT. Although macular thickness measurements obtained from the two OCTs can not be used interchangeably due to low agreement by different standards of measurement, there was a statistically significant correlation between the two OCT’s.
J Korean Ophthalmol Soc 2009;50(5):710-716
Key Words: Coefficient of variation, Intraclass correlation coefficient, Spectral domain OCT, Time domain OCT, Within-subject standard deviation
Address reprint requests to Hyung Chan Kim, MD
Department of Ophthalmology, Konkuk University Medical Center, Konkuk University School of Medicine
#4-12 Hwayang-dong, Gwangjin-gu, Seoul 143-729, Korea
Tel: 82-2-2030-5270, Fax: 82-2-2030-5273, E-mail: [email protected]