INTRODUCTION
In most countries, end-stage renal disease (ESRD) is increas- ing (1, 2), with further increases in the future. Over the past decades the treatment of patients with ESRD by dialysis or transplantation has improved considerably. Nevertheless, nei- ther form of renal replacement therapy (RRT) is thought to be ideal because each modality has its specific advantages and disadvantages. Although kidney transplantation is felt to offer the best survival and quality of life, the majority of ESRD patients at some time in their life are faced with choosing between hemodialysis (HD) or peritoneal dialysis (PD) (3, 4). The best choice of dialytic modality in terms of patient outcome has not been well established. The choice has there- fore usually been made on the basis of the patient’s social needs or modality availability; unless a medical contraindication precludes the use of a specific modality. Since continuous am- bulatory peritoneal dialysis (CAPD) was introduced in the late 1970s, there have been several studies which compared patient survival between HD and PD (5, 6). However, results are conflicting. Both earlier and more recent studies have shown inconsistent results for comparative mortality (4, 7- 11). Results appear to vary by country and, in some cases, even within a country. All of these studies are observational, and therefore inconsistent results may be due to unavoidable
and varying selection biases that are seen in nonrandomized studies. To compare each treatment options it is necessary to have as little bias as possible concerning baseline characteristics affecting morbidity and mortality, such as age, comorbid con- ditions and acceptance policies for renal transplantation.
Over the past decade, a number of large-scale studies have examined the impact of dialysis modality on the survival of individuals with ESRD (4, 12-14). However, little informa- tion is available concerning any differential trends in mortality among renal replacement therapy in Asian ESRD populations.
The purpose of this study was to investigate clinical charac- teristics and any differential trends in mortality between HD and PD, and between dialysis and renal transplantation in Korean ESRD population. We further postulate that, consis- tent with previous studies, the key segments are defined by age, cause of ESRD, and baseline level of comorbidity. Our specific goals were to identify key risk factors for which the risk of death differs by renal replacement modality, and to adjust mortality comparisons between HD and PD by strati- fying on these factors.
MATERIALS AND METHODS
Medical records of ESRD patients who began dialysis or Young-Soo Song, Heesun Jung*, Jinyoung Shim*, Changkwon Oh�, Gyu-Tae Shin*, Heungsoo Kim*
Department of Internal Medicine, Hallym University College of Medicine, Seoul; Departments of Nephrology*, Surgery�, Ajou University School of Medicine, Suwon, Korea
Address for correspondence Heungsoo Kim, M.D.
Department of Nephrology, Ajou University School of Medicine, San-5 Woncheon-dong, Youngtong-gu, Suwon 443-721, Korea
Tel : +82.31-219-5130, Fax : +82.31-219-5137 E-mail : nephrohs@ajou.ac.kr
*Presented at the 55th meeting of the Korean Associa- tion of Internal Medicine, Seoul, 2004.
81
Survival Analysis of Korean End-Stage Renal Disease Patients According to Renal Replacement Therapy in a Single Center
This study was to investigate clinical characteristics and any differential trends in survival among renal replacement therapy (hemodialysis [HD], peritoneal dialysis [PD], and kidney transplantation [KT]) in Korean end-stage renal disease (ESRD) population. We tried to analyze retrospectively the survival rate adjusted by risk fac- tors and the relative risk stratified by key risk factors among 447 ESRD patients who began dialysis or had a kidney transplant at Ajou University Hospital from 1994 to 2004. In adjusted Cox survival curves, the KT patients had the best survival rate, and the HD patients had better survival than PD patients. The consistent trends in different subgroups stratified by age and diabetes were as following: 1) The risk of death for PD and HD was not proportional over time, 2) The relative risk of PD was similar or lower than that of HD for the first 12 months, but it became higher at later period. The significant predictors for mortality were age (over 55 yr), presence of diabetes, cerebrovascular accident at ESRD onset, and more than one time of hos- pitalization caused by malnutrition. Further large-scaled, multicenter-based com- parative study is needed in Korean ESRD patients and more meticulous attention is required in high-risk patients.
Key Words : Renal Replacement Therapy; Kidney Transplantation; Renal Dialysis; Peritoneal Dialysis; Sur- vival Analysis; Risk
Received : 9 March 2006 Accepted : 21 June 2006
had a kidney transplant at Ajou University Medical Center from September 1994 to November 2004 were reviewed ret- rospectively. This study was in accordance with the ethical standards laid down in the 1964 Declaration of Helsinki. Of these patients, those who maintained the same mode of RRT more than 3 months were eligible for this study. In these pa- tients, those who had not regular follow-up in either our cen- ter or at local dialysis facilities were excluded. The patients who had accompanying malignancy or life expectancy less than 6 months at the beginning of RRT were excluded. The patients, whose data on predialysis or pretransplatation comor- bid conditions was not available, were also excluded. The patients were divided into three groups by RRT modalities:
HD, PD, kidney transplant (KT) groups. The patients who had KT at any time of ESRD were considered as KT group and the periods undergoing dialysis were censored in this group. The resulting study population included 447 patients: HD group (179 patients), PD group (165 patients) and KT group (103 patients). Patient characteristics includ- ing age, sex, causes of ESRD, comorbidity at the time of RRT initiation (hypertension, cerebrovascular accident, ischemic heart disease, congestive heart failure, liver disease), biochem- ical markers (blood urea nitrogen, creatinine, calcium, total protein, albumin, and total cholesterol), hemoglobin, hema- tocrit and viral markers at the beginning of RRT were record- ed. The comorbid conditions were defined as follow: Hyper- tension: systolic blood pressure over 140 mmHg, diastolic blood pressure over 90 mmHg, or the need for antihyper- tensive medication; ischemic heart disease: history of prior coro- nary artery disease, myocardial infarction, angioplasty, coro- nary artery bypass graft; congestive heart failure: systolic ejec- tion fraction below 40% in echocardiographic evaluation;
cerebrovascular accident, either hemorrhage or infarction: history and neurologic deficit; liver disease: cirrhosis, B and C viral hepatitis by biochemical or abdominal sonographic evalua- tion. Baseline glomerular filtration rate was determined from Cockcroft-Gault equation, which is based on serum creati- nine, age, body weight and gender.
We tried to investigate the patient survival, technical sur- vival, and morbidity during the course of RRT: the incidences of cardiovascular complication (congestive heart failure, is- chemic heart disease), infection, cerebrovascular accident, malignancy, and protein-calorie malnutrition. In addition to medical records, we tried to make a contact with patients or patient’s family by phone call in cases of being cared at local dialysis facility. We counted the incidences of de novo development of congestive heart failure, ischemic heart dis- ease, and cerebrovascular accident either hemorrhage or infarc- tion. The incidence of infection including CAPD peritonitis was counted only in cases requiring hospitalization. We de- fined protein-calorie malnutrition by clinical discernment (the patient with serum albumin is less than 3.5 g/dL and being judged as malnourished by subjective global assess- ment) and counted only in cases of requiring hospitalization.
Statistical analysis
Results are presented as mean±standard deviation (SD).
Baseline characteristics of each RRT patients were compared using chi-square tests and analysis of variance (ANOVA). We employed an as-treated model in assessing the association of treatment modality and risk of death in patients with RRT.
Since an intention-to-treat modality is used to determine the association between the specified dialysis modality chosen at ESRD onset and subsequent mortality, irrespective of any future changes in modality, patients are not censored even if they change treatment modality during follow-up and patient death is assigned to the initial treatment modality. On the contrary, since an as-treated model is used to determine the risk of death while being treated by a specified modality dur- ing the follow-up period, patients are censored when they switch from one modality to another.
Since preliminary analyses demonstrated that the impact of RRT on mortality varied with time (p<0.05), thereby vio- lating proportionality assumption of the Cox proportional model, time-dependent Cox regression were used to identify the significant prognostic factors affecting survival rate among each patients group. In order to find independent factors, demographic variables and covariates satisfying the signifi- cant level (p<0.05) in univariate Cox regression analysis, were analyzed in multivariate Cox regression analysis. Also, we com- pared relative risk among RRT groups using interval Pois- son regression, which were stratified for age and diabetes by 12-month interval.
The SPSS package version 12.0 statistic software was used.
A p value less than 0.05 was taken to indicate statistically sig- nificant.
Survival analysis
The Cox survival curve adjusted by age, gender, diabetes and other risk factors analyzed to be significant in univariate Cox regression was used to compare the survival rate among groups. The patient’s cumulative survival duration was mea- sured from the start of the first RRT to an end-point. We considered the end-point as follow: death from any causes, change to other modality of RRT, and at the end of this study whichever came first. In KT group, the patient’s cumulative survival duration was measured from the date of transplanta- tion to end-points. After initially fulfilling the selection cri- teria, patients were not excluded. Instead, we chose a censor- based analysis, in which the patients were censored on chang- ing to other modality of RRT, or reaching final follow-up for mortality analysis.
The Kaplan-Meier analysis was used to compare the tech- nical survival rate among groups. The duration of technical survival was measured from the start of the RRT to the tech- nical failure. In the HD group, a change to peritoneal dialy- sis due to loss of hemodialysis access and cardiovascular or
hemodynamic cause was considered as technical failure. Also in the PD group, the removal of intraperitoneal catheter from any causes was considered technical failure. Those who had died and were effective in the modality function were analyzed as being technically alive.
RESULTS Baseline characteristics of patients
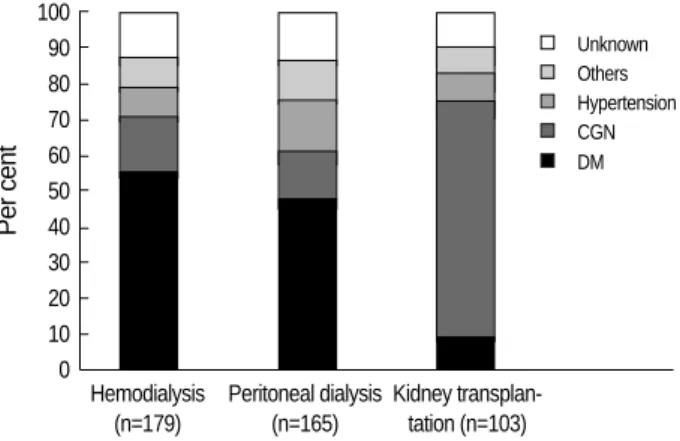
The baseline characteristics are summarized in Table 1 for 447 eligible patients who began HD (n=179), PD (n=165) or had a KT (n=103). The patients with KT were signifi- cantly younger than those with dialysis (p< 0.05). Male sex predominated significantly in KT patients. When censor- ing was performed, mean follow-up time was 49.0±30.5 months (range 3-157 months). Fig. 1 illustrates the causative disease for ESRD in each RRT modality. Compared with dialysis patients, KT patients were more likely to have glo- merulonephritis as a cause of ESRD (p<0.05). The distribu- tion of causes of ESRD was similar between HD and PD.
The baseline level of serum creatinine and phosphorus were significantly higher in KT patients than those of HD and PD patient (Table 2). The viral antigen of hepatitis B was more likely (p<0.05) to be positive in PD patients than that
in other two groups. Other biochemical markers and he- matologic markers were not different significantly among groups.
The comorbid conditions at the beginning of RRT were present in Table 1. Hypertension was the most common co- morbidity in all RRT modalities. The prevalence of ischemic heart disease was similar between HD and PD group, which was significantly higher than that in KT group. The preva- lence of cerebrovascular accident (CVA) in PD patients (9.1
%) was significantly higher than that in the other two groups (HD 2.8%, RT 0%). The distribution of other comorbid conditions did not differ significantly among RRT modali- ties.
Per cent
100 90 80 70 60 50 40 30 20 10 0
Hemodialysis Peritoneal dialysis Kidney transplan- (n=179) (n=165) tation (n=103)
DM
Fig. 1.The causes of end-stage renal disease (ESRD) in each re- nal replacement therapy group. The distribution of causes of ES- RD was similar between patients on hemodialysis and patients on peritoneal dialysis. Compared with dialysis patients, renal trans- plant patients were more likely (p<0.05) to have glomerulonephri- tis and less likely (p<0.05) to have diabetes as a cause of ESRD.
CGN, chronic glomerulonephritis; DM, diabetes mellitus.
Hypertension Others Unknown
CGN
Characteristic HD
(n=179)
PD (n=165)
KT (n=103)
Sex (M/F) 95/84 76/89 66/37*
Age (yr) 54±13 54±14 36±11�
Comorbidity
Diabetes 104 (58.1%) 84 (50.9%) 8 (7.8%)�
Hypertensiona 146 (81.6%) 148 (89.7%)�87 (84.5%) Ischemic heart diseaseb 15 (8.4%) 17 (10.3%) 0 (0%)� Congestive heart failurec 11 (6.1%) 11 (6.7%) 0 (0%) Left ventricular hypertrophyd57 (31.8%) 63 (38.2) 27 (26.2%) Cerebrovascular accidente 5 (2.8%) 15 (9.1%)� 0 (%) Liver diseasef 13 (7.3%) 15 (9.0%) 3 (2.9%) BMIg(kg/m2) 22.0±3.4 22.2±2.8 21.7±2.7 Follow-up duration (months) 49.4±33.7 40.6±24.6� 62.0±28.6� Table 1.Demographic data and comorbidity factors of end-stage renal disease patients at the time of renal replacement therapy initiation
HD, hemodialysis; PD, peritoneal dialysis; KT, kidney transplantation. a, Systolic BP >140 mmHg or diastolic BP >90 mmHg, or medicated with antihypertensive drug; b, A history of prior coronary artery disease, myo- cardial infarction, angioplasty, coronary artery bypass graft; c, Defined by ejection fraction below 40% in echocardiographic evaluation; d, Defined by electrocardiographic or echocardiographic evaluation; e, Cerebral infaction or hemorrhage, defined by old and recent history and neuro- logic deficit; f, alcoholic cirrhosis, viral cirrhosis, B and C viral hepatitis;
gbody mass index.
*, p<0.05, the number of male was larger than female within KT group;
�, p<0.05, compared with HD and PD; �, p<0.05, compared with HD and KT; �, p<0.05, compared with HD.
Laboratory values HD PD KT
Blood urea nitrogen (mg/dL) 96±35 95±37 98±33 Creatinine (mg/dL) 10.1±4.5 9.8±4.5 13.3±5.4*
Creatinine clearance 6.4±4.0 6.9±5.1 4.2±2.6 (mL/min/1.73 m2)
Calcium (mg/dL) 7.4±1.1 7.7±1.0 7.4±1.3 Phosphorus (mg/dL) 6.5±2.1 6.1±2.0 7.3±2.3*
Calcium×phosphorus 47.3±2.1 47.1±1.9 55.3±2.3*
Total protein (g/dL) 6.1±0.9 6.1±0.8 6.0±0.8 Albumin (g/dL) 3.2±0.7 3.3±0.6 3.3±0.6 Total cholesterol (mg/dL) 197±69 187±64 189±70 Hemoglobin (g/dL) 7.6±1.9 7.9±1.7 7.4±1.7 Hematocrit (%) 22.5±5.5 23.4±5.0 21.9±5.2 HBs Ag positivity 6 (3.4%) 14 (8.5%)� 1 (1.0%) Anti-HCV positivity 6 (3.4%) 2 (1.2%) 1 (1.0%) Table 2.Laboratory findings of end-stage renal disease patients at the time of renal replacement therapy initiation
HD, hemodialysis; PD, peritoneal dialysis; KT, kidney transplantation.
*, p<0.05, compared with HD and PD; �, p<0.05, compared with HD and KT.
Morbidity during follow-up
The de novo development of congestive heart failure in HD patients was significantly higher, whereas CVA was more likely (p<0.05) to occur in PD patients (Table 3). The inci- dence of infection was significantly different among each mo- dality, and highest in PD patients and lowest in HD patients.
PD patients were significantly prone to hospitalize because of clinically relevant malnutrition than other patients (p<0.05).
Technical survival
The HD group showed significantly better outcomes in terms of technical survival than the PD group (p<0.05). The HD group showed slightly higher technical survival rate than the KT group, but the difference was not significant. The 5-yr technical or graft survival rates of the HD, PD, and KT groups were 97.5%, 72.8%, and 93.7%, respectively (data not shown).
Risk factors affecting patient survival
By univariate analyses, the factors affecting the patient sur-
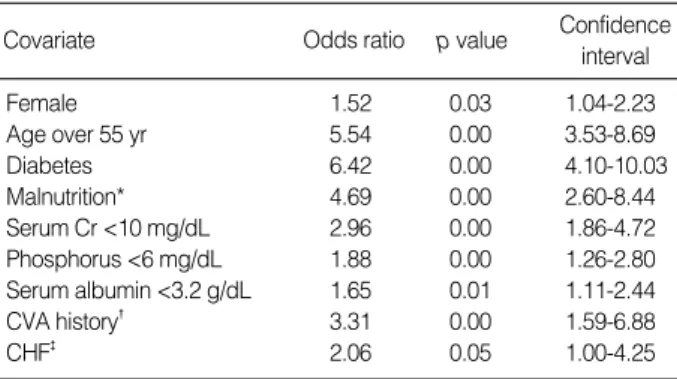
vival were female, diabetes, age over 55 yr, more than one time of hospitalization caused by malnutrition, serum crea- tinine below 10 mg/dL, serum phosphorus below 6 mg/dL, serum albumin below 3.2 g/dL, cerebrovascular accident and congestive heart failure at the initiation of RRT (Table 4). The independent predictors for mortality by multivariate analysis were age, diabetes, cerebrovascular accident at the initiation of RRT, and more than one time of hospitalization caused by malnutrition (Table 5).
In each modality patients, the risk factor for death was in- vestigated separately. Significant independent risk factors for death in HD patients were age over 55 yr, diabetes, and albu- min below 3.2 g/dL, whereas age over 55 yr, diabetes, cere- brovascular accident at the initiation of RRT, and malnutri- tion were significant independent risk factors in PD patients.
Patient age and diabetes were key risk factors in dialysis gro- ups. Patient age was the only significant risk factor in KT patients.
Patient survival by mode of RRT
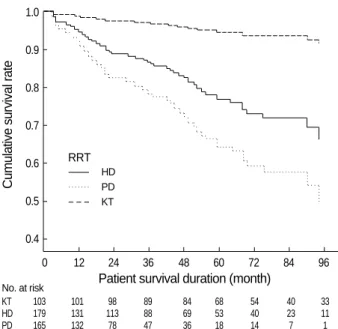
During the follow-up, the overall patient mortality was 23.7% (106 cases). The cause of death in each RRT patients was shown in Fig. 2. The most common cause of death was cardiac disease in HD group. Infection and cachexia were the two leading causes of death in PD group. The adjusted Cox survival curves were shown in Fig. 3. The patient cumulative survival was significantly different among the three modali- ties. The KT group showed the highest survival rate and the PD group the lowest survival rate (p<0.05).
Fig. 4 shows the relative risk of death among RRT groups in overall patients by 12-month interval. The relative risk
Morbidity HD (n=179) PD (n=165) KT (n=103)
Ischemic heart diseasea 7.9% 6.8% 2.9%
Congestive heart failureb 10.1%* 3.1% 2.0%
Cerebrovascular accidentc 5.6% 10.5%� 1.0%
Infectiond 10.7% 34.6%� 19.6%�
Malignancye 1.7% 1.2% 3.9%
Malnutritionf 1.7% 10.5%� 0%
Table 3.Development of morbidity during follow-up
HD, hemodialysis; PD, peritoneal dialysis; KT, kidney transplantation. a, Evidenced by coronary angiography with or without coronary angioplas- ty, myocardial infarction, coronary artery bypass graft; b, Defined by sys- tolic ejection fraction below 40% in echcardiographic evaluation; c, Cere- bral infarction or hemorrhage, defined by computed tomography; d, Hos- pitalization due to infection including peritonitis in PD group; e, Hospital- ization due to clinically defined malnutrition over 1 time.
*, p<0.05, compared with PD, KT; �, p<0.05, compared with KT; �, p<0.05, compared with PD, KT; �, p<0.05, compared with HD.
Covariate Odds ratio p value Confidence
interval
Female 1.52 0.03 1.04-2.23
Age over 55 yr 5.54 0.00 3.53-8.69
Diabetes 6.42 0.00 4.10-10.03
Malnutrition* 4.69 0.00 2.60-8.44
Serum Cr <10 mg/dL 2.96 0.00 1.86-4.72
Phosphorus <6 mg/dL 1.88 0.00 1.26-2.80
Serum albumin <3.2 g/dL 1.65 0.01 1.11-2.44
CVA history� 3.31 0.00 1.59-6.88
CHF� 2.06 0.05 1.00-4.25
Table 4.Factors affecting patient’s death by univariate analysis of variates
All the values are examined at the time of RRT initiation except malnu- trition.
*, Hospitalization due to clinically defined malnutrition (serum albumin
<3.5 g/dL and by subjective global assessment) over 1 time; �, Cerebro- vascular accident; cerebral infarction or hemorrhage, defined by old and recent history and neurologic deficit at the time of renal replacement therapy initiation; �, Congestive heart failure; defined by systolic ejection fraction below 40% in echocardiographic evaluation at the time of renal replacement therapy initiation.
Covariate Odds ratio p value Confidence
interval
Age over 55 yr 3.756 0.000 2.097-6.726
Diabetes 3.356 0.000 1.924-5.854
Malnutrition* 2.371 0.008 1.247-4.507
CVA history� 2.146 0.049 1.004-4.587
Table 5.Independent predictors of death by time dependent Cox regression
*, Hospitalization due to clinically defined malnutrition (serum albumin
<3.5 g/dL and by subjective global assessment) over 1 time; �, Cere- brovascular accident; cerebral infarction or hemorrhage, defined by old and recent history and neurologic deficit at the time of renal replacement therapy initiation.
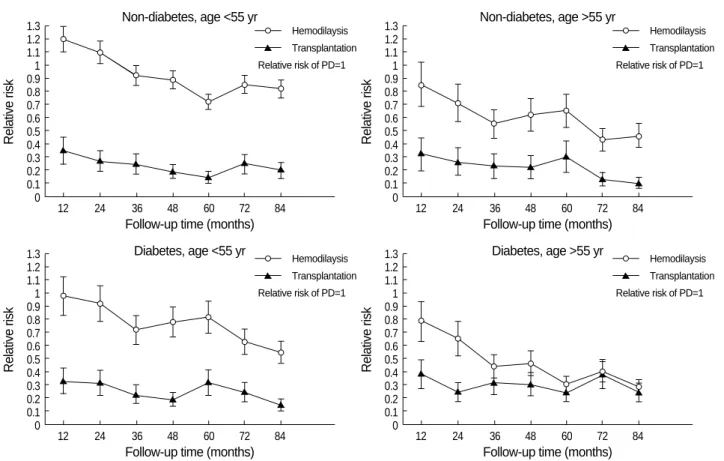
among RRT was not proportional over time, especially bet- ween HD and PD. The relative risk of HD was similar or higher than that of PD group for the first 12 months, but it became lower than that of PD at later period. Fig. 5 shows the relative risk of death among RRT groups stratified by key factors (age and diabetes) by 12-month interval. Over entire 4 strata, the relative risks of HD became lower than
those of PD at later period, though the levels of relative risks for HD at initial periods were different each other. The KT group showed lower relative risk than the other groups across entire 4 strata as shown in Fig. 5.
DISCUSSION
There has been controversy regarding which renal replace- ment modality provides the greatest patient survival. In this study, we found better survival rate as well as lower morbidity during follow-up in KT group compared with dialysis groups (Table 3, Fig. 3). This study that compared the outcome am- ong patients who received transplants with that among pa- tients on dialysis seemed to be biased in favor of the former group, because high-risk patients on dialysis who were not candidates for transplantation were included. Another rea- son is that the KT patients were significantly younger than other patients and that, in fact, the age was found to be key risk factor for death in all RRT patients. To overcome this concern, we repeated the Cox survival analysis adjusted by known key risk factors, including only those measures of variables that could be recorded with accuracy. We repeated our analyses with and without adjustment, which again yield- ed results similar to the original finding that KT had better survival rate.
Fig. 3.Adjusted Cox survival curves according to renal replace- ment therapy. It was adjusted for age, diabetes, more than one time of hospitalization caused by malnutrition, cerebrovascular accident at the initiation of renal replacement therapy (RRT), which were analyzed to be independent predictors of death by time de- pendent Cox regression. The patient’s survival rates were signifi- cantly different among groups. The KT group showed the best survival rate over the entire follow-up period and the PD group showed the lowest survival rate. KT, kidney transplantation; HD, hemodialysis; PD, peritoneal dialysis.
KT n=103
PD n=165
HD n=179
0 10 20 30 40 50 60
Per cent
Fig. 2.The causes of death according to modality of renal replace- ment therapy (RRT). The proportions from each RRT represent the mortality ratios within relevant RRT group and the each seg- ment within RRT represents the individual cause of death. While the proportion of cardiac cause in hemodialysis was higher than that of the other two groups significantly (p<0.05), the proportions of infection and cachexia in peritoneal dialysis were higher than that of the other two groups significantly (p<0.05). CVA, cerebrova- scular accident. *: p<0.05, compared with PD and with KT; �: p<
0.05, compared with HD and with RT; �: p<0.05, compared with KT.
HD, hemodialysis; PD, peritoneal dialysis; KT, kidney transplantation.
CVA Infection Malignancy
Cachexia Bleeding Others Unknown Cardiac
*
�
� �
�
�
�
Cumulative survival rate
1.0
0.9
0.8
0.7
0.6
0.5
0.4
0 12 24 36 48 60 72 84 96
Patient survival duration (month)
HD PD KT RRT
No. at risk
KT 103 101 98 89 84 68 54 40 33
HD 179 131 113 88 69 53 40 23 11
PD 165 132 78 47 36 18 14 7 1
Relative risk
1.3 1.2 1.1 1 0.9 0.8 0.7 0.6 0.5 0.4 0.3 0.2 0.1 0
12 24 36 48 60 72 84
Follow-up time (months)
Hemodilaysis Transplantation Relative risk of PD=1
Fig. 4.Relative risk of death among renal replacement of therapy groups in overall patients by 12-month interval. Each relative risk is plotted against the endpoint of the follow-up interval to which it pertains. The relative risk among renal replacement therapy was not proportional over time, especially between hemodialysis (HD) and peritoneal dialysis (PD). The relative risk of HD was similar or higher than that of PD group for the first 12 months, but it became lower than that of PD at later period.
Earlier reports on patient outcome of PD and HD gave conflicting results, ranging from favorable for HD over no difference to favorable for PD (4, 8, 10, 11, 13, 16-23). As pointed out by Port et al. (21), correct interpretation of these studies is difficult because they differ in many aspects, such as type of statistical analysis (with or without correction for comorbidity, and presence of different factors of comorbidity), use of single center versus multicenter data, inclusion of inci- dent or prevalent patients, and duration of follow-up. In our analysis, the outcomes of the patients who began and remain on their initial therapy from September 1994 to November 2004 were worse for PD Patients compared with HD or KT patients. Although the patient’s outcomes itself in our study were somewhat different to those of other studies, by the dif- ferences in ethnics, methodology and body mass index, the survival trends were similar (15, 24, 25).
The mechanism through which PD may contribute to this increased mortality risk in this study group, especially in later treatment period, is unclear. But these results could be par- tially explained by the deterioration of the quality of the peri- toneal membrane and by the loss of residual renal function over time. The loss of residual renal function, which was re- ported as independent risk factor for mortality (26), might give an additional impact on survival of PD patients at later
treatment period in this group, although not being evaluat- ed in this study (27). In addition to possible harmful effect caused by changes in peritoneal membrane, it is suggested that the rising mortality rate for PD patients later in the fol- low-up may be attributed to the fact that patients on PD have less chance to see their health care providers (an average of one visit a month) compared with patients on HD (an aver- age of three visits a week). Consequently, patients on PD have more chance for delayed recognition and treatment of life-threat- ening complications than do patients on HD (14). The like- lihood of developing infections such as peritonitis especially refractory or fungal peritonitis may add to the mortality risk of PD patients. And these infectious complications, which were the main cause of death for PD patient in this study, may contribute the development of malnutrition leading to cachexia, which was another main cause of death. Neverthe- less, outcomes may be caused by other effects rather than by modality effect itself.
Several studies have suggested that PD has early survival benefit over HD for 2-3 yr (11, 14) due in part to a better preservation of residual renal function during the early peri- od with PD (27, 28), a higher incidence of late referral with HD, and early complications associated with vascular access in HD (25). But such an early beneficial effect on survival of
Relative risk
1.3 1.2 1.1 1 0.9 0.8 0.7 0.6 0.5 0.4 0.3 0.2 0.1
0 12 24 36 48 60 72 84
Follow-up time (months) Non-diabetes, age <55 yr
Fig. 5.Relative risk of death among renal replacement of therapy groups stratified by key risk factors (age and diabetes) by 12-month inter- val. Each relative risk is plotted against the endpoint of the follow-up interval to which it pertains. The relative risk among renal replacement therapy was not proportional over time, especially between hemodialysis (HD) and peritoneal dialysis (PD). Over entire 4 strata, the rela- tive risk of HD became lower than that of PD at later period.
Hemodilaysis Transplantation Relative risk of PD=1
Relative risk
1.3 1.2 1.1 1 0.9 0.8 0.7 0.6 0.5 0.4 0.3 0.2 0.1
0 12 24 36 48 60 72 84
Follow-up time (months) Non-diabetes, age >55 yr
Hemodilaysis Transplantation Relative risk of PD=1
Relative risk
1.3 1.2 1.1 1 0.9 0.8 0.7 0.6 0.5 0.4 0.3 0.2 0.1
0 12 24 36 48 60 72 84
Follow-up time (months) Diabetes, age <55 yr
Hemodilaysis Transplantation Relative risk of PD=1
Relative risk
1.3 1.2 1.1 1 0.9 0.8 0.7 0.6 0.5 0.4 0.3 0.2 0.1
0 12 24 36 48 60 72 84
Follow-up time (months) Diabetes, age >55 yr
Hemodilaysis Transplantation Relative risk of PD=1
PD did not persisted in our study (Fig. 3).
We tried to find the prognostic factor affecting patient’s survival at the time of RRT initiation and during the follow- up, but we could not evaluate the compliance of patients for each modality, severity of each comorbid illness, impact on late referral, the degree of blood pressure control and anemia correction, monitoring of parameters for cardiovascular dis- ease and nutritional status, smoking status, monitoring of dialysis adequacy, residual renal function, the effect of dialyzer reuse system and different PD solution in dialysis groups.
Although the extent to which those parameters would affect the survival rate systematically by RRT modality is unclear, we consider those parameters could have some impact on the survival of ESRD patients.
Unlike other studies, we evaluated the morbidity during follow-up. As mentioned above, the development of conges- tive heart failure in HD group was higher than that of the other groups significantly (p<0.05). This probably might reflect the hemodynamic stress on HD group. The higher development of cerebrovascular accident in PD group was partially due to the predisposing condition, namely higher incidence of cerebrovascular accident at the time of dialysis initiation or due to the accelerated atherosclerosis, which is frequently found in ESRD patients, especially in PD patients as suggested by several studies (29, 30). In our study, the in- cidence of malnutrition requiring for hospitalization in PD group was higher than that of the other groups and malnutri- tion-associated cachexia as a cause of death in this group was higher than that of the other group. This was agreed with the studies that protein-calorie malnutrition was highly preva- lent and main cause for mortality in PD patients (31-33).
Recently, Vonesh et al. (25) reported that despite metho- dological differences of several studies, there are some very important trends. First, mortality rates for PD and HD were not proportional over time (12, 14). The risk of death for PD is generally lower during the first year or two of dialysis. There- after, the risk of death is either comparable between the two modalities or higher in patients on PD. Consistent with this finding, the relative risk of PD was similar or lower than that of HD group for the first 12 months, but it became higher than that of HD later period in this study (Fig. 4). A second trend common to these studies was the identification of sig- nificant interactions between various risk factors and treat- ment modality. Ganesh et al. (34) and Stack et al. (35) also identified important interactions between comorbidity and dialysis modality that had not been accounted for in previous studies. The inclusion of such key interactions is necessary if an accurate assessment of mortality differences between PD and HD is to be made. For example, it has been consistently demonstrated that the relative risk of death between PD and HD varies by age and by primary cause of ESRD (diabetic vs. non-diabetic causes) (4, 12-14). Similarly, patient age and diabetes were key risk factors for death in this study.
We tried to evaluate the relative risk of death, adjusted and
stratified by the risk factors such as age and diabetes, was com- pared among RRT group (Fig. 5). The time-dependent rel- ative risk reflects an important and consistent trend across various patient subgroups. In patients younger than 55 yr irrespective of diabetes, the relative risk of PD was similar or lower than that of HD for the first 24 months, but it be- came higher than that of HD. This trend was remarkable especially in diabetic patients older than 55 yr, though the relative risk of PD was higher even at the early period. This resultant trend was consistent with the previous mentioned study by Vonesh et al. (25). The absence of early benefit of PD in our study can be partially explained by our larger pro- portion of diabetic patients than that in study by Vonesh et al. Although we adjusted for several risk factors, it is possi- ble that there was other unidentified yet important factor.
Further integrative evaluation containing those parameters will be needed to find each effect on patient’s survival.
There are many logistic and ethical barriers to performing a randomized trial to determine whether the treatments dif- fer in patient outcome. Consequently, longitudinal epidemi- ologic studies are necessary. The findings reported here should be considered in the context of an observational study and its inherent limitations. One concern regarding the internal validity of this study is the presence of selection bias toward one modality over another. We recognize that this study is retrospective and extends over a long period time (from 1994 to 2004), and it may be argued that over these years many changes in the practice of both HD and PD have occurred.
Thus, in this report, especially, evaluation of the clinical sig- nificance of an association, examination of the likely causes of an association, and careful review of potential sources of bias are more important considerations than is the p value.
In conclusion, the KT patients had the best survival rate, and the HD patients had better survival than PD patients. The consistent trend in different strata was as following: 1) The risk of death for PD and HD was not proportional over time, especially between HD and PD. 2) The relative risk of PD was similar or lower than that of HD group for the first 12 months, but it became higher than that of HD at later peri- od. The significant predictors of mortality were age (over 55 yr), presence of diabetes, cerebrovascular accident at the time of RRT initiation, and more than one time of hospitalization caused by malnutrition during follow-up. Further large-scaled, multicenter-based comparative study is needed to reflect exact characteristics and survival in Korean ESRD patients and more meticulous attention is required in high-risk patients.
REFERENCES
1. US Renal Data System. USRDS 2004 Annual Data Report: Atlas of End Stage Renal Disease in the United States, Bethesda, MD, Nation- al Institutes of Health, National Institute of Diabetes and Digestive and Kidney Disease, March 2005.
2. Canadian Organ Replacement Register. 1993 Annual Report. Don Mills, ON, Canadian Institute for Health Information, March 1995.
3. Kjellstrand CM, Moody H. Hemodialysis in Canada: A first-class medical crisis. Can Med Assoc J 1994; 150: 1067-71.
4. Bloembergen WE, Port FK, Mauger EA, Wolfe RA. A comparison of mortality between patients treated with hemodialysis and perito- neal dialysis. J Am Soc Nephrol 1995; 6: 177-83.
5. Charytan C, Spinowitz BS, Galler M. A comparative study of contin- uous ambulatory peritoneal dialysis and center hemodialysis. Effica- cy, complications, and outcome in the treatment of end-stage renal disease. Arch Intern Med 1986; 146: 1138-43.
6. Gokal R, Jakubowski C, King J, Hunt L, Bogle S, Baillod R, Marsh F, Ogg C, Oliver D, Ward M. Outcome in patients on continuous ambulatory peritoneal dialysis and hemodialysis: 4-year analysis of a prospective multicenter study. Lancet 1987; 2: 1105-8.
7. Maiorca R, Vonesh EF, Cavalli P, De Vecchi A, Giangrande A, La Greca G, Scarpioni LL, Bragantini L, Cacarini GC, Cantallupi A. A multicenter, selection-adjusted comparison of patient and technique survivals on CAPD and hemodialysis. Perit Dial Int 1991; 11: 118-27.
8. Held PJ, Port FK, Turenne MN, Gaylin DS, Hamburger RJ, Wolfe RA. Continuous ambulatory peritoneal dialysis and hemodialysis:
comparison of patient mortality with adjustment for comorbid con- ditions. Kidney Int 1994; 45: 1163-9.
9. Lowrie EG, Huang WH, Lew NL. Death risk predictors among peri- toneal dialysis and hemodialysis patients: a preliminary comparison.
Am J Kidney Dis 1995; 26: 220-8.
10. Disney AP. Demography and survival of patients receiving treatment for chronic renal failure in Australia and New Zealand: report on dialysis and renal transplantation treatment from the Australia and New Zealand Dialysis and Transplant Registry. Am J Kidney Dis 1995; 25: 165-75.
11. Fenton S, Schaubel D, Desmeules M, Morrison H, Mao Y, Copleston P, Jeffery J, Kjellstrand C. Hemodialysis versus peritoneal dialysis:
A comparison of adjusted mortality rates. Am J Kidney Dis 1997; 30:
334-42.
12. Schaubel DE, Morrison HI, Fenton SS. Comparing mortality rates on CAPD/CCPD and hemodialysis. The Canadian experience: Fac- tor fiction? Perit Dial Int 1998; 18: 478-84.
13. Vonesh EF, Moran J. Mortality in end-stage renal disease: A reassess- ment of differences between patients treated with hemodialysis and peritoneal dialysis. J Am Soc Nephrol 1999; 10: 354-65.
14. Collins AJ, Hao W, Xia H, Ebben JP, Everson SE, Constantini EG, Ma JZ. Mortality risks of peritoneal dialysis and hemodialysis. Am J Kidney Dis 1999; 34: 1065-74.
15. Registry Committee, Korean Society of Nephrology. Renal replace- ment therapy in Korea: Insan Memorial Dialysis Registry 2004.
Korean J Nephrol 2005; 24: 367-95.
16. Ronco C, Conz P, Bragantini L, DellAquila R, Crepaldi C, Disseg- na D. Integration of peritoneal dialysis in active uremia treatment.
Perit Dial Int 1996; 16 (Suppl 1): 393-7.
17. Prichard S. Peritoneal dialysis and haemodialysis: are they compa- rable? Nephrol Dial Transplant 1997; 12 (Suppl 1): 65-7.
18. Marcelli D, Stannard D, Conte F, Held P, Locatelli F, Port F. ESRD patient mortality with adjustment for comorbid conditions in Lom-
bardy (Italy) versus the United States. Kidney Int 1996; 50: 1013-8.
19. Gentil M, Carriazo A, Pavon M, Rosado M, Castillo D, Ramos B.
Comparison of survival in continuous ambulatory peritoneal dialy- sis and hospital haemodialysis: a multicentric study. Nephrol Dial Transplant 1991; 6: 444-51.
20. Maiorca R, Cancarini G, Zubani R, Camerini C, Manili L, Brunori G. CAPD viability: a long-term comparison with hemodialysis. Perit Dial Int 1996; 16: 276-87.
21. Port F, Wolfe R, Bloembergen W, Held P, Young E. The study of outcomes for CAPD versus hemodialysis patients. Perit Dial Int 1996;
16: 628-33.
22. Foley RN, Parfrey PS, Harnett JD, Kent GM, O’Dea R, Murray D, Barre PE. Mode of dialysis therapy and mortality in end-stage renal disease. J Am Soc Nephrol 1998; 9: 267-76.
23. Churchill D. Can peritoneal dialysis be equivalent to (or better than) optimal hemodialysis? Semin Dial 1996; 9: 240-1.
24. ERA-EDTA Registry: ERA-EDTA Registry 2003 Annual Report. Aca- demic Medical Center, Amsterdam, The Netherlands, May 2005.
25. Vonesh EF, Snyder JJ, Foley RN, Collins AJ. The differntial impact of risk factors on mortality in hemodialysis and peritoneal dialysis.
Kidney Int 2004; 66: 2389-401.
26. Paniagua R, Amato D, Vonesh E, Correa-Rotter R, Ramos A, Moran J, Mujais S. Effects of increased peritoneal clearances on mortality rates in peritoneal dialysis: ADEMEX, a prospective, randomized, controlled trial. J Am Soc Nephrol 2002; 13: 1307-20.
27. Biesen WV, Vanholder RC, Veys N, Dhondt A, Lameire NH. An evaluation of an integrative care approach for end-stage renal dis- ease patients. J Am Soc Nephrol 2000; 11: 116-25.
28. Lameire N. The impact of residual renal function on the adequacy of peritoneal dialysis. Nephron 1997; 77: 13-28.
29. Passauer J, Bussemaker E, Range U, Plug A, Gross P. Evidence in vivo showing increase of baseline nitric oxide generation and impairment of endothelium-dependent vasodilation in normotensive patients on chronic hemodialysis. J Am Soc Nephrol 2000; 11: 1726-34.
30. Van Guldener C, Janssen M, Lambert J, Steyn M, Donker A, Ste- houwer C. Endothelium-dependent vasodilation is impaired in peri- toneal dialysis patients. Nephrol Dial Transplant 1998; 13: 1782-6.
31. Espinosa A, Cueto-Manzano AM, Velazquez-alva C, Hernandez A, Cruz N, Zamora B, Chaparro A, Irigoyen E, Correa-Rotter R. Preva- lence of malnutrition in Mexican CAPD diabetic and nondiabetic patients. Adv Perit Dial 1996; 12: 302-6.
32. Acchiardo SR, Moore LW, Latour PA. Malnutrition as the main fac- tor in morbidity and mortality of dialysis patients. Kidney Int 1986;
24: 199-203.
33. Teehan BP, Schlelfer CR, Brown JM, Sigler MH, Raimondo J. Urea kinetic analysis and clinical outcome on CAPD. A five year longitu- dinal study. Adv Perit Dial 1990; 6: 181-5.
34. Ganesh SK, Hulbert-Shearon T, Port FK, Eagle K, Stack AG. Mor- tality differences by dialysis modality among incident ESRD patients with and without coronary artery disease. J Am Soc Nephrol 2003;
14: 415-24.
35. Stack AG, Molony DA, Rahman NS, Dosekun A, Murthy B. Impact of dialysis modality on survival of new ESRD patients with conges- tive heart failure in the United States. Kidney Int 2003; 64: 1071-9.