There are many studies showing that nutritional status is an independent auxiliary indicator asso- ciated with the prevalence of and mortality from maintenance hemodialysis (HD) and peritoneal dialysis (PD). Various indicators have previously
been reported to be associated with nutritional status in patients with maintenance HD and PD.
Some of these indicators are quite subjective, while others are complex, making them difficult to measure in clinical settings.
Original Article
Relationships of Total Lymphocyte Count and
Subpopulation Lymphocyte Counts with the Nutritional Status in Patients Undergoing Hemodialysis/Peritoneal Dialysis
Ye Na Kim, Ho Sik Shin
Department of Internal Medicine, College of Medicine, Kosin University, Busan, Korea
Objectives: Dialysis patients’ nutritional indicators are quite subjective and complex and cannot be easily measured in clinical settings. Based on previous reports that total lymphocyte count (TLC) and subpopulation lymphocyte counts (SLCs) are associated with nutritional status in patients with dialysis, we designed this study to examine the relationships of the TLC and SLCs with clinical outcome and nutritional status in patients undergoing maintenance hemodialysis (HD) and peritoneal dialysis (PD).
Methods: In this prospective, observational study, we enrolled 66 patients (50 HD patients and 16 PD patients) receiving stable maintenance dialysis. We evaluated the baseline parameters of height; weight; TLC; SLCs expressing CD3, CD4, CD8 and CD19; CBC; iron profile (iron, TIBC, ferritin); BUN; Cr; Na; K; total CO2;
Ca; P; iPTH; protein; albumin; total cholesterol; HDL; LDL; uric acid and CRP and calculated Onodera’s prognostic nutritional index (OPNI) and the Geriatric Nutritional Risk Index (GNRI) at baseline and three months. To analyze differences in the TLC and SLCs between the HD group and the PD group, we performed an independent samples t-test. Logistic regression analysis was performed to predict malnutrition in dialysis patients. In addition, to analyze changes in TLC, SLCs expressing each marker (CD3, CD4, CD8 and CD19) and other nutritional markers, we performed general linear model (GLM)-repeated measures ANOVA.
Results: Mean age was 55.8 ± 12.7 years in HD paitents and 49.8 ± 14.5 years in PD patients. The duration of dialysis was 59.7 ± 52.9 months in HD patients and 66.1 ± 33.6 years in PD patients. Logistic regression analysis revealed that patients aged 60 years or older, women, and those whose CD19 SLCs were lower than 100 had a higher risk of developing malnutrition. In GLM-repeated measures ANOVA, CD19 SLCs were significantly higher in women and in patients with a shorter period of dialysis.
Conclusions: Our results indicate that GNRI, OPNI, TLC and SLCs (especially CD19 count) may be significant nutritional markers in HD and PD patients.
Key Words: Dialysis, Lymphocyte Count, Total Lymphocyte Counts
Corresponding Author: Ho Sik Shin, Department of Internal Medicine, Kosin University College of Medicine, Kosin University, 262, Gamcheon-ro, Seo-gu, Busan 49267, Korea
Tel: +82-51-990-6250 Fax: +82-51-248-5686 E-mail: [email protected]
Received:
Revised:
Accepted:
Sep. 24, 2015 Dec. 15, 2015 Jan. 11, 2016
Recently, Yamada et al. reported that Geriatric Nutritional Risk Index (GNRI) was a useful tool in assessing the nutritional status in chronic HD patients.1 Panichi reported that lower GNRI is as- sociated with malnutrition and it is a strong pre- dictor of overall mortality in HD patients and oth- er author reported that GNRI was a simple method for predicting nutritional status and clinical out- comes in PD patients.2,3
Onodera et al. first reported the validity of the Onodera’s prognostic nutritional index (OPNI) in predicting the prognosis in 189 patients under- going gastrointestinal surgeries.4 The equation for the OPNI includes the serum albumin level and the total lymphocyte count (TLC). Moreover, it is a simple method for predicting the nutritional sta- tus and clinical outcome of PD patients.5 It is known that immunological disturbances (e.g., an increased ratio of Th1/Th2 and reduced B-cell count) occur as a result of conditions such as ure- mia in patients with end-stage renal disease (ESRD).6 Recently, it has been shown that TLC and subpopulation lymphocyte counts (SLCs) are use- ful in monitoring the nutritional status of PD patients.7 However, there is still controversy re- garding the value of TLC as a suitable marker of protein-calorie malnutrition. Nevertheless, TLC has been shown to be helpful in monitoring nutri- tional status and assessing prognosis in PD patients.8 Higher SLCs in PD patients are asso- ciated with higher clinical–laboratory scores, which indicate more effective PD treatment.7 Based on previous reports that TLC and SLCs are
associated with nutritional status in patients with dialysis, we designed this study to examine the relationships of TLC and SLCs with clinical out- comes and nutritional status in patients under- going maintenance HD or PD.
MATERIAL AND METHOD
In this prospective, observational study, we en- rolled 66 patients (50 HD patients and 16 PD pa- tients) receiving stable maintenance dialysis at Kosin University Gospel Hospital. Their clinical and laboratory data were retrieved from medical records. The current study was approved by the Institutional Review Board (IRB) of Kosin University Gospel Hospital. All the patients sub- mitted a written informed consent.
1. Inclusion and Exclusion Criteria
(1) Inclusion criteria : Patients who met all the inclusion criteria were eligible for study participation.
(1)-1. End-stage renal failure: Patients who had a persistent eGFR < 15 ㎖/min for more than three months
Estimated glomerular filtration rate (eGFR, (㎖
/min/1.73 ㎡)) by MDRD equation9 = 175 × (Scr)-1.154 × (Age)-0.203 × (0.742 if female) × (1.212 if African American)
(1)-2. Patients aged between 20 and 90 years (1)-3. Patients for whom more than three months had elapsed since HD or PD was initiated.
a. Patients with HD: The HD was performed
three times a week for four hours each, using a dialysate containing glucose and bicarbonate and a hollow fiber dialysis membrane. The velocity of blood flow and dialysate were maintained at
> 200 ㎖/min and 500 ㎖/min, respectively. With the help of a dietitian, patients were instructed to refrain from consuming sodium, potassium and fruit and to consume calories and protein at levels of 35 kcal energy/㎏/day and 1.2 g/㎏/day, respectively. The patients were also instructed to report their actual caloric and protein intakes.
b. Patients with PD: Patients were receiving continuous ambulatory PD, in which the dialysis was performed using a 2-L dialysate (standard acid, lactate- and glucose-containing dialysate) four times per day. The concentration of dialysate varied, ranging from 1.50% to 4.25%, depending on the hydration status of the patient.
(2) Exclusion criteria: Any patients who met any of the following exclusion criteria were ineligible for study participation.
Patients who were diagnosed with car- diovascular disease within the past three months or who currently had cardiovascular disease.
Patients who had experienced gastrointestinal bleeding within the past three months or who was currently experiencing bleeding.
Patients who were diagnosed with neurological disease (e.g., stroke or meningitis) within the past three months or who had a current diagnosis.
Patients with malignancies (however, patients with a stable status without recurrence for more than five years after the diagnosis and treatment
of malignancies were eligible for study partic- ipation)
Patients with apparent infections
(3) Criteria for study termination and drop-out - Patients who withdrew informed consent for study participation
- Patients who were transferred to other hospi- tals
- Inappropriate enrollment: Patients who vio- lated inclusion/exclusion criteria
- Patients who requested to cease participation due to the occurrence of serious adverse events (SAEs) or adverse events (AEs)
- Patients with loss of follow-up
- Patients who were deemed to be ineligible for study participation according to the judgment of the investigators
2. The Methods and Period of the Clinical Trial In patients undergoing HD or PD for more than three months following diagnosis with ESRD, we evaluated the parameters of height; weight; TLC;
SLCs expressing CD3, CD4, CD8 and CD19; CBC;
iron profile (iron, TIBC (Total iron binding ca- pacity), ferritin); BUN; Cr; Na; K; total CO2; Ca;
P; iPTH; protein; albumin; total cholesterol;
HDL(High Density Lipoprotein); LDL(Low Density Lipoprotein); uric acid and CRP(C-Reactive Protein) at baseline and three months. The current study was conducted from January to December of 2013.
3. Clinical Parameters
1) Height, weight, TLC, CBC, iron profile (iron, TIBC, ferritin), BUN, Cr, Na, K, total CO2, Ca, P, iPTH, protein, albumin, total cholesterol, HDL, LDL, uric acid, and CRP
2) With the use of the serum albumin (malnutrition : serum albumin < 3.0 g/dL) as the reference standard, a receiver operating charac- teristic (ROC) curve was generated for each nutri- tional screening tool (GNRI, OPNI); the area under the ROC curve (AUC) indicated the probability of discriminating a nutritional risk (AUC = 0.691 (95%
CI, 0.612-0.723), sensitivity : 48.1%, specificity : 78.3%, P < 0.05). The cutoff risk point of nutrition for each tool was then defined from the highest sensitivity – (1 - specificity) value in the ROC curve.
3) The OPNI was calculated based on the serum albumin level and TLC, using the following equa- tion: OPNI = [10 × serum albumin (g/dL)] + [0.005
× TLC (/mL)]. Values of OPNI < 45 were defined as malnutrition.
4) GNRI = [14.89 × albumin (g/dL)] + [41.7 × (weight/ ideal body weight)]
Note that body weight/ideal body weight was greater than 1 when a subject’s body weight ex- ceeded his ideal body weight. The ideal body weight was calculated using height and a BMI of 22, which is reportedly associated with the lowest morbidity rate in the Asian population.10 Values of GNRI < 100 were defined as malnutrition.
5) SLCs expressing each marker (CD3, CD4, CD8 and CD19): The SLCs were evaluated using flow cytometry. The analyses included CD3 cells (T lymphocytes), CD4 cells (helper lymphocytes),
CD8 cells (cytotoxic-suppressor lymphocytes) and CD19 cells (B lymphocytes). In HD patients, whole blood was collected from the vascular access port prior to the initiation of dialysis, while that in PD patients was collected from a vein prior to the initiation of dialysis. The blood samples were obtained through a syringe, with gentle aspiration to minimize shear stress. Based on values contain- ing lower 1/3, the patients were divided into two groups: TLC and SLCs.
4. Endpoint
Clinical characteristics of the patients were evaluated at baseline and three months. We there- fore analyzed changes in TLC and SLCs three months from baseline and examined their rela- tionships with other nutritional parameters.
1) Primary endpoint: Changes in TLC and SLCs at three months from baseline
2) Secondary endpoints:
- A comparison between the two groups (the HD group and the PD group): Changes in TLC, SLCs expressing each marker (CD3, CD4, CD8 and CD19), other nutritional markers (CBC and iron profile [iron, TIBC and ferritin]), BUN, Cr, Na, K, Ca, P, iPTH, protein, albumin, total cholesterol, HDL, LDL, uric acid and CRP, three months from baseline
- An intra-group comparison: Changes in TLC, SLCs expressing each marker (CD3, CD4, CD8 and CD19), other nutritional markers (CBC and iron profile [iron, TIBC and ferritin]), BUN, Cr, Na, K, Ca, P, iPTH, protein, albumin, total cholesterol,
HDL, LDL, uric acid and CRP, three months from baseline
5. Statistical Analysis
Data are expressed as mean±standard devia- tion (SD). To analyze the differences in TLC and SLCs between the HD group and the PD group, we performed an independent samples t-test.
Logistic regression analysis was performed to pre- dict malnutrition in dialysis patients. In addition, to analyze changes in TLC, SLCs expressing each marker (CD3, CD4, CD8 and CD19), other nutri- tional markers (CBC and iron profile [iron, TIBC and ferritin]), BUN, Cr, Na, K, Ca, P, iPTH, protein, albumin, total cholesterol, HDL and LDL, we per- formed GLM-repeated measures ANOVA. P-val- ues < 0.05 were considered statistically significant.
Statistical analysis was performed using SPSS ver- sion 21.0 for Windows (SPSS, Inc., Chicago, IL, USA).
RESULTS
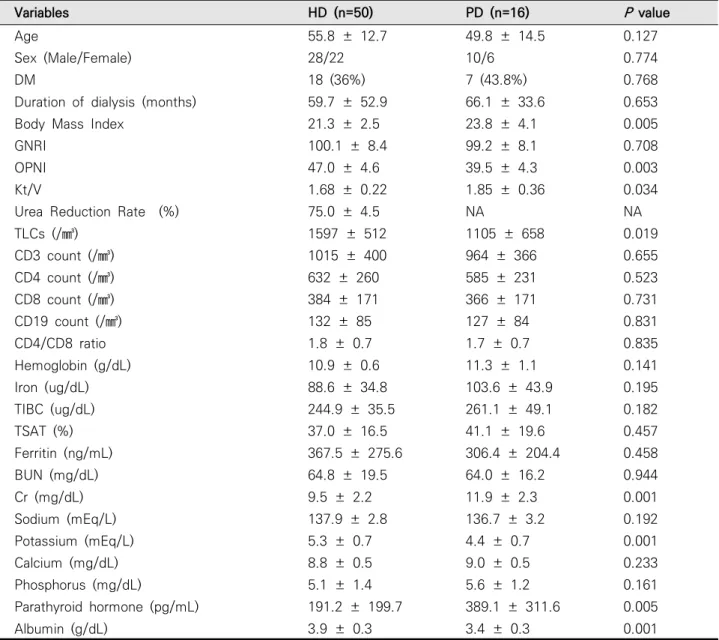
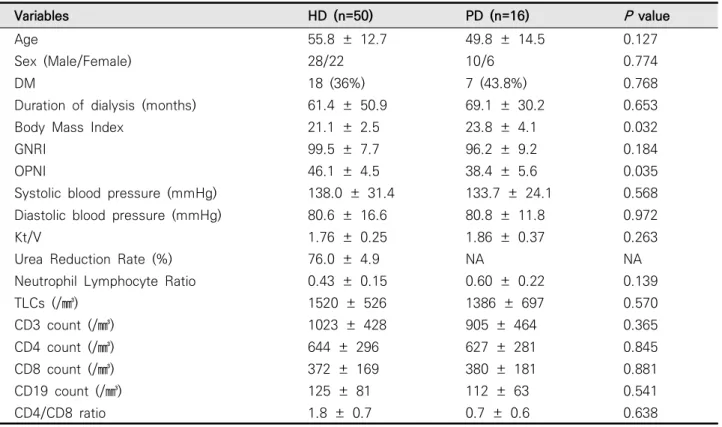
The clinical characteristics of the patients in the HD and PD groups at baseline were summar- ized (Table 1,2). There were no significant differ- ences in age, sex, diabetes mellitus history or pe- riod of dialysis, total CO2, protein, total cholester- ol, HDL, LDL, uric acid, CRP between the two groups. In the HD group, OPNI and potassium and albumin levels were significantly higher than in the PD group (Table 1). In the PD group, BMI,
dialysis-adequacy and PTH level were sig- nificantly higher than in the HD group (Table 1).
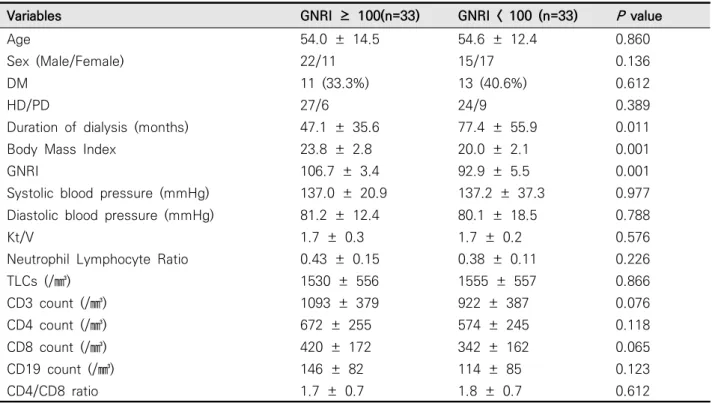
We compared the two groups based on GNRI 100 and found that there was no significant differ- ence in TLC between the two groups at baseline (Table 3). In addition, CD3 count at baseline was significantly higher in the group with a GNRI >
100. No other SLCs showed a significant differ- ence between the two groups at baseline, al- though the values were higher in GNRI > 100 group.
We compared the two groups based on OPNI 45 (Table 4). This analysis revealed that TLC and CD3, CD4, CD8 and CD19 SLCs were significantly higher in the group with OPNI > 45 at baseline.
Baseline measurements of GNRI < 100 were de- fined as malnutrition (Table 5). The results of the logistic regression analysis were summarized accordingly. Patients aged 60 years or older (OR 10.783, CI 1.936-60.059), women (OR 6.643, CI 1.269-34.788) and those with CD19 SLCs less than 100 (OR 9.202, CI 1.481-57.191) had a higher risk of developing malnutrition.
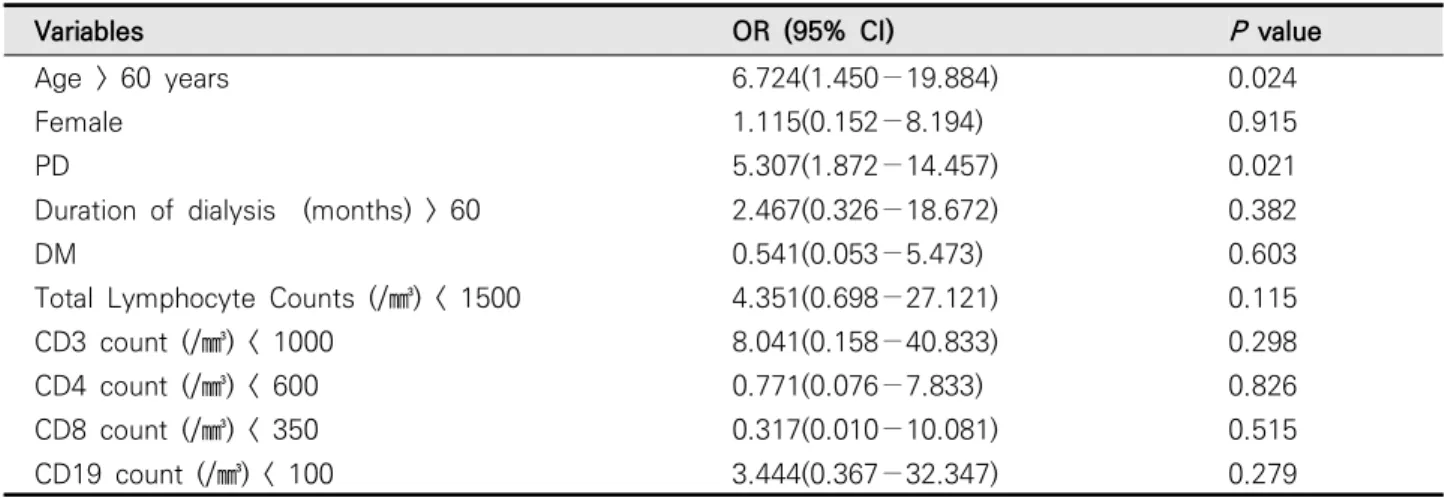
The results of the logistic regression analysis, indicating the occurrence of malnutrition, here defined as OPNI < 45, at three months were showed (Table 6). Patients aged 60 years or older (OR 6.724, CI 1.450-19.884) and those undergoing PD (OR 5.307, CI 1.872-14.457) had a significantly higher risk of developing malnutrition. However, there were no significant differences in TLC or SLCs between the two groups. Three months later, we performed logistic regression analysis, which
revealed that there was a significantly higher risk of malnutrition in patients undergoing PD (OR 6.945, CI 2.609-24.374), whose TLCs were lower than 1500 (OR 19.597, CI 2.717-41.335) and whose CD4 SLCs were lower than 600 (OR 15.618, CI 4.074-27.159). (data was not shown)
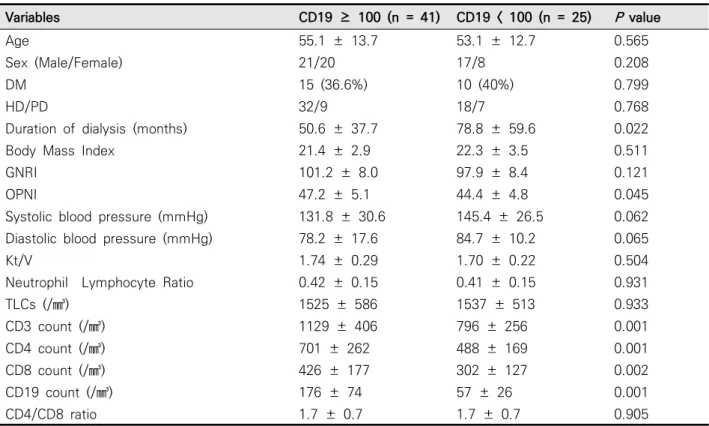
Based on a cut-off value of 100 for CD19 SLCs
at baseline, we divided our clinical series of pa- tients into two groups and compared their clinical characteristics (Table 7). This comparison re- vealed that the period of dialysis and OPNI were significantly shorter and higher, respectively, in the patients with CD19 SLCs > 100.
We performed GLM-repeated measures ANOVA
Variables HD (n=50) PD (n=16) P value
Age 55.8 ± 12.7 49.8 ± 14.5 0.127
Sex (Male/Female) 28/22 10/6 0.774
DM 18 (36%) 7 (43.8%) 0.768
Duration of dialysis (months) 59.7 ± 52.9 66.1 ± 33.6 0.653
Body Mass Index 21.3 ± 2.5 23.8 ± 4.1 0.005
GNRI 100.1 ± 8.4 99.2 ± 8.1 0.708
OPNI 47.0 ± 4.6 39.5 ± 4.3 0.003
Kt/V 1.68 ± 0.22 1.85 ± 0.36 0.034
Urea Reduction Rate (%) 75.0 ± 4.5 NA NA
TLCs (/㎣) 1597 ± 512 1105 ± 658 0.019
CD3 count (/㎣) 1015 ± 400 964 ± 366 0.655
CD4 count (/㎣) 632 ± 260 585 ± 231 0.523
CD8 count (/㎣) 384 ± 171 366 ± 171 0.731
CD19 count (/㎣) 132 ± 85 127 ± 84 0.831
CD4/CD8 ratio 1.8 ± 0.7 1.7 ± 0.7 0.835
Hemoglobin (g/dL) 10.9 ± 0.6 11.3 ± 1.1 0.141
Iron (ug/dL) 88.6 ± 34.8 103.6 ± 43.9 0.195
TIBC (ug/dL) 244.9 ± 35.5 261.1 ± 49.1 0.182
TSAT (%) 37.0 ± 16.5 41.1 ± 19.6 0.457
Ferritin (ng/mL) 367.5 ± 275.6 306.4 ± 204.4 0.458
BUN (mg/dL) 64.8 ± 19.5 64.0 ± 16.2 0.944
Cr (mg/dL) 9.5 ± 2.2 11.9 ± 2.3 0.001
Sodium (mEq/L) 137.9 ± 2.8 136.7 ± 3.2 0.192
Potassium (mEq/L) 5.3 ± 0.7 4.4 ± 0.7 0.001
Calcium (mg/dL) 8.8 ± 0.5 9.0 ± 0.5 0.233
Phosphorus (mg/dL) 5.1 ± 1.4 5.6 ± 1.2 0.161
Parathyroid hormone (pg/mL) 191.2 ± 199.7 389.1 ± 311.6 0.005
Albumin (g/dL) 3.9 ± 0.3 3.4 ± 0.3 0.001
GNRI : Geriatric Nutritional Risk Index; OPNI : Onodera’s prognostic nutritional index;
Kt/V : Dialysis adequacy; TLCs : Total lymphocyte counts; NA : Not Applicable;
TIBC : Total iron binding capacity; TAST : transferrin saturation.
Table 1. Clinical characteristics of 66 dialysis patients according to methods of dialysis at start of the study
of the TLC, CD3 SLCs, CD4 SLCs, CD8 SLCs and CD19 SLCs, respectively, and compared the dif- ferences between the two groups at baseline and three months. This analysis revealed that a shorter period of dialysis had a significant correlation with higher TLC at both baseline and three months (Table 8). CD3 SLCs tended to be higher in patients undergoing HD, those with a shorter period of dialysis and those without diabetes mellitus, de- spite a lack of statistical significance. CD4 SLCs tended to be higher in patients with a shorter peri- od of dialysis, despite a lack of statistical significance. CD8 SLCs tended to be higher in pa- tients without diabetes mellitus, despite a lack of statistical significance (data was not shown about
CD 3,4,8). CD19 SLCs were significantly higher in women and in patients with a shorter period of dialysis (Table 9).
DISCUSSION
Our results indicate that GNRI, OPNI, TLC and SLCs (particularly CD19 count) may be significant nutritional markers in HD and PD patients.
The present study showed that TLCs were sig- nificantly higher in patients with a shorter period of dialysis at both baseline and three months. In addition, CD19 SLCs were significantly higher in patients with a shorter period of dialysis and
Variables HD (n=50) PD (n=16) P value
Age 55.8 ± 12.7 49.8 ± 14.5 0.127
Sex (Male/Female) 28/22 10/6 0.774
DM 18 (36%) 7 (43.8%) 0.768
Duration of dialysis (months) 61.4 ± 50.9 69.1 ± 30.2 0.653
Body Mass Index 21.1 ± 2.5 23.8 ± 4.1 0.032
GNRI 99.5 ± 7.7 96.2 ± 9.2 0.184
OPNI 46.1 ± 4.5 38.4 ± 5.6 0.035
Systolic blood pressure (mmHg) 138.0 ± 31.4 133.7 ± 24.1 0.568 Diastolic blood pressure (mmHg) 80.6 ± 16.6 80.8 ± 11.8 0.972
Kt/V 1.76 ± 0.25 1.86 ± 0.37 0.263
Urea Reduction Rate (%) 76.0 ± 4.9 NA NA
Neutrophil Lymphocyte Ratio 0.43 ± 0.15 0.60 ± 0.22 0.139
TLCs (/㎣) 1520 ± 526 1386 ± 697 0.570
CD3 count (/㎣) 1023 ± 428 905 ± 464 0.365
CD4 count (/㎣) 644 ± 296 627 ± 281 0.845
CD8 count (/㎣) 372 ± 169 380 ± 181 0.881
CD19 count (/㎣) 125 ± 81 112 ± 63 0.541
CD4/CD8 ratio 1.8 ± 0.7 0.7 ± 0.6 0.638
GNRI : Geriatric Nutritional Risk Index; OPNI : Onodera’s prognostic nutritional index;
Kt/V : Dialysis adequacy; TLCs : Total lymphocyte counts; NA : Not Applicable
Table 2. Clinical characteristics of 66 dialysis patients according to methods of dialysis after 3 month
Variables GNRI ≥ 100(n=33) GNRI < 100 (n=33) P value
Age 54.0 ± 14.5 54.6 ± 12.4 0.860
Sex (Male/Female) 22/11 15/17 0.136
DM 11 (33.3%) 13 (40.6%) 0.612
HD/PD 27/6 24/9 0.389
Duration of dialysis (months) 47.1 ± 35.6 77.4 ± 55.9 0.011
Body Mass Index 23.8 ± 2.8 20.0 ± 2.1 0.001
GNRI 106.7 ± 3.4 92.9 ± 5.5 0.001
Systolic blood pressure (mmHg) 137.0 ± 20.9 137.2 ± 37.3 0.977 Diastolic blood pressure (mmHg) 81.2 ± 12.4 80.1 ± 18.5 0.788
Kt/V 1.7 ± 0.3 1.7 ± 0.2 0.576
Neutrophil Lymphocyte Ratio 0.43 ± 0.15 0.38 ± 0.11 0.226
TLCs (/㎣) 1530 ± 556 1555 ± 557 0.866
CD3 count (/㎣) 1093 ± 379 922 ± 387 0.076
CD4 count (/㎣) 672 ± 255 574 ± 245 0.118
CD8 count (/㎣) 420 ± 172 342 ± 162 0.065
CD19 count (/㎣) 146 ± 82 114 ± 85 0.123
CD4/CD8 ratio 1.7 ± 0.7 1.8 ± 0.7 0.612
GNRI : Geriatric Nutritional Risk Index; OPNI : Onodera’s prognostic nutritional index;
Kt/V : Dialysis adequacy; TLCs : Total lymphocyte counts.
Table 3. Clinical characteristics of 66 dialysis patients according to GNRI at start of the study
Variables OPNI ≥ 45 (n=46) OPNI < 45 (n=20) P value
Age 53.2 ± 14.0 59.3 ± 10.5 0.080
Sex (Male/Female) 25/21 13/7 0.768
DM 18 (39.1%) 7 (35.3%) 0.988
HD/PD 39/7 11/9 0.002
Duration of dialysis (months) 50.8 ± 38.6 89.0 ± 66.8 0.009
Body Mass Index 21.7 ± 2.6 21.9 ± 3.3 0.797
OPNI 49.0 ± 2.6 39.7 ± 3.6 0.001
Systolic blood pressure (mmHg) 139.9 ± 25.5 133.5 ± 44.1 0.492 Diastolic blood pressure (mmHg) 80.2 ± 12.2 80.1 ± 24.3 0.986
Kt/V 1.7 ± 0.2 1.6 ± 0.2 0.476
Neutrophil Lymphocyte Ratio 0.38 ± 0.10 0.48 ± 0.18 0.011
TLCs (/㎣) 1710 ± 475 1164 ± 552 0.001
CD3 count (/㎣) 1085 ± 419 863 ± 353 0.049
CD4 count (/㎣) 677 ± 268 524 ± 222 0.034
CD8 count (/㎣) 411 ± 181 326 ± 160 0.089
CD19 count (/㎣) 141 ± 77 96 ± 89 0.061
CD4/CD8 ratio 1.8 ± 0.7 1.7 ± 0.7 0.851
GNRI : Geriatric Nutritional Risk Index; OPNI : Onodera’s prognostic nutritional index;
Kt/V : Dialysis adequacy; TLCs : Total lymphocyte counts.
Table 4. Clinical characteristics of 66 dialysis patients according to OPNI 45 at start of the study
women.
In order to contain the stable patients in the study, any patients who were diagnosed with car- diovascular disease, gastrointestinal bleeding and neurological disease (e.g., stroke or meningitis) within the past three months were excluded.
The GNRI is a very simple and objective method based on body weight, height and serum albumin level and is used to assess nutritional status in a number of pathological conditions. Some studies have investigated the reliability of GNRI in assess- ing malnutrition in chronic HD and PD patients.1,3 According to a recent European study, a low GNRI
score can be considered a simple and reliable marker of malnutrition and a predictor for mor- tality risk in Caucasian HD patients.2 According to another recent study, GNRI is a valid tool for the longitudinal assessment of nutritional status in HD patients.11 Our previous study also showed similar findings.12 In the current study, at three months, total cholesterol and BUN, both of which are nutritional indicators, were higher in the group with a higher GNRI at three months. Thus, we confirmed that GNRI is a reliable nutritional indicator.
The equation for OPNI includes serum albumin
Variables OR (95% CI) P value
Age > 60 years 10.783(1.936−60.059) 0.007
Female 2.115(0.752−9.194) 0.255
PD 3.159(0.338−29.533) 0.313
Duration of dialysis (months) > 60 0.705(0.136−3.657) 0.677
DM 1.507(0.342−6.633) 0.588
Total Lymphocyte Counts (/㎣) < 1500 0.473(0.113−1.972) 0.304
CD3 count (/㎣) < 1000 0.598(0.040−8.996) 0.711
CD4 count (/㎣) < 600 0.969(0.176−5.329) 0.971
CD8 count (/㎣) < 350 3.509(0.331−37.193) 0.297
CD19 count (/㎣) < 100 9.202(1.481−57.191) 0.017
Table 5. Logistic regression for predicting malnutrition according to GNRI 100 at start of the study
Variables OR (95% CI) P value
Age > 60 years 6.724(1.450−19.884) 0.024
Female 1.115(0.152−8.194) 0.915
PD 5.307(1.872−14.457) 0.021
Duration of dialysis (months) > 60 2.467(0.326−18.672) 0.382
DM 0.541(0.053−5.473) 0.603
Total Lymphocyte Counts (/㎣) < 1500 4.351(0.698−27.121) 0.115
CD3 count (/㎣) < 1000 8.041(0.158−40.833) 0.298
CD4 count (/㎣) < 600 0.771(0.076−7.833) 0.826
CD8 count (/㎣) < 350 0.317(0.010−10.081) 0.515
CD19 count (/㎣) < 100 3.444(0.367−32.347) 0.279
Table 6. Logistic regression for predicting malnutrition according to OPNI 45 at start of study
level and TLC. A simpler tool may involve common measures. It has also recently been shown that OPNI is a simple method for predicting nutritional status in PD patients.5
In patients undergoing HD, as compared with those undergoing PD, OPNI and TLC were sig- nificantly higher. In addition, despite a lack of statistical significance, SLCs were relatively high- er (Table 1). In particular, in the group with OPNI
> 45, both TLC and SLCs were significantly higher.
Despite a lack of statistical significance, nutri- tional indicators such as Hb, Kt/V, iron and K also tended to be higher. Thus, we confirmed that OPNI is a reliable nutritional indicator.
Further studies are warranted to examine
whether OPNI is a reliable nutritional indicator in a larger cohort of patients undergoing HD.
OPNI validation has not been widely performed in patients with chronic kidney disease,. This may be due to several limitations such as the applica- tion of serum albumin level and TLC as variables for OPNI and changes in OPNI based on variable conditions.
TLC was significantly higher in patients under- going HD. Among T-cell populations, although the number of circulating CD3 and CD4 cells was lower and a reduced ratio of CD4 to CD8 cells was observed in our ESRD patients, the differ- ences were not significant (Table 1).The depletion of the T-cell population in our study could be ex- Variables CD19 ≥ 100 (n = 41) CD19 < 100 (n = 25) P value
Age 55.1 ± 13.7 53.1 ± 12.7 0.565
Sex (Male/Female) 21/20 17/8 0.208
DM 15 (36.6%) 10 (40%) 0.799
HD/PD 32/9 18/7 0.768
Duration of dialysis (months) 50.6 ± 37.7 78.8 ± 59.6 0.022
Body Mass Index 21.4 ± 2.9 22.3 ± 3.5 0.511
GNRI 101.2 ± 8.0 97.9 ± 8.4 0.121
OPNI 47.2 ± 5.1 44.4 ± 4.8 0.045
Systolic blood pressure (mmHg) 131.8 ± 30.6 145.4 ± 26.5 0.062 Diastolic blood pressure (mmHg) 78.2 ± 17.6 84.7 ± 10.2 0.065
Kt/V 1.74 ± 0.29 1.70 ± 0.22 0.504
Neutrophil Lymphocyte Ratio 0.42 ± 0.15 0.41 ± 0.15 0.931
TLCs (/㎣) 1525 ± 586 1537 ± 513 0.933
CD3 count (/㎣) 1129 ± 406 796 ± 256 0.001
CD4 count (/㎣) 701 ± 262 488 ± 169 0.001
CD8 count (/㎣) 426 ± 177 302 ± 127 0.002
CD19 count (/㎣) 176 ± 74 57 ± 26 0.001
CD4/CD8 ratio 1.7 ± 0.7 1.7 ± 0.7 0.905
GNRI : Geriatric Nutritional Risk Index; OPNI : Onodera’s prognostic nutritional index;
Kt/V : Dialysis adequacy; TLCs : Total lymphocyte counts
Table 7. Clinical characteristics of 66 dialysis patients according to CD19 count at start of the study
plained by the effects of uremia and malnutrition.
Our results are consistent with previous reports that T-lymphocyte populations are significantly reduced in ESRD patients.6
In patients with ESRD, SLCs have been reported to be lower than those in normal healthy individuals.13 This is also consistent with our results. The reasons for the reduced SLCs include uremia and anemia. Moreover, malnutrition has also been reported to be one of the major causes of reduced SLCs.13 In our study; there were sig- nificantly decreased number of total B cells (CD 19 cells). In our study, there was a significantly smaller number of total B cells (CD19 cells) in
ESRD patients, consistent with a previous report.6 Malnutrition is asso¬ciated with a reduced CD4:CD8 ratio as well as the appear¬ance of pe- ripheral immature T cells.14 A reduction in a par- ticular lymphocyte type is typically associated with the level of a specific nutrient (e.g., the known association between β-carotene and CD19).7 It would be valuable to identify these cor- relations in order to determine the insufficient nutrients.
In our previous study, we found that TLC may be used as a simple nutritional tool and is margin- ally correlated with GNRI in HD patients.15 In ad dition, TLC has been used as a measure of visceral
Variables Baseline 3 months P value*
Age
Age ≥ 60 years (n = 28) 1615 ± 535 1606 ± 550 0.193
Age < 60 years (n = 38) 1470 ± 550 1421 ± 474 0.193
P value+ 0.472 0.621
Sex
Male (n = 38) 1588 ± 563 1558 ± 593 0.547
Female (n = 28) 1506 ± 518 1486 ± 401 0.547
P value+ 0.533 0.891
Dialysis
Hemodialysis (n = 50) 1597 ± 512 1514 ± 522 0.433
Peritoneal Dialysis (n = 16) 1417 ± 625 1569 ± 520 0.433
P value+ 0.009 0.009
Duration of dialysis
Duration ≥ 60 months (n = 30) 1464 ± 551 1450 ± 508 0.223 Duration < 60 months (n = 36) 1628 ± 530 1592 ± 525 0.223
P value+ 0.043 0.043
DM
Yes (n = 25) 1587 ± 495 1508 ± 501 0.372
No (n = 41) 1533 ± 574 1539 ± 534 0.372
P value+ 0.292 0.292
*P-values by treatment period obtained from linear model using repeated measured ANOVA
+P-values by content obtained from linear model using repeated measured ANOVA Table 8. Total lymphocyte count by several variables
protein status and nutrition.8 Based on our results, it is presumed that SLCs could be an indicator of nutritional status in the same manner as GNRI.
This deserves further investigation in large-scale, prospective, long-term studies.
As shown in Tables 4 and 7, OPNI is calculated using a formula based on TLCs and leads to the speculation that it reflects changes in SLCs rather than those of GNRI. It can be inferred that OPNI would be more useful than GNRI in evaluating nutritional status in patients undergoing dialysis.
As shown in Tables 5 and 6, we examined whether GNRI, OPNI and/or SLC was more useful in predicting malnutrition compared with other
parameters. Our results suggest that both TLC and SLCs are useful indicators for the prediction of malnutrition.
As shown in Tables 8-9, we performed GLM-re- peated measures ANOVA of changes in TLC and SLCs three months from baseline. In addition, we compared various parameters between the two groups. This analysis revealed that a shorter period of dialysis was associated with higher TLC and SLCs, particularly in the CD4 and CD19 subpopulations, indicating that the period of dialysis might have a significant correlation with malnutrition.
There are several limitations of the current study:
Variables Baseline 3 months P value*
Age
Age ≥ 60 years (n = 28) 135 ± 93 126 ± 80 0.206
Age < 60 years (n = 38) 128 ± 77 118 ± 73 0.206
P value+ 0.709 0.709
Sex
Male (n = 38) 114 ± 63 111 ± 66 0.146
Female (n = 28) 154 ± 103 135 ± 87 0.146
P value+ 0.043 0.043
Dialysis
Hemodialysis (n = 50) 132 ± 85 124 ± 80 0.179
Peritoneal Dialysis (n = 16) 127 ± 84 111 ± 61 0.179
P value+ 0.666 0.666
Duration of dialysis
Duration ≥ 60 months (n = 30) 106 ± 78 94 ± 55 0.190
Duration < 60 months (n = 36) 152 ± 78 144 ± 84 0.190
P value+ 0.009 0.009
DM
Yes (n = 25) 118 ± 68 116 ± 61 0.294
No (n = 41) 139 ± 92 124 ± 84 0.294
P value+ 0.449 0.449
*P-values by treatment period obtained from linear model using repeated measured ANOVA
+P-values by content obtained from linear model using repeated measured ANOVA Table 9. CD19 count by several variables
(1) We conducted the study using a prospective observational design. Because we examined con- troversial issues, further well-designed, pro- spective, randomized, controlled studies are war- ranted to confirm our results. (2) We enrolled a small number of patients. (3) We failed to analyze the relationships of GNRI, OPNI, TLC and SLCs with mortality in dialysis patients.
We designed this study to examine the relation- ships of the TLC and SLCs with clinical outcome and nutritional status in patients undergoing maintenance HD and PD. We enrolled 66 patients (50 HD patients and 16 PD patients) receiving sta- ble maintenance dialysis. We evaluated the base- line parameters of height; weight; TLC; SLCs ex- pressing CD3, CD4, CD8 and CD19; CBC; iron profile (iron, TIBC, ferritin); BUN; Cr; Na; K; total CO2; Ca; P; iPTH; protein; albumin; total choles- terol; HDL; LDL; uric acid and CRP and calculated Onodera’s prognostic nutritional index (OPNI) and the Geriatric Nutritional Risk Index (GNRI) at base line and three months. Logistic regression analysis was performed to predict malnutrition in dialysis patients, and revealed that patients aged 60 years or older, women, and those whose CD19 SLCs were lower than 100 had a higher risk of developing malnutrition. To analyze changes in TLC, SLCs expressing each marker (CD3, CD4, CD8 and CD19) and other nutritional markers, we performed general linear model (GLM)-repeated measures ANOVA, and CD19 SLCs were sig- nificantly higher in women and in patients with
a shorter duration of dialysis.
TLC and SLCs (especially CD19 count) may be significant nutritional markers in HD and PD patients. However, further prospective studies are warranted to assess the role of SLCs and immune functions, together with other well-known prog- nostic factors, in dialysis patients.
Declaration of Interest : This study was sup- ported by a grant from Fresenius Medical Care Korea Co., Ltd. (2013).
REFFRENCES
1. Yamada K, Furuya R, Takita T, Maruyama Y, Yamaguchi Y, Ohkawa S, et al. Simplified nutri- tional screening tools for patients on main- tenance hemodialysis. Am J Clin Nutr 2008;87:106-13.
2. Panichi V, Cupisti A, Rosati A, Di Giorgio A, Scatena A, Menconi O, et al. Geriatric nutritional risk index is a strong predictor of mortality in hemodialysis patients: data from the Riscavid cohort. J Nephrol 2014;27:193-201.
3. Kang SH, Cho KH, Park JW, Yoon KW, Do JY.
Geriatric Nutritional Risk Index as a prognostic factor in peritoneal dialysis patients. Perit Dial Int 2013;33:405-10.
4. Onodera T, Goseki N, Kosaki G. [Prognostic nutri- tional index in gastrointestinal surgery of mal- nourished cancer patients]. Nihon Geka Gakkai
Zasshi 1984;85:1001-5.
5. Kang SH, Cho KH, Park JW, Yoon KW, Do JY.
Onodera's prognostic nutritional index as a risk factor for mortality in peritoneal dialysis patients.
J Korean Med Sci 2012;27:1354-8.
6. Kato S, Chmielewski M, Honda H, Pecoits-Filho R, Matsuo S, Yuzawa Y, et al. Aspects of immune dysfunction in end-stage renal disease. Clin J Am Soc Nephrol 2008;3:1526-33.
7. Grzegorzewska AE, Leander M. Total lymphocyte count and subpopulation lymphocyte counts in relation to dietary intake and nutritional status of peritoneal dialysis patients. Adv Perit Dial 2005;21:35-40.
8. Ates K, Ates A, Kutlay S, Nergizoglu G, Karatan O. Total lymphocyte count in peripheral blood of peritoneal dialysis patients: relationship to clinical parameters and outcome. J Nephrol 2004;17:246-52.
9. Examination Committee of Criteria for 'Obesity Disease' in Japan; Japan Society for the Study of Obesity. New criteria for 'obesity disease' in Japan. Circ J 2002;66:987-92.
10. Risch L, Saely CH, Neyer U, Hoefle G, Gouya G, Zerlauth M, et al. Prevalence of decreased glo- merular filtration rate in patients seeking
non-nephrological medical care--an evaluation using IDMS-traceable creatinine based MDRD as well as Mayo Clinic quadratic equation estimates.
Clin Chim Acta 2007;378:71-7.
11. Beberashvili I, Azar A, Sinuani I, Kadoshi H, Shapiro G, Feldman L, et al. Comparison analysis of nutritional scores for serial monitoring of nutri- tional status in hemodialysis patients. Clin J Am Soc Nephrol 2013;8:443-51.
12. Park JH, Kim SB, Shin HS, Jung YS, Rim H. Geriatric nutritional risk index may be a significant pre- dictor of mortality in Korean hemodialysis pa- tients: a single center study. Ther Apher Dial 2012;16:121-6.
13. Saad K, Elsayh KI, Zahran AM, Sobhy KM.
Lymphocyte populations and apoptosis of pe- ripheral blood B and T lymphocytes in children with end stage renal disease. Ren Fail 2014;36:
502-7.
14. Schaible UE, Kaufmann SH. Malnutrition and in- fection: complex mechanisms and global impacts. PLoS Med 2007;4:e115.
15. Jung YS, You G, Shin HS, Rim H. Relationship between Geriatric Nutritional Risk Index and total lymphocyte count and mortality of hemodialysis patients. Hemodial Int 2014;18:104-12.