Introduction
Obesity and overweight are major determinants of left ven- tricular (LV) diastolic function.1) Several mechanisms may con- tribute to the pathogenesis of LV dysfunction in obese patients.
In the obese, cardiac preload and afterload are increased, lead- ing to elevated levels of peripheral resistance.2)3) Increased pro- inflammatory cytokines originating from adipose tissue are suggested to be especially important contributors.4) Further- more, recent experimental investigations have found that lipo- toxicity in the heart results in cardiac steatosis and lipoapopto- sis.5)6) In obesity, diastolic function is correlated with fat mass, serum leptin levels, waist-to-hip ratio, LV mass, and LV end-di-
ORIGINAL ARTICLE J Cardiovasc Ultrasound 2017;25(1):5-11
• Received: August 28, 2015 • Revised: February 6, 2017 • Accepted: February 21, 2017
• Address for Correspondence: Jeong-Sook Seo, Division of Cardiology, Department of Internal Medicine, Busan Paik Hospital, Inje University, 75 Bokji-ro, Busanjin-gu, Busan 47392, Korea Tel: +82-51-890-6980, Fax: +82-51-898-4075, E-mail: [email protected]
• This is an Open Access article distributed under the terms of the Creative Commons Attribution Non-Commercial License (http://creativecommons.org/licenses/by-nc/4.0) which permits unrestricted non-commercial use, distribution, and reproduction in any medium, provided the original work is properly cited.
astolic volume.7) Increased body mass index (BMI) has also been associated with worse LV diastolic function.1)
However, it is uncertain whether similar relationships exist in Asian populations, because Asians generally have a lower BMI and a higher percentage of body fat at a given BMI com- pared to individuals from Western countries. Furthermore, Asians have a higher risk of cardiovascular events than individuals in Western populations at a similar BMI. Thus, the World Health Organization (WHO) expert consultation has proposed a new definition for obesity with a focus on the Asia-Pacific region.8) In Asians, the cut-off values for overweight (≥ 23.0 kg/m2) and obesity (≥ 27.5 kg/m2) are lower than those of the standard
The Relationships between Body Mass Index and Left Ventricular Diastolic Function in a Structurally Normal Heart with Normal Ejection Fraction
Jeong-Sook Seo, MD, PhD, Han-Young Jin, MD, Jae-Sik Jang, MD, PhD,
Tae-Hyun Yang, MD, PhD, Dae-Kyeong Kim, MD, PhD, and Dong-Soo Kim, MD, PhD
Division of Cardiology, Department of Internal Medicine, Busan Paik Hospital, Inje University, Busan, Korea
Background: We conducted research to determine the effect of the weight on left ventricular (LV) diastolic function in Asians, who are at greater risk of cardiovascular events compared to individuals from Western countries with similar body mass indices (BMIs).
Methods: We studied 543 participants with structurally normal hearts and normal ejection fractions. Participants were classi- fied as normal-weight (BMI < 23.0 kg/m2), overweight (BMI 23.0–27.4 kg/m2), or obese (BMI ≥ 27.5 kg/m2). Peak E velocity, peak A velocity, and E’ velocity were measured and E/E’ was calculated.
Results: Overweight participants had lower E than normal-weight participants (p = 0.001). E’ velocities in overweight and obese participants were less than those in normal weight participants (both p < 0.001). The E/E’ ratio in obese participants was higher compared to the value in normal-weight participants (p < 0.001) and overweight participants (p = 0.025). BMI was asso- ciated with E (R = -0.108), A (R = 0.123), E’ (R = -0.229), and E/E’ ratio (R = 0.138) (all p < 0.05). In multivariate analyses, BMI was independently associated with higher A, lower E’, and higher E/E’. The risk of diastolic dysfunction was significantly higher among overweight [adjusted odds ratio: 2.088; 95% confidence interval (CI): 1.348–3.235; p = 0.001] and obese partici- pants (adjusted odds ratio: 5.910; 95% CI: 2.871–12.162; p < 0.001) compared to normal-weight participants.
Conclusion: Obesity and overweight independently predicted diastolic dysfunction. An optimal body weight lower than the universal cut-off is reasonable for preventing LV heart failure in Asians.
KEY WORDS: Body weight · Obese · Diastole · Body mass index · Asian.
WHO criteria. The purpose of this study was to identify the ef- fect of weight on the diastolic function of LV in Asians accord- ing to BMI criteria for Asian populations.
Methods
Study population
We enrolled 543 participants who visited the health promo- tion center of a tertiary hospital in Busan, South Korea, for health screening from March to December 2012 and performed trans- thoracic echocardiography. All patients had a medical record filled, including height, weight, heart rate, and blood pres- sure. We excluded participants with significant valvular heart disease, confirmed regional wall motion abnormalities, de- creased LV ejection fraction (< 50%), atrial fibrillation, or con- genital heart disease. Demographic data were obtained through a detailed medical history and physical examination. Hyper- tension was defined as systolic blood pressure of 140 mm Hg or higher, diastolic blood pressure of 90 mm Hg or higher or past history of hypertension. When there is more than 126 mg/
dL of fasting plasma glucose or past history of diabetes mellitus, it was defined as diabetes mellitus. Dyslipidemia was defined as having total serum cholesterol level of 240 mg/dL or higher or past history of dyslipidemia. BMI was calculated as weight
(kg) divided by height-squared (m2). The study participants were divided into three weight groups according to the criteria suggested by the WHO expert consultation: normal weight (BMI < 23.0 kg/m2), overweight (BMI 23.0–27.4 kg/m2), and obese (BMI ≥ 27.5 kg/m2).8) The study conformed to the prin- ciples of the Declaration of Helsinki and was approved by our Institutional Review Board. The need to obtain written in- formed consent was waived by the Institutional Review Board.
Echocardiographic analysis
Transthoracic echocardiography was performed using com- mercially available systems (iE33, Philips, Andover, MA, USA;
Vivid 7, GE, Horten, Norway) by trained sonographers. LV di- ameter was measured in the parasternal short-axis view as rec- ommended by the American Society of Echocardiography.9) The LV mass was calculated using simple geometric cube for- mula10) and indexed by both for body surface area (BSA) and height. The LV ejection fraction was calculated by the biplane modified Simpson’s method.
LV diastolic function was evaluated using mitral inflow veloc- ity and mitral annular velocity. Peak E and A velocity of the mitral inflow were measured from an apical 4 chamber view, and then E/A ratio was calculated. The mean value of E’ veloci- ties measured by tissue Doppler imaging from septal and lat-
Table 1. Clinical characteristics of populations
Normal weight (BMI < 23 kg/m2) (n = 208)
Overweight (BMI 23–27.4 kg/m2) (n = 271)
Obese (BMI ≥ 27.5 kg/m2) (n = 64)
Age, years 049.7 ± 9.8 052.0 ± 8.9* 047.5 ± 8.9†
Female, n (%) 104 (50.0) 068 (25.1)* 017 (26.6)*
BMI, kg/m2 021.0 ± 1.5 024.9 ± 1.2* 029.4 ± 1.6*†
Systolic BP, mm Hg 119.5 ± 17.2 125.9 ± 16.3* 132.6 ± 19.2*†
Diastolic BP, mm Hg 070.8 ± 11.2 075.4 ± 10.9* 079.6 ± 13.1*†
Heart rate, /min 069.0 ± 12.4 066.5 ± 12.4 070.0 ± 10.8
Hypertension, n (%) 023 (11.1) 076 (28.1)* 022 (34.4)*
Diabetes mellitus, n (%) 014 (6.7) 018 (6.6) 004 (6.3)
Dyslipidemia, n (%) 028 (13.5) 053 (19.6) 018 (28.1)*
*p < 0.05 versus normal weight, †p < 0.05 versus overweight. BMI: body mass index, BP: blood pressure
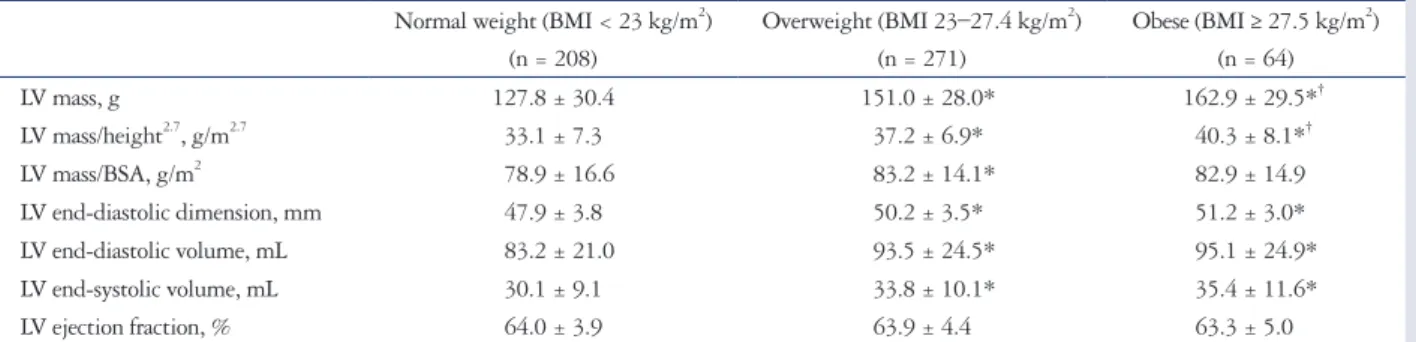
Table 2. LV geometry and systolic function assessed by echocardiography Normal weight (BMI < 23 kg/m2)
(n = 208)
Overweight (BMI 23–27.4 kg/m2) (n = 271)
Obese (BMI ≥ 27.5 kg/m2) (n = 64)
LV mass, g 127.8 ± 30.4 151.0 ± 28.0* 162.9 ± 29.5*†
LV mass/height2.7, g/m2.7 033.1 ± 7.3 037.2 ± 6.9* 040.3 ± 8.1*†
LV mass/BSA, g/m2 078.9 ± 16.6 083.2 ± 14.1* 082.9 ± 14.9
LV end-diastolic dimension, mm 047.9 ± 3.8 050.2 ± 3.5* 051.2 ± 3.0*
LV end-diastolic volume, mL 083.2 ± 21.0 093.5 ± 24.5* 095.1 ± 24.9*
LV end-systolic volume, mL 030.1 ± 9.1 033.8 ± 10.1* 035.4 ± 11.6*
LV ejection fraction, % 064.0 ± 3.9 063.9 ± 4.4 063.3 ± 5.0
*p < 0.05 versus normal weight, †p < 0.05 versus overweight. BMI: body mass index, LV: left ventricle, BSA: body surface area
eral annulus was calculated and E/E’ ratio was used as an indica- tor of LV filling pressure. Definition of diastolic dysfunction was as follows:
• E/A < 0.8: impaired relaxation (grade I)
• 0.8 ≤ E/A ≤ 1.5, E’ < 8 cm/s, and 9 ≤ mean E/E’ ≤ 12: pseu- do-normalized pattern (grade II)
• E/A > 2, E’ < 8 cm/s, and mean E/E’ ≥ 13: restrictive pattern (grade III)
Elevated LV filling pressure was defined as when E/E’ ratio exceeded 15.11)
Statistical analysis
Continuous variables and categorical variables were expressed as mean ± SD and proportions, respectively. One-way analysis and Bonferroni correction were used to assess differences be- tween groups and analyze post hoc multiple comparisons. Fisher’s exact test was used to assess the difference of categorical vari- ables. Independent association between BMI and parameters of diastolic function was evaluated with multiple linear regres- sion. We used multiple logistic model to assess the risk of the LV diastolic dysfunction related to the indicator of body size. SPSS software version 17.0 (SPSS Inc., Chicago, IL, USA) was used and two tailed p < 0.05 was considered as statistically significant.
Results
Study population and LV mass
The normal weight, overweight, and obese groups consisted of 208, 271, and 64 participants, respectively. The clinical characteristics and echocardiographic features of the three groups are shown in Tables 1 and 2. Overweight participants were older than normal weight and obese participants. The proportion of women was lower and the proportion of hyper- tension was higher in the overweight and obese groups. The proportion of patients with dyslipidemia was higher in the obese group than in the normal weight group and overweight group. Obese and overweight participants had higher height- indexed LV mass and BSA-indexed LV mass.
Age and higher BMI were moderately associated with high- er height-indexed LV mass (R = 0.355, p < 0.001 and R = 0.371, p < 0.001, respectively). The multivariate analysis indicated that a higher BMI may independently predict increased height- indexed LV mass (β = 0.375, p < 0.001). Age (β = 0.343, p <
0.001) and heart rate (β = -0.180, p < 0.001) were also inde- pendent predictors. Hypertension and diabetes were not pre- dictors of increased LV mass in multivariate analysis. Similar re- lationship were shown between BMI and BSA-indexed LV mass (β = 0.151, p < 0.001).
BMI and diastolic function parameters
Higher BMI was associated with higher peak A wave velocity (R = 0.123; p = 0.004), higher E/E’ ratio (R = 0.138; p = 0.001), lower peak E wave velocity (R = -0.108; p = 0.012), and lower Table 3.
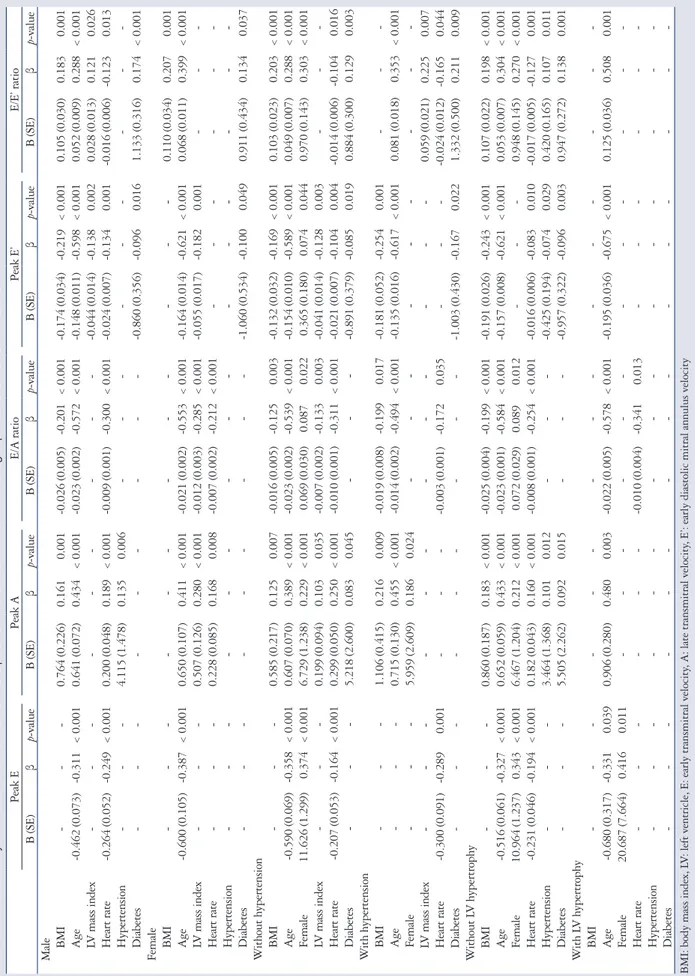
Multivariate analysis for correlation of BMI and other clinical variables with parameters of LV diastolic function Peak EPeak AE/A ratioPeak E’E/E’ ratio B (SE)βp-valueB (SE)βp-valueB (SE)βp-valueB (SE)βp-valueB (SE)βp-value BMI---0.846 (0.180)0.178< 0.001-0.019 (0.005)-0.151< 0.001-0.145 (0.027)-0.184< 0.0010.089 (0.024)0.160< 0.001 Age-0.528 (0.060)-0.330< 0.0010.688 (0.058)0.446< 0.001-0.022 (0.001)-0.551< 0.001-0.153 (0.008)-0.598< 0.0010.050 (0.007)0.280< 0.001 Female10.898 (1.175)0.347< 0.0016.918 (1.128)0.228< 0.0010.069 (0.026)0.0890.0080.350 (0.157)0.0700.0260.964 (0.136)0.272< 0.001 LV mass index-------0.006 (0.002)-0.1180.003-0.043 (0.011)-0.136< 0.0010.022 (0.010)0.0990.027 Heart rate-0.232 (0.046)-0.191< 0.0010.187 (0.042)0.159< 0.001-0.008 (0.001)-0.275< 0.001-0.020 (0.006)-0.1010.001-0.015 (0.005)-0.1100.004 Hypertension---3.531 (1.331)0.1020.008------0.363 (0.160)0.0870.028 Diabetes----------0.927 (0.293)-0.0970.0020.971 (0.253)0.173< 0.001 BMI: body mass index, LV: left ventricle, E: early transmitral velocity, A: late transmitral velocity, E’: early diastolic mitral annulus velocity
Table 4. Multivariate analysis for association between BMI and parameters of LV diastolic function in subgroups with and without risk factors Peak EPeak AE/A ratioPeak E’E/E’ ratio B (SE)βp-valueB (SE)βp-valueB (SE)βp-valueB (SE)βp-valueB (SE)β p-value Male BMI---0.764 (0.226)0.161< 0.001-0.026 (0.005)-0.201< 0.001-0.174 (0.034)-0.219< 0.0010.105 (0.030)0.183< 0.001 Age-0.462 (0.073)-0.311< 0.0010.641 (0.072)0.434< 0.001-0.023 (0.002)-0.572< 0.001-0.148 (0.011)-0.598< 0.0010.052 (0.009)0.288< 0.001 LV mass index----------0.044 (0.014)-0.138< 0.0020.028 (0.013)0.121< 0.026 Heart rate-0.264 (0.052)-0.249< 0.0010.200 (0.048)0.189< 0.001-0.009 (0.001)-0.300< 0.001-0.024 (0.007)-0.134< 0.001-0.016 (0.006)-0.123< 0.013 Hypertension---4.115 (1.478)0.135< 0.006--------- Diabetes----------0.860 (0.356)-0.096< 0.0161.133 (0.316)0.174< 0.001 Female BMI------------0.110 (0.034)0.207< 0.001 Age-0.600 (0.105)-0.387< 0.0010.650 (0.107)0.411< 0.001-0.021 (0.002)-0.553< 0.001-0.164 (0.014)-0.621< 0.0010.068 (0.011)0.399< 0.001 LV mass index---0.507 (0.126)0.280< 0.001-0.012 (0.003)-0.285< 0.001-0.055 (0.017)-0.182< 0.001--- Heart rate---0.228 (0.085)0.168< 0.008-0.007 (0.002)-0.212< 0.001------ Hypertension--------------- Diabetes----------1.060 (0.534)-0.100< 0.0490.911 (0.434)0.134< 0.037 Without hypertension BMI---0.585 (0.217)0.125< 0.007-0.016 (0.005)-0.125< 0.003-0.132 (0.032)-0.169< 0.0010.103 (0.023)0.203< 0.001 Age-0.590 (0.069)-0.358< 0.0010.607 (0.070)0.389< 0.001-0.023 (0.002)-0.539< 0.001-0.154 (0.010)-0.589< 0.0010.049 (0.007)0.288< 0.001 Female11.626 (1.299)-0.374< 0.0016.729 (1.238)0.229< 0.001-0.069 (0.030)0.087< 0.022-0.365 (0.180)-0.074< 0.0440.970 (0.143)0.303< 0.001 LV mass index---0.199 (0.094)0.103< 0.035-0.007 (0.002)-0.133< 0.003-0.041 (0.014)-0.128< 0.003--- Heart rate-0.207 (0.053)-0.164< 0.0010.299 (0.050)0.250< 0.001-0.010 (0.001)-0.311< 0.001-0.021 (0.007)-0.104< 0.004-0.014 (0.006)-0.104< 0.016 Diabetes---5.218 (2.600)0.083< 0.045----0.891 (0.379)-0.085< 0.0190.884 (0.300)0.129< 0.003 With hypertension BMI---1.106 (0.415)0.216< 0.009-0.019 (0.008)-0.199< 0.017-0.181 (0.052)-0.254< 0.001--- Age---0.715 (0.130)0.455< 0.001-0.014 (0.002)-0.494< 0.001-0.135 (0.016)-0.617< 0.0010.081 (0.018)0.353< 0.001 Female---5.959 (2.609)0.186< 0.024--------- LV mass index------------0.059 (0.021)0.225< 0.007 Heart rate-0.300 (0.091)-0.289< 0.001----0.003 (0.001)-0.172< 0.035----0.024 (0.012)-0.165< 0.044 Diabetes----------1.003 (0.430)-0.167< 0.0221.332 (0.500)0.211< 0.009 Without LV hypertrophy BMI---0.860 (0.187)0.183< 0.001-0.025 (0.004)-0.199< 0.001-0.191 (0.026)-0.243< 0.0010.107 (0.022)0.198< 0.001 Age-0.516 (0.061)-0.327< 0.0010.652 (0.059)0.433< 0.001-0.023 (0.001)-0.584< 0.001-0.157 (0.008)-0.621< 0.0010.053 (0.007)0.304< 0.001 Female10.964 (1.237)-0.343< 0.0016.467 (1.204)0.212< 0.001-0.072 (0.029)0.089< 0.012---0.948 (0.145)0.270< 0.001 Heart rate-0.231 (0.046)-0.194< 0.0010.182 (0.043)0.160< 0.001-0.008 (0.001)-0.254< 0.001-0.016 (0.006)-0.083< 0.010-0.017 (0.005)-0.127< 0.001 Hypertension---3.464 (1.368)0.101< 0.012----0.425 (0.194)-0.074< 0.0290.420 (0.165)0.107< 0.011 Diabetes---5.505 (2.262)0.092< 0.015----0.957 (0.322)-0.096< 0.0030.947 (0.272)0.138< 0.001 With LV hypertrophy BMI--------------- Age-0.680 (0.317)-0.331< 0.0390.906 (0.280)0.480< 0.003-0.022 (0.005)-0.578< 0.001-0.195 (0.036)-0.675< 0.0010.125 (0.036)0.508< 0.001 Female20.687 (7.664)-0.416< 0.011------------ Heart rate-------0.010 (0.004)-0.341< 0.013------ Hypertension--------------- Diabetes--------------- BMI: body mass index, LV: left ventricle, E: early transmitral velocity, A: late transmitral velocity, E’: early diastolic mitral annulus velocity
E’ velocity (R = -0.229; p < 0.001).
Table 3 shows the correlations of BMI and other clinical vari- ables with parameters of LV diastolic function in multivariate analysis. BMI had positive association with peak A velocity (R2
= 0.032; p < 0.001) and E/E’ ratio (R2 = 0.026; p < 0.001). In contrast, BMI was negatively associated with E/A ratio (R2 = 0.023; p < 0.001) and E’ velocity (R2 = 0.034; p < 0.001). BMI was not correlated with E wave velocity after multivariate analysis.
Age, gender, and heart rate were independently associated with all LV diastolic parameters (E, A, E/A ratio, E’ and E/E’
ratio). There were significant correlations between higher LV mass index and lower E/A ratio, lower E’ velocity, and higher E/E’ ratio. After dividing the study group according to gender, the results were similar for just men and the entire population (Table 4). However, in women, BMI was associated with E/E’
ratio only.
In subgroup analysis of participants without hypertension (n = 422), BMI was still associated with peak A, E/A ratio, E’ veloc- ity, and E/E’ ratio (Table 4). However, the correlation between BMI and E/E’ ratio was not significant in this subgroup. In the subgroup with LV hypertrophy, BMI was not correlated with any parameters of LV diastolic function. There were significant corrections between BMI and the parameters of LV diastolic
function in the non-LV hypertrophy subgroup (Table 4).
LV diastolic function in abnormal body weight E velocity was significantly lower in overweight participants than in normal-weight participants (p = 0.001). Peak A veloc- ity was not different between the three groups. The E/A ratio was significantly lower in the overweight and obese groups com- pared to the normal-weight group (p < 0.001 and p = 0.026, re- spectively). E’ wave was significantly lower in the overweight and obese groups than in the normal-weight group (both p <
0.001). The E/E’ ratio was significantly higher in obese partic- ipants only compared with normal-weight participants (p = 0.001) (Table 5).
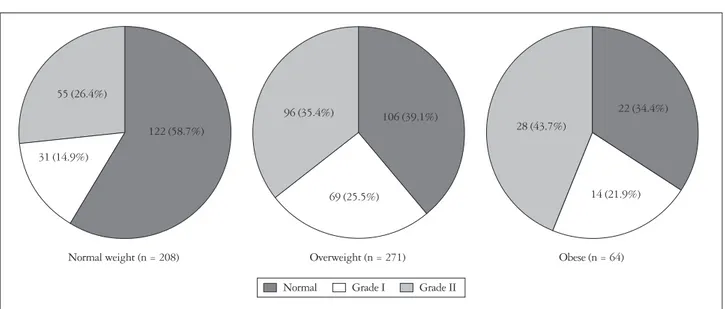
Among all participants, the prevalence of LV diastolic dys- function was 54% (n = 293). Diastolic dysfunction was more common in the overweight (60.9%) and obese (65.6%) groups than in the normal-weight group (41.3%) (p < 0.001). The prevalence of pseudo-normalized diastolic pattern was 26.4, 35.4, and 43.7% in normal weight, overweight and obese, re- spectively (p = 0.017) (Fig. 1).
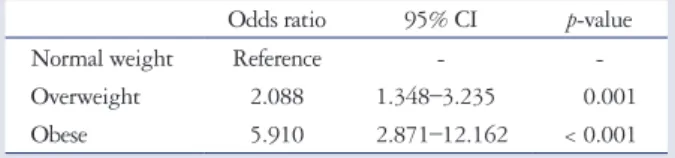
Risk of LV diastolic dysfunction was assessed using a multi- variate logistic model (Table 6). Overweight [odds ratio (OR):
2.088; 95% confidence interval (CI): 1.348–3.235; p = 0.001]
Table 5. Comparisons of diastolic parameters between three groups Normal weight (BMI < 23 kg/m2)
(n = 208)
Overweight (BMI 23–27.4 kg/m2) (n = 271)
Obese (BMI ≥ 27.5 kg/m2) (n = 64)
Peak E, cm/s 66.1 ± 15.0 61.0 ± 14.5* 64.1 ± 15.1
Peak A, cm/s 59.8 ± 14.7 62.1 ± 14.4 63.7 ± 13.8
E/A ratio 01.2 ± 0.4 01.0 ± 0.3* 01.0 ± 0.3*
Peak E’, cm/s 10.3 ± 2.4 09.2 ± 2.2* 08.8 ± 2.2*
E/E’ ratio 06.6 ± 1.5 06.9 ± 1.8 07.5 ± 1.9*†
*p < 0.05 versus normal weight, †p < 0.05 versus overweight. BMI: body mass index, E: early transmitral velocity, A: late transmitral velocity, E’: early diastolic mitral annulus velocity
Fig. 1. Proportion of diastolic dysfunction in each weight group.
Normal weight (n = 208) Overweight (n = 271) Obese (n = 64)
122 (58.7%)
106 (39.1%)
69 (25.5%)
96 (35.4%) 22 (34.4%)
28 (43.7%)
14 (21.9%) 55 (26.4%)
31 (14.9%)
Normal Grade I Grade II
and obese (OR: 5.910; 95% CI: 2.871–12.162; p < 0.001) were independent risk factor of diastolic dysfunction. Numeri- cal BMI was also an independent risk factor of diastolic dysfunc- tion (adjusted: 1.163; 95% CI: 1.077–1.257; p < 0.001).
Discussion
We analyzed the relationships between LV diastolic function and overweight and obesity as classified by the WHO expert consultation definition for Asians. Our data suggest that BMI has independent correlation with parameters of LV diastolic function and overweight and obese status according to the WHO expert consultation criteria are independent risk factors for LV diastolic dysfunction in Asians. In our study population, the overweight and obese groups had more impaired diastolic func- tion compared with the normal-weight group, and both of these weight groups were independent predictors of LV diastolic dysfunction. It is notable that there was no significant difference in diastolic parameters between obese and overweight partici- pants. Although gender, hypertension, diabetes, and LV hy- pertrophy also negatively affect LV diastolic function, the rela- tionship between BMI and LV diastolic function maintained after adjusting for these variables. In subgroup analysis of male participants, participants without LV hypertrophy, and partic- ipants without hypertension, a significantly negative associa- tion between BMI and LV diastolic function was also detected.
We found no such significant relationships in women or par- ticipants with LV hypertrophy. However, the numbers of wom- en and participants with LV hypertrophy included in the study were small, so the results of the subgroup analysis of these par- ticipants should be considered with caution.
Many studies have demonstrated that overweight and obe- sity are important risk factors for the development of heart failure.1)12-14) Most studies use the most popular WHO BMI criteria of ≥ 25 kg/m2 for overweight and ≥ 30 kg/m2 for obe- sity,15) which were both calculated based on Western popula- tions. However, Asian populations have a lower mean BMI than Western populations, in addition to a higher percentage of body fat and a greater risk for cardiovascular disease at a given BMI.16)17) Many experts agree that population-specific cut-off points for BMI are necessary. The WHO expert consultation group observed that the risk of obesity-related diseases among Asians increases from a BMI of 23 kg/m2, and suggested ap- propriate cut-off values for overweight (≥ 23 kg/m2) and obe- sity (≥ 27.5 kg/m2) in Asians that are lower than the standard
WHO criteria.8) Although these criteria in Asian populations need further validation, we observed that Asians had impaired diastolic function with a BMI ≥ 23 kg/m2. There are several BMI criteria for Asians, but the consensus is that the definition of over- weight is a BMI ≥ 23 kg/m2. The definition of obesity varies, but all criteria for Asians are lower than the universal WHO criteria.8)18) As mentioned above, Asians have a higher preva- lence of heart failure and cardiovascular disease at a particular BMI than Westerners, and the present results suggest one mechanism to explain this important difference.
Early diastolic annular velocity is essential for the assessment of diastolic function. E’ is not affected by loading state or by physiologic changes like respiration.19) We adopted the values for diastolic dysfunction recommended by the American Soci- ety of Echocardiography11) and by accounting for the age of the studied population. Diastolic dysfunction was considered when septal E’ was < 8 cm/s.
Previous studies reported that BMI is correlated with impair- ment of LV diastolic function,1)12) which is in agreement with our findings. In the same Asia-Pacific region (Japan), Dote et al.20) showed that overweight was not an independent risk fac- tor for LV diastolic dysfunction. However, they used the uni- versal WHO criteria for overweight and a different definition of diastolic function. They emphasized the use of the decelera- tion time of early mitral flow and parameters of LV filling pres- sure. They also overlooked the pattern of annular velocity of the mitral valve and limited the role of E’ as the parameter of LV filling pressure. We hypothesize that the discrepancies be- tween our results and those of previous studies may be related to the intrinsic differences in racial characteristics, the defini- tions of overweight and obesity, and the differences in the defi- nitions of LV diastolic function used.
Our study had several limitations. First, obesity was deter- mined using only BMI, and no measurements of body fat dis- tribution were performed. A stronger correlation might have been found between abdominal obesity and echocardiographic alterations. Second, this study demonstrated impairment of LV diastolic function echocardiographically, without investi- gating long-term outcomes such as heart failure or major ad- verse cardiac events. Further studies addressing these issues are needed. Third, this study was monocentric, the studied popu- lation size was limited, and only Korean participants were in- cluded. Therefore, our results may not be generalizable to oth- er ethnic groups in other Asian regions.
In conclusion, the results of the present study revealed that LV diastolic dysfunction is present in overweight subjects, and that lower BMI categories are appropriate for evaluating rela- tionships among overweight, obese, and LV diastolic dysfunc- tion in Asian populations. On this basis, lower BMI cut-off points to define overweight and obesity are warranted for daily practice and clinical trials in Asian populations. If we expand our goal to the promotion of policies for reducing the burdens of increasing obesity in Asia, a lower cut-off point may be useful for
Table 6. Risk of diastolic dysfunction associated with overweight and obesity (multivariate analysis)
Odds ratio 95% CI p-value
Normal weight Reference - -
Overweight 2.088 1.348–3.235 0.001
Obese 5.910 2.871–12.162 < 0.001
CI: confidence interval
stimulating changes in prevention and intervention strategies.
• Acknowledgements
This work was supported by a 2011 Inje University research grant.
References
1. Russo C, Jin Z, Homma S, Rundek T, Elkind MS, Sacco RL, Di Tul- lio MR. Effect of obesity and overweight on left ventricular diastolic func- tion: a community-based study in an elderly cohort. J Am Coll Cardiol 2011;
57:1368-74.
2. Alpert MA. Obesity cardiomyopathy: pathophysiology and evolution of the clinical syndrome. Am J Med Sci 2001;321:225-36.
3. Kasper EK, Hruban RH, Baughman KL. Cardiomyopathy of obesity: a clinicopathologic evaluation of 43 obese patients with heart failure. Am J Car- diol 1992;70:921-4.
4. Lyon CJ, Law RE, Hsueh WA. Minireview: adiposity, inflammation, and atherogenesis. Endocrinology 2003;144:2195-200.
5. Zhou YT, Grayburn P, Karim A, Shimabukuro M, Higa M, Baetens D, Orci L, Unger RH. Lipotoxic heart disease in obese rats: implications for human obesity. Proc Natl Acad Sci U S A 2000;97:1784-9.
6. Chiu HC, Kovacs A, Ford DA, Hsu FF, Garcia R, Herrero P, Saffitz JE, Schaffer JE. A novel mouse model of lipotoxic cardiomyopathy. J Clin Invest 2001;107:813-22.
7. Rider OJ, Francis JM, Ali MK, Holloway C, Pegg T, Robson MD, Tyler D, Byrne J, Clarke K, Neubauer S. Effects of catecholamine stress on diastolic function and myocardial energetics in obesity. Circulation 2012;
125:1511-9.
8. WHO Expert Consultation. Appropriate body-mass index for Asian pop- ulations and its implications for policy and intervention strategies. Lancet 2004;363:157-63.
9. Lang RM, Bierig M, Devereux RB, Flachskampf FA, Foster E, Pel- likka PA, Picard MH, Roman MJ, Seward J, Shanewise JS, Solomon SD, Spencer KT, Sutton MS, Stewart WJ; Chamber Quantification Writing Group; American Society of Echocardiography’s Guide- lines and Standards Committee; European Association of Echocar- diography. Recommendations for chamber quantification: a report from the American Society of Echocardiography’s Guidelines and Standards Commit- tee and the Chamber Quantification Writing Group, developed in conjunc-
tion with the European Association of Echocardiography, a branch of the Eu- ropean Society of Cardiology. J Am Soc Echocardiogr 2005;18:1440-63.
10. Devereux RB, Alonso DR, Lutas EM, Gottlieb GJ, Campo E, Sachs I, Reichek N. Echocardiographic assessment of left ventricular hypertrophy:
comparison to necropsy findings. Am J Cardiol 1986;57:450-8.
11. Nagueh SF, Appleton CP, Gillebert TC, Marino PN, Oh JK, Smiseth OA, Waggoner AD, Flachskampf FA, Pellikka PA, Evangelista A.
Recommendations for the evaluation of left ventricular diastolic function by echocardiography. J Am Soc Echocardiogr 2009;22:107-33.
12. Bae HK, Choi HS, Sohn S, Shin HJ, Nam JH, Hong YM. Cardiovas- cular screening in asymptomatic adolescents with metabolic syndrome. J Car- diovasc Ultrasound 2015;23:10-9.
13. Loehr LR, Rosamond WD, Poole C, McNeill AM, Chang PP, Folsom AR, Chambless LE, Heiss G. Association of multiple anthropometrics of overweight and obesity with incident heart failure: the Atherosclerosis Risk in Communities study. Circ Heart Fail 2009;2:18-24.
14. Ávila-Vanzzini N, Machain Leyva CZ, Rodríguez Castellanos LE, Arias Godínez JA, Ruiz Esparza ME, Herrera Bello H. Excessive weight and obesity are associated to intra-ventricular asynchrony: pilot study. J Cardiovasc Ultrasound 2015;23:86-90.
15. Kossaify A, Nicolas N. Impact of overweight and obesity on left ventricular diastolic function and value of tissue Doppler echocardiography. Clin Med Insights Cardiol 2013;7:43-50.
16. Deurenberg P, Deurenberg-Yap M, Guricci S. Asians are different from Caucasians and from each other in their body mass index/body fat per cent re- lationship. Obes Rev 2002;3:141-6.
17. Chang CJ, Wu CH, Chang CS, Yao WJ, Yang YC, Wu JS, Lu FH.
Low body mass index but high percent body fat in Taiwanese subjects: impli- cations of obesity cutoffs. Int J Obes Relat Metab Disord 2003;27:253-9.
18. Oh SW, Shin SA, Yun YH, Yoo T, Huh BY. Cut-off point of BMI and obesity-related comorbidities and mortality in middle-aged Koreans. Obes Res 2004;12:2031-40.
19. Nagueh SF, Middleton KJ, Kopelen HA, Zoghbi WA, Quiñones MA. Doppler tissue imaging: a noninvasive technique for evaluation of left ventricular relaxation and estimation of filling pressures. J Am Coll Cardiol 1997;30:1527-33.
20. Dote K, Miyasaka Y, Tsujimoto S, Motohiro M, Maeba H, Suwa Y, Iwasaka T. Obesity as an independent risk for left ventricular diastolic dys- function in 692 Japanese patients. Obes Res Clin Pract 2012;6:e175-262.