ABSTRACT
Background: Although many epidemiological studies have reported the inverse associations between greenness and health outcomes, inconsistent associations in allergic diseases remain an issue. We aimed to identify associations between greenness and allergic diseases among Korean adults.
Methods: In total, 219,298 adults from the 2009 Korea Community Health Survey were included in this study. Individuals' allergy-related conditions, such as atopic dermatitis and allergic rhinitis, were evaluated. To identify the amount of green areas (m2) per capita in each administrative region, we used the 2009 data for green areas from the Korean Statistical Information Service.
Results: The risk for atopic dermatitis in the highest quartile of green areas was significantly lower compared with that of the lowest quartile. Physician's diagnosis and current treatment of odds ratios (ORs) with 95% confidence intervals (CIs) were 0.82 (0.73–0.91) and 0.77 (0.64–0.92), respectively. Similarly, the association results for allergic rhinitis showed that the highest level of green areas was significantly associated with a decreased risk of allergic rhinitis in full-adjustment model quartiles. Physician's diagnosis and current treatment of OR (95% CI) were 0.94 (0.89–0.99) and 0.91 (0.82–1.00), respectively.
Conclusions: We observed inverse associations of green areas with atopic dermatitis and allergic rhinitis in Korean adults.
Keywords: Rhinitis, allergic; Dermatitis, atopic; Immune system; Parks, recreational;
Association; Adult
BACKGROUND
Exposure to green space has been closely linked to various health outcomes such as birth weight, mental health, allergic diseases, type 2 diabetes, and cardiovascular disease [1-5].
According to a recent report from the World Health Organization, exposure to greenness can benefit health either directly or indirectly through a variety of mechanisms and their synergies [6]. Greenness can improve mental and physical health by reducing psychological stress, depression, air pollution, and noise, along with increasing social contacts and physical activity.
Enhanced immune functioning is also one of the important pathways linking green spaces to health [7]. However, these advantages of nature are not shown in all health outcomes.
eISSN 2052-4374
Research Article
Received: Feb 21, 2019 Accepted: Aug 14, 2019
*Correspondence:
Kyoung-Bok Min
Department of Preventive Medicine, Colleague of Medicine, Seoul National University, 103 Daehak-ro, Jongno-gu, Seoul 03080, Korea.
E-mail: [email protected]
†These authors contributed equally to this work.
Copyright © 2020 Korean Society of Occupational & Environmental Medicine This is an Open Access article distributed under the terms of the Creative Commons Attribution Non-Commercial License (https://
creativecommons.org/licenses/by-nc/4.0/) which permits unrestricted non-commercial use, distribution, and reproduction in any medium, provided the original work is properly cited.
Abbreviations
BMI: body mass index; CI: confidence interval;
KOSIS: KOrean Statistical Information Service;
KCHS: Korea Community Health Survey; OR:
odds ratio.
Funding
This work was supported by Basic Science Research Program through the National Research Foundation of Korea (NRF) funded by the Ministry of Education, Science and Technology (grant number, Grant No. 2018R1D1A1A09083190 and 2019R1A2C1004966).
Competing interests
The authors declare that they have no competing interests.
Hyun-Jin Kim1†, Jin-young Min2†, Hye-Jin Kim3, and Kyoung-bok Min3*
1National Cancer Control Institute, National Cancer Center, Goyang, South Korea
2Institute of Health and Environment, Seoul National University, Seoul, Korea
3Department of Preventive Medicine, College of Medicine, Seoul National University, Seoul, Korea
Association between green areas and allergic disease in Korean adults:
a cross-sectional study
Authors contributions
Conceptualization: Kim HJ1, Min JY, Min KB;
Formal analysis: Kim HJ1, Min JY, Kim HJ2; Project administration: Min KB; Supervision:
Min KB; Writing - original draft: Kim HJ1, Min JY; Writing - review & editing: Min KB.
1Kim HJ, Hyun-Jin Kim; 2Kim HJ, Hye-Jin Kim
For example, the literature on the association of green space with allergic conditions is inconsistent. A number of studies have reported that exposure to greenness is inversely associated with allergic diseases in children and adolescents [8-12]. In contrast, other studies have observed positive associations between greenness and risk of allergy-related symptoms in children [2,13-15]. Some of this inconsistency in the study of children may be explained by 2 largely independent mechanisms, namely the biodiversity hypothesis and pollen from a variety of plants or trees. Early-life exposure to green space can improve the diversity and abundance of microbiota, thereby leading to enhanced immune function at an early age [9].
On the other hand, green vegetation can stimulate allergic reactions and increase the risk of developing allergic disease through fungal spores and many different types of pollens [15].
Consequently, the conflicting effects of greenness on allergies remain an issue.
To date, association studies of the role of greenness in allergy-related conditions have focused primarily on children or adolescents. However, as with children, the adult population has a high prevalence of allergic disease, with a prevalence rate of more than 20% for allergic rhinitis [16]. In the case of persistent allergic rhinitis and contact dermatitis, the prevalence in adults is even higher than in children [17]. Indirect health impacts via increased physical activity in green areas may be more important for children than adults. Nevertheless, there is little published evidence on the effects of greenness on allergic diseases in adults. In addition, few studies on greenness and allergic disease have been performed in Asian populations. Therefore, this study aimed to investigate the associations of greenness with allergic diseases in Korean adults.
METHODS
Subjects
The data used for this study were obtained from the 2009 Korea Community Health Survey (KCHS) (https://chs.cdc.go.kr/chs/index.do), which was conducted by the Korea Centers for Disease Control and Prevention [18]. Briefly, the KCHS, which is a nationwide community-based survey, was initiated in 2008 to evaluate health comprehensively at the community level and to provide evidence-based disease prevention programs and health promotion services. In total, 230,715 adults were interviewed in 2009. Of these, we excluded 11,417 samples that inaccurately responded to the allergy-related questions or questions for interest variables including age, sex, education, and physical activity. Therefore, a total of 219,298 adults were included in the study.
Allergy-related conditions
Individuals' allergy-related conditions were obtained through self-reporting of atopic dermatitis and allergic rhinitis, which were respectively assessed by 2 questions on physician diagnosis and current treatment: 1) Have you ever been diagnosed with atopic dermatitis or allergic rhinitis by a physician? 2) Are you currently being treated for atopic dermatitis or allergic rhinitis? Subjects responded as dichotomous variables (“yes” or “no”).
Assessment of green areas
The KCHS data did not include the actual addresses of the subjects, which would be required to estimate the level of individual exposure to green space. Therefore, we assessed the amount of green areas using an alternative approach wherein an identical level of exposure was assigned to individuals living in the same administrative area. We obtained the 2009 data from the KOrean Statistical Information Service (KOSIS), which contain information regarding the amount of green areas (m2) per capita in 200 administrative regions, including
cities and counties (KOSIS, 2009). The green areas reported by the KOSIS included forests, parks and reserves, greenness, greenways, and riparian areas. The geographical codes for the study participants were all matched on the basis of the amount of green areas in each administrative region. The size of administrative region ranged from 33 km2 to 1,819 km2, and its mean was 623.15 km2. The distribution is presented in Fig. 1.
Variables of interest
For the associations between green areas and allergic disease, we also investigated variables of interest, including basic characteristics. Several variables, such as age, sex, marital status, education, monthly income, job, cigarette smoking, alcohol drinking, stress, and moderate activity were assessed using a questionnaire. Job categories included: 1) white-collar jobs (e.g. general office workers or managers), 2) blue-collar jobs (e.g. mechanics, builders, factory employees, or construction, firefighting), 3) pink-collar jobs (e.g. healthcare, nursing, floristry, salespersons, teaching assistant, child care), 4) military jobs including professional soldiers, and 5) no economic act (e.g. students or unemployed individuals). In addition, Moderate physical activity was defined as moderate-intensity activities (i.e., leisure sports, including swimming, tennis, volleyball, badminton, and ping-pong, etc.) of more than 10 minutes at least a day per week. Body mass index (BMI) was estimated as weight in kilograms divided by the square of the height in meters (kg/m2). In addition, the residential regions of the subjects were divided into 2 categories: urban and rural. These variables of interest were considered as covariates for each model.
South Korea China
Japan
Q1 (≤ 14.90 m2 per capita)
Q4 (≥ 33.31 m2 per capita) Q2 (14.91–22.40 m2 per capita) Q3 (22.41–33.30 m2 per capita)
Fig. 1. Distribution of park and green areas (m2) per capita.
Statistical analysis
The KCHS accounted for the population-based and representative nature of the sample using individual weights. First, the household weights were calculated so that the participating households represented all the whole households, and the individual weights were estimated by reflecting the individual response rate in the household weights. Next, the individual weights were adjusted for sex and age, based on the resident population so that the sample represented the total population. Before analyses, we checked the normality of the distribution of green areas. As a result, the distribution did not follow normality. To alleviate the problem of the skewed distribution of green areas, we converted values of green areas with a log2 transformation. Although the resulting distribution was closer to a normal distribution than the distribution of the raw values of green areas, it still did not completely follow a normal distribution. Therefore, we additionally performed quartiles analysis by dividing the distribution of green areas into 4 levels: quartile 1 (≤ 14.90 m2/capita), quartile 2 (14.91–22.40 m2/capita), quartile 3 (22.41–33.30 m2/capita), and quartile 4 (≥ 33.31 m2/capita).
The associations between green areas and allergic disease were evaluated using logistic regression analysis, and we estimated odds ratios (ORs) and 95% confidence intervals (95%
CIs) in green areas for atopic dermatitis or allergic rhinitis. In quartiles analysis, quartile 1 of green areas (the lowest level) was used as the reference level. In total, 5 statistical models were estimated by adjusting for covariates. In addition, we performed the mediation analysis by stratifying moderate physical activity. All statistical analyses were performed using SAS 9.2 (SAS Institute, Cary, NC, USA).
RESULTS
The basic characteristics of the study population are shown in Table 1. The mean age of the subjects was 49.37 years, and the proportion of female (52.9%) was slightly higher than that of male (47.2%). Most of the subjects were married (71.7%) and about 43% of the subjects were graduated from middle-high school. The percentage of people who did not involve economic activities was the highest (38.1%), followed by blue-color workers (29.2%).
The proportion of current smokers and drinkers were 24.2% and 51.0%, respectively. The proportion of people engaged in moderate physical activity was 29.4%, and about 26% of subjects were highly stressed. The proportion of people living in rural (54.0%) was slightly higher than that in urban (46.0%). The mean BMI of the subjects was 22.95 kg/m2.
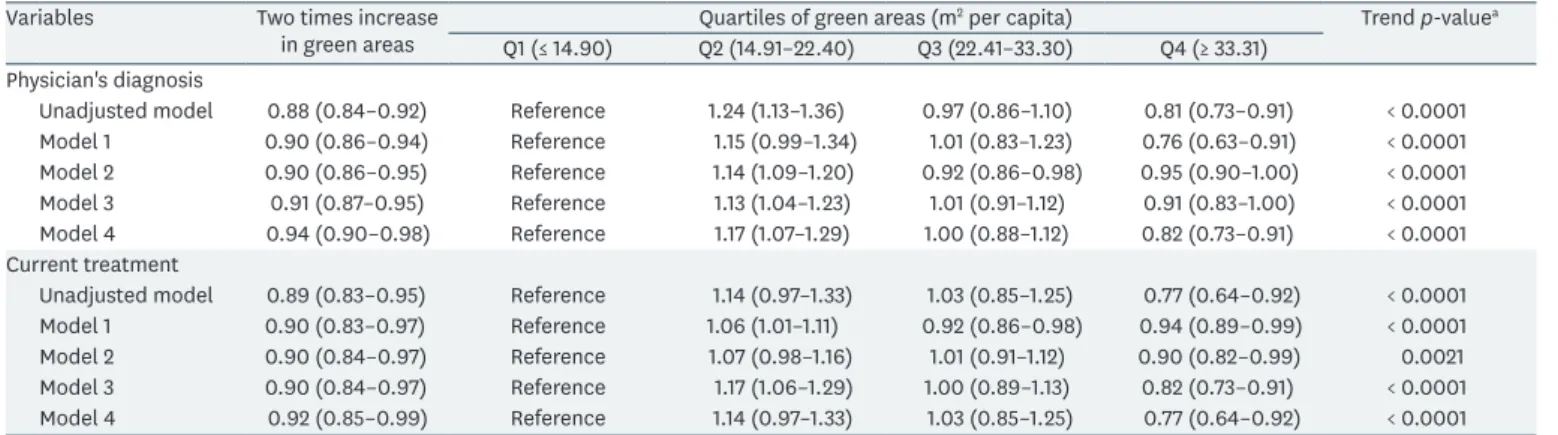
Table 2 provides the ORs (95% CI) for atopic dermatitis by green areas level according to adjustment models. In the case of self-reported atopic dermatitis based on physician diagnosis, the highest level of green areas was significantly associated with decreased risk of atopic dermatitis (OR in quartile 4, 0.82; 95% CI, 0.73–0.91, Model 4). As green areas increased, the risk of atopic dermatitis was gradually decreased (p-value for trend < 0.0001, all adjustment models). Likewise, high levels of green areas were significantly associated with a decreased risk of atopic dermatitis based on self-reports of current treatment (OR in quartile 4 = 0.77; 95% CI
= 0.64–0.92, Model 4). For 2 times increase in green areas, the adjusted ORs (95% CI) for atopic dermatitis were 0.94 (0.90–0.98) in the physician's diagnosis and 0.92 (0.85–0.99) in current treatment, respectively (Model 4), which were statistically significant.
The logistic regression results (95% CI) for allergic rhinitis were given in Table 3. These were similar to those of atopic dermatitis. Compared with the lowest level of green areas (quartile 1), the highest level (quartile 4) showed decreased risks of allergic rhinitis in adjustment
models. In the full covariate model (model 4), the ORs (95% CI) of allergic rhinitis based on physician diagnosis and current treatment were 0.94 (0.89–0.99) and 0.91 (0.82–1.00), respectively. As green areas increased, the risk of allergic rhinitis was gradually decreased (p-value for trend < 0.05, all adjustment models except for Model 3 in current treatment).
Unlike atopic dermatitis, the adjusted ORs (95% CI) per 2 increases in green areas for allergic rhinitis based on the physician's diagnosis and current treatment were not significant in full covariate model (model 4).
The association results stratified by moderate physical activity were indicated in Table 4.
When moderate physical activity was classified into 2 groups (yes or no), the group with moderate physical activity (yes) showed a more beneficial impact from green areas on atopic dermatitis than the moderate physical inactivity group (no). In the results for 2 times increase in green areas, the adjusted ORs (95% CI) for atopic dermatitis based on physician diagnosis Table 1. Characteristics of study population
Characteristics Values
Age (years) 49.37 ± 16.24
Sex
Male 100,302 (47.15)
Female 112,422 (52.85)
Marital status
Married 152,531 (71.7)
Divorced/widowed 28,247 (13.28)
Never married 31,946 (15.02)
Education
Elementary or less 55,659 (26.16)
Middle-High school 91,839 (43.17)
College or higher 65,226 (30.66)
Monthly income (1,000 KRW)
Q1 (≤ 1,000) 54,378 (25.56)
Q2 (1,001–2,000) 51,633 (24.27)
Q3 (2,001–3,500) 46,299 (21.76)
Q4 (≥ 3,501) 60,414 (28.4)
Job categories
White-collar 40,398 (18.99)
Pink-collar 28,031 (13.18)
Blue-collar 62,133 (29.21)
Military 1,043 (0.49)
No economic act 81,119 (38.13)
Cigarette smoking
Current smoker 51,530 (24.22)
Former smoker 29,283 (13.77)
Never smoker 131,911 (62.01)
Alcohol drinking
Drinker 108,520 (51.01)
Non-drinker 104,204 (48.99)
Moderate activity
Yes 62,448 (29.36)
No 150,276 (70.64)
Self-reported stress
High 56,424 (26.52)
Low 156,300 (73.48)
Urbanity
Urban 97,923 (46.03)
Rural 114,801 (53.97)
BMI (kg/m2) 22.95 ± 3.04
Values are expressed as mean±standard deviation or number (%).
KRW: Korea Won; BMI: body mass index.
and current treatment were 0.90 (0.83–0.98) and 0.79 (0.68–0.91). However, no association between green areas and atopic dermatitis was observed in the moderate physical inactivity group. In the results for the quartiles of green areas, the group that participated in moderate physical activity (yes) had lower ORs for individuals with atopic dermatitis than the group that did not participate in physical activity (no). Compared with the lowest quartile for green areas (quartile 1), the adjusted ORs (95% CI) in the 4th quartile for atopic dermatitis based on physician diagnosis and current treatment were 0.70 (0.58–0.85) and 0.56 (0.41–0.77) in the moderate physical activity group (yes) and 0.76 (0.67–0.86) and 0.76 (0.62–0.93) in the moderate physical inactivity group (no). However, the association between green areas and allergic rhinitis according to the moderate physical activity had no clear pattern.
DISCUSSION
This study investigated the associations between green areas and allergic diseases such as atopic dermatitis and allergic rhinitis in Korean adults. Our results showed the protective effects of green areas on atopic dermatitis and allergic rhinitis. The risk of atopic dermatitis in the highest level of green areas was significantly higher compared with the lowest level Table 2. Prevalence odds ratio (95% confidence interval) for atopic dermatitis by the level green areas
Variables Two times increase
in green areas Quartiles of green areas (m2 per capita) Trend p-valuea
Q1 (≤ 14.90) Q2 (14.91–22.40) Q3 (22.41–33.30) Q4 (≥ 33.31) Physician's diagnosis
Unadjusted model 0.88 (0.84–0.92) Reference 1.24 (1.13–1.36) 0.97 (0.86–1.10) 0.81 (0.73–0.91) < 0.0001 Model 1 0.90 (0.86–0.94) Reference 1.15 (0.99–1.34) 1.01 (0.83–1.23) 0.76 (0.63–0.91) < 0.0001 Model 2 0.90 (0.86–0.95) Reference 1.14 (1.09–1.20) 0.92 (0.86–0.98) 0.95 (0.90–1.00) < 0.0001 Model 3 0.91 (0.87–0.95) Reference 1.13 (1.04–1.23) 1.01 (0.91–1.12) 0.91 (0.83–1.00) < 0.0001 Model 4 0.94 (0.90–0.98) Reference 1.17 (1.07–1.29) 1.00 (0.88–1.12) 0.82 (0.73–0.91) < 0.0001 Current treatment
Unadjusted model 0.89 (0.83–0.95) Reference 1.14 (0.97–1.33) 1.03 (0.85–1.25) 0.77 (0.64–0.92) < 0.0001 Model 1 0.90 (0.83–0.97) Reference 1.06 (1.01–1.11) 0.92 (0.86–0.98) 0.94 (0.89–0.99) < 0.0001
Model 2 0.90 (0.84–0.97) Reference 1.07 (0.98–1.16) 1.01 (0.91–1.12) 0.90 (0.82–0.99) 0.0021
Model 3 0.90 (0.84–0.97) Reference 1.17 (1.06–1.29) 1.00 (0.89–1.13) 0.82 (0.73–0.91) < 0.0001 Model 4 0.92 (0.85–0.99) Reference 1.14 (0.97–1.33) 1.03 (0.85–1.25) 0.77 (0.64–0.92) < 0.0001 Model 1 was adjusted by age, sex, marriage, education, monthly income, and job categories; Model 2 was further adjusted for smoking and alcohol; Model 3 was further adjusted for physical activity and self-reported stress; Model 4 was further adjusted for urbanity and body mass index.
aTrend p-value was estimated based on the Wald statistics.
Table 3. Prevalence odds ratio (95% confidence interval) for allergic rhinitis by the level of green areas
Variables Two times increase
in green areas Quartiles of green areas (m2 per capita) Trend p-valuea
Q1 (≤ 14.90) Q2 (14.91–22.40) Q3 (22.41–33.30) Q4 (≥ 33.31) Physician's diagnosis
Unadjusted model 0.91 (0.89–0.93) Reference 1.06 (1.01–1.11) 0.92 (0.86–0.98) 0.94 (0.89–0.99) < 0.0001
Model 1 0.94 (0.92–0.96) Reference 1.07 (0.98–1.16) 1.01 (0.91–1.12) 0.90 (0.82–0.99) 0.0019
Model 2 0.94 (0.92–0.96) Reference 1.16 (1.06–1.28) 1.01 (0.89–1.14) 0.82 (0.73–0.92) < 0.0001
Model 3 0.94 (0.92–0.96) Reference 1.12 (0.96–1.31) 1.04 (0.85–1.26) 0.77 (0.64–0.93) 0.0002
Model 4 0.99 (0.96–1.01) Reference 1.05 (1.00–1.10) 0.93 (0.87–0.99) 0.94 (0.89–0.99) < 0.0001 Current treatment
Unadjusted model 0.94 (0.91–0.98) Reference 1.06 (0.98–1.15) 1.02 (0.91–1.13) 0.90 (0.82–0.99) 0.0036 Model 1 0.96 (0.93–1.00) Reference 1.14 (1.04–1.26) 1.07 (0.94–1.21) 0.85 (0.76–0.95) < 0.0001
Model 2 0.96 (0.93–1.00) Reference 1.12 (0.95–1.31) 1.06 (0.86–1.30) 0.78 (0.65–0.94) 0.0005
Model 3 0.97 (0.93–1.01) Reference 1.03 (0.98–1.08) 1.00 (0.94–1.07) 0.99 (0.93–1.04) 0.4570
Model 4 0.98 (0.94–1.02) Reference 1.06 (0.97–1.15) 1.03 (0.93–1.15) 0.91 (0.82–1.00) 0.0104
Model 1 was adjusted by age, sex, marriage, education, monthly income, and job categories; Model 2 was further adjusted for smoking and alcohol; Model 3 was further adjusted for physical activity and self-reported stress; Model 4 was further adjusted for urbanity and body mass index.
aTrend p-value was estimated based on the Wald statistics.
of green areas (OR in quartile 4, 0.82; 95% CI, 0.73–0.91, Model 4). Similarly, a high level of green areas was significantly associated with a decreased risk of allergic rhinitis (OR in quartile 4 = 0.94; 95% CI = 0.89-0.99, Model 4). In addition, the group that participated in moderate physical activity (Yes) had lower ORs for individuals with atopic dermatitis than the group that did not participate in physical activity (No), suggesting that moderate physical activity is a potential mediator for this association. The current study supports the previous evidence that greenness has an effect in a protective direction against allergic diseases [8,9,11,12].
To date, several studies have reported associations between greenness and allergy-related conditions such as asthma and rhinitis in children or adolescents. However, results have been inconsistent. In 2008, Lovasi et al. [19] first reported that street trees in New York city were significantly associated with a lower of childhood asthma (≤ 15 years old). In 2009, a large-scale epidemiological study based on the Dutch population also identified that the annual prevalence rate of asthma was lower in people who have 10% more green area than average in a 1 km radius around their home [20]. In 2014, Lynch et al. [10] suggested that concomitant exposure to high levels of certain allergens and bacteria in early life might be beneficial. Furthermore, recent studies reported by Hanski and colleagues [9] demonstrated the environmental biodiversity hypothesis regarding atopy, showing the inverse relationship Table 4. Prevalence odds ratio (95% CI) for atopic dermatitis and allergic rhinitis by the level of green areas, stratified by moderate physical activity
Variables Moderate physical activity
Yes No
Atopic dermatitis (Physician's diagnosis)
Two time increase in green areas 0.90 (0.83–0.98) 0.96 (0.90–1.01)
Quartiles of green areas
Q1 (≤ 14.90) Reference Reference
Q2 (14.90–22.40) 0.69 (0.58–0.84) 0.96 (0.86–1.07)
Q3 (22.41–33.30) 0.86 (0.69–1.06) 0.96 (0.84–1.11)
Q4 (≥ 33.31) 0.70 (0.58–0.85) 0.76 (0.67–0.86)
Trend p-valuea < 0.0001 0.0001
Atopic dermatitis (Current treatment)
Two time increase in green areas 0.79 (0.68–0.91) 0.97 (0.89–1.06)
Quartiles of green areas
Q1 (≤ 14.90) Reference Reference
Q2 (14.90–22.40) 0.54 (0.40–0.73) 1.07 (0.89–1.28)
Q3 (22.41–33.30) 0.64 (0.46–0.89) 1.09 (0.86–1.39)
Q4 (≥ 33.31) 0.56 (0.41–0.77) 0.76 (0.62–0.93)
Trend p-valuea < 0.0001 0.0046
Allergic rhinitis (Physician's diagnosis)
Two time increase in green areas 0.99 (0.95–1.03) 0.99 (0.96–1.02)
Quartiles of green areas
Q1 (≤ 14.90) Reference Reference
Q2 (14.90–22.40) 0.98 (0.90–1.07) 0.97 (0.92–1.03)
Q3 (22.41–33.30) 1.05 (0.95–1.17) 0.94 (0.88–1.02)
Q4 (≥ 33.31) 0.97 (0.88–1.06) 0.96 (0.90–1.02)
Trend p-valuea 0.4428 0.3789
Allergic rhinitis (Current treatment)
Two time increase in green areas 0.99 (0.92–1.07) 0.97 (0.92–1.02)
Quartiles of green areas
Q1 (≤ 14.90) Reference Reference
Q2 (14.90–22.40) 1.04 (0.89–1.22) 0.91 (0.83–1.01)
Q3 (22.41–33.30) 1.15 (0.97–1.36) 0.92 (0.81–1.04)
Q4 (≥ 33.31) 0.90 (0.77–1.06) 0.85 (0.76–0.94)
Trend p-valuea 0.0882 0.0215
The results were adjusted by age, sex, marriage, education, monthly income, job categories, smoking, alcohol, self-reported stress, urbanity, and body mass index.
aTrend p-value was estimated based on the Wald statistics.
between the amount of forest and agricultural land around the home and atopic sensitization in children [11]. In addition, Sbihi et al. [12] reported the beneficial effects of surrounding greenness on asthma in preschool-age children. In contrast, there is evidence of the harmful effects of greenness on allergic diseases. In 2012, one association study based on asthmatic children aged 4–12 years in south-central Massachusetts, Connecticut, and New York state reported that asthmatic symptoms were closely related to ambient exposure to all-type pollen, as well as grass, tree, and weed pollen [21]. Similarly, in 2013, the results from a birth cohort based in New York city (population of African-American and Dominican families) showed that the tree canopy coverage in urban areas significantly increased the risks of asthma, any specific allergic sensitization, and allergic sensitization to tree pollen at 7 years of age [15]. In 2014, Dadvand et al. [2] also demonstrated that residential proximity to parks was significantly associated with an increased prevalence of current asthma or allergic rhinoconjunctivitis in schoolchildren aged 9–12 years in Sabadell of Spain. Interestingly, Fuertes's study [8] performed in 2 areas (GINI/LISA South and GINI/LISA North) of Germany reported heterogeneous association results between greenness and allergies across study areas despite applying identical study methods in both areas. In recent, they reconfirmed their heterogeneous result according to the area in seven birth cohort data from Swedish (BAMSE), Australian, (MACS), Dutch (PIAMA), Canadian (CAPPS and SAGE), and German (GINIplus and LISAplus), identifying that the effect direction of residential greenness related to allergic rhinitis and aeroallergen sensitization varies by study location [14]. In addition, Andrusaityte et al. [13]
found that greenness was related to an increased relative risk of asthma in preschool children.
This inconsistency regarding greenness effects on allergic diseases may be partially explained by different methodologies such as survey area, study participants' characteristic (i.e., age and ethnicity), and greenness exposure assessment. Differences in the typical structure of country- specific green systems may also explain such discrepancies.
This is the first report to investigate the associations between green areas and allergic diseases (i.e., atopic dermatitis and allergic rhinitis) in Asian adults. Most studies of effects of residential greenness on allergic diseases have focused primarily on children and adolescents in Europe. Thus, this study provides valuable evidence for the protective effects of greenness on allergic diseases in Korean adults, when considering the high prevalence of allergic diseases in adults. The beneficial effects of early-life exposure to green space on allergic diseases have been mostly regarded as the exposure effect of various environmental microbiota influencing an immune response (i.e., the biodiversity hypothesis) [11]. Although there is no direct evidence showing that the adult immune system can be reprogrammed by the environment, our significant findings in adults may be interpreted based on several indirect sources of evidence in the literatures. The greenness effects may be mediated via the benefits of reduced sedentary behaviors. In our data, moderate activity was a potential mediator for association between green areas and atopic dermatitis. It is well known that physical activity or leisure activity is strongly related to decreased allergic symptoms [22,23], even though severe or high-intensity exercise in specific elite athletes, including swimmers, has been reported to induce atopic-related symptoms [24,25]. In addition, green space may reduce air pollution, thereby resulting in a decreased risk of atopic dermatitis or allergic rhinitis. Greenness can improve air quality by several mechanisms, including the air-filtering effect of plants [26-29]. A number of studies have shown that air pollution was associated with the prevalence of allergy-related conditions including atopic dermatitis and allergic rhinitis [30-32]. However, further studies are needed to verify these hypotheses in the inverse relationship between greenness and allergic disease in the adult population.
The first major limitation is that we did not measure the subjects' exposure length of green areas. Because of the unavailability of home address data, we could not measure the number of surrounding green areas within a specific buffer zone around the home of each subject.
Instead, this study used the amount of green spaces per capita in a semi-ecological design that assigned the same level of exposure to all participants living in the same administrative region. However, this design may not take into account the independence of resident individuals within the same administrative district. Second, this was cross-sectional study, and it is thus impossible to assign causality between the amount of greenness per capita and the development of allergic diseases. Third, in our results, it is difficult to rule out the possibility of uncontrolled confounding by socioeconomic status, the onset of allergic disease during childhood, and air pollution, as well as self-selection bias (i.e. healthier people move in places with more green areas). Fourth, this study used the self-report data to assess individuals' allergy-related conditions. Compared to medical records, self-report data have several strengths in that they are relatively less expensive, less time-consuming, and easier. However, this method may not only misinform by faulty memory, but also be distorted by self-deception in case of sensitive topics. Thus, our data needs to be interpreted carefully.
Fifth, our study could not identify impact of early-life exposure to green space for supporting previous theory (i.e. the biodiversity hypothesis), because of unavailability of data. Lastly, the links between greenness and allergic diseases in our study may be different from the association of natural forests and human-created green areas with allergic diseases. However, we could not confirm the effects between them, because of the absence of separate data on artifacts and natural greenness.
CONCLUSIONS
This study aimed to identify associations between greenness and atopic dermatitis or allergic rhinitis in an adult population. Our findings provide evidence that green areas are significantly associated with allergic disease such as atopic dermatitis and allergic rhinitis in Korean adults, showing significant effects in a protective direction.
REFERENCES
1. Bodicoat DH, O'Donovan G, Dalton AM, Gray LJ, Yates T, Edwardson C, et al. The association between neighbourhood greenspace and type 2 diabetes in a large cross-sectional study. BMJ Open 2014;4(12):e006076.
PUBMED | CROSSREF
2. Dadvand P, Villanueva CM, Font-Ribera L, Martinez D, Basagaña X, Belmonte J, et al. Risks and benefits of green spaces for children: a cross-sectional study of associations with sedentary behavior, obesity, asthma, and allergy. Environ Health Perspect 2014;122(12):1329-35.
PUBMED | CROSSREF
3. Dzhambov AM, Dimitrova DD, Dimitrakova ED. Association between residential greenness and birth weight: systematic review and meta-analysis. Urban For Urban Green 2014;13(4):621-9.
CROSSREF
4. Gascon M, Triguero-Mas M, Martínez D, Dadvand P, Forns J, Plasència A, et al. Mental health benefits of long-term exposure to residential green and blue spaces: a systematic review. Int J Environ Res Public Health 2015;12(4):4354-79.
PUBMED | CROSSREF
5. Tamosiunas A, Grazuleviciene R, Luksiene D, Dedele A, Reklaitiene R, Baceviciene M, et al. Accessibility and use of urban green spaces, and cardiovascular health: findings from a Kaunas cohort study. Environ Health 2014;13(1):20.
PUBMED | CROSSREF
6. World Health Organization. Urban green spaces and health: a review of evidence. Geneva: World Health Organization: 2016.
7. Rook GA. Regulation of the immune system by biodiversity from the natural environment: an ecosystem service essential to health. Proc Natl Acad Sci U S A 2013;110(46):18360-7.
PUBMED | CROSSREF
8. Fuertes E, Markevych I, von Berg A, Bauer CP, Berdel D, Koletzko S, et al. Greenness and allergies:
evidence of differential associations in two areas in Germany. J Epidemiol Community Health 2014;68(8):787-90.
PUBMED | CROSSREF
9. Hanski I, von Hertzen L, Fyhrquist N, Koskinen K, Torppa K, Laatikainen T, et al. Environmental biodiversity, human microbiota, and allergy are interrelated. Proc Natl Acad Sci U S A 2012;109(21):8334-9.
PUBMED | CROSSREF
10. Lynch SV, Wood RA, Boushey H, Bacharier LB, Bloomberg GR, Kattan M, et al. Effects of early-life exposure to allergens and bacteria on recurrent wheeze and atopy in urban children. J Allergy Clin Immunol 2014;134(3):593-601.e12.
PUBMED | CROSSREF
11. Ruokolainen L, von Hertzen L, Fyhrquist N, Laatikainen T, Lehtomäki J, Auvinen P, et al. Green areas around homes reduce atopic sensitization in children. Allergy 2015;70(2):195-202.
PUBMED | CROSSREF
12. Sbihi H, Tamburic L, Koehoorn M, Brauer M. Greenness and incident childhood asthma: a 10-year follow- up in a population-based birth cohort. Am J Respir Crit Care Med 2015;192(9):1131-3.
PUBMED | CROSSREF
13. Andrusaityte S, Grazuleviciene R, Kudzyte J, Bernotiene A, Dedele A, Nieuwenhuijsen MJ. Associations between neighbourhood greenness and asthma in preschool children in Kaunas, Lithuania: a case- control study. BMJ Open 2016;6(4):e010341.
PUBMED | CROSSREF
14. Fuertes E, Markevych I, Bowatte G, Gruzieva O, Gehring U, Becker A, et al. Residential greenness is differentially associated with childhood allergic rhinitis and aeroallergen sensitization in seven birth cohorts. Allergy 2016;71(10):1461-71.
PUBMED | CROSSREF
15. Lovasi GS, O'Neil-Dunne JP, Lu JW, Sheehan D, Perzanowski MS, Macfaden SW, et al. Urban tree canopy and asthma, wheeze, rhinitis, and allergic sensitization to tree pollen in a New York City birth cohort.
Environ Health Perspect 2013;121(4):494-500.
PUBMED | CROSSREF
16. Park HS, Choi GS, Cho JS, Kim YY. Epidemiology and current status of allergic rhinitis, asthma, and associated allergic diseases in Korea: ARIA Asia-Pacific workshop report. Asian Pac J Allergy Immunol 2009;27(2-3):167-71.
PUBMED
17. Liebhart J, Dobek R, Małolepszy J, Wojtyniak B, Pisiewicz K, Płusa T, et al. The prevalence of allergic diseases in Poland - the results of the PMSEAD study in relation to gender differences. Adv Clin Exp Med 2014;23(5):757-62.
PUBMED | CROSSREF
18. Kang YW, Ko YS, Kim YJ, Sung KM, Kim HJ, Choi HY, et al. Korea community health survey data profiles.
Osong Public Health Res Perspect 2015;6(3):211-7.
PUBMED | CROSSREF
19. Lovasi GS, Quinn JW, Neckerman KM, Perzanowski MS, Rundle A. Children living in areas with more street trees have lower prevalence of asthma. J Epidemiol Community Health 2008;62(7):647-9.
PUBMED | CROSSREF
20. Maas J, Verheij RA, de Vries S, Spreeuwenberg P, Schellevis FG, Groenewegen PP. Morbidity is related to a green living environment. J Epidemiol Community Health 2009;63(12):967-73.
PUBMED | CROSSREF
21. DellaValle CT, Triche EW, Leaderer BP, Bell ML. Effects of ambient pollen concentrations on frequency and severity of asthma symptoms among asthmatic children. Epidemiology 2012;23(1):55-63.
PUBMED | CROSSREF
22. Font-Ribera L, Kogevinas M, Zock JP, Nieuwenhuijsen MJ, Heederik D, Villanueva CM. Swimming pool attendance and risk of asthma and allergic symptoms in children. Eur Respir J 2009;34(6):1304-10.
PUBMED | CROSSREF
23. Kilpeläinen M, Terho EO, Helenius H, Koskenvuo M. Body mass index and physical activity in relation to asthma and atopic diseases in young adults. Respir Med 2006;100(9):1518-25.
PUBMED | CROSSREF
24. Alves A, Martins C, Delgado L, Fonseca J, Moreira A. Exercise-induced rhinitis in competitive swimmers.
Am J Rhinol Allergy 2010;24(5):e114-7.
PUBMED | CROSSREF
25. Helenius IJ, Tikkanen HO, Sarna S, Haahtela T. Asthma and increased bronchial responsiveness in elite athletes: atopy and sport event as risk factors. J Allergy Clin Immunol 1998;101(5):646-52.
PUBMED | CROSSREF
26. Dadvand P, de Nazelle A, Triguero-Mas M, Schembari A, Cirach M, Amoly E, et al. Surrounding greenness and exposure to air pollution during pregnancy: an analysis of personal monitoring data. Environ Health Perspect 2012;120(9):1286-90.
PUBMED | CROSSREF
27. Nowak DJ, Crane DE, Stevens JC. Air pollution removal by urban trees and shrubs in the United States.
Urban For Urban Green 2006;4(3-4):115-23.
CROSSREF
28. Nowak DJ, Heisler GM. Air quality effects of urban trees and parks. Ashburn: National Recreation and Parks Association; 2010.
29. Nowak DJ, Crane DE. Carbon storage and sequestration by urban trees in the USA. Environ Pollut 2002;116(3):381-9.
PUBMED | CROSSREF
30. Ahn K. The role of air pollutants in atopic dermatitis. J Allergy Clin Immunol 2014;134(5):993-9.
PUBMED | CROSSREF
31. Hwang BF, Jaakkola JJ, Lee YL, Lin YC, Guo YL. Relation between air pollution and allergic rhinitis in Taiwanese schoolchildren. Respir Res 2006;7(1):23.
PUBMED | CROSSREF
32. Kim HO, Kim JH, Cho SI, Chung BY, Ahn IS, Lee CH, et al. Improvement of atopic dermatitis severity after reducing indoor air pollutants. Ann Dermatol 2013;25(3):292-7.
PUBMED | CROSSREF