© 2017 The Korean Academy of Medical Sciences.
This is an Open Access article distributed under the terms of the Creative Commons Attribution Non-Commercial License (http://creativecommons.org/licenses/by-nc/4.0) pISSN 1011-8934
Trends of Social Inequalities in the Specific Causes of Infant Mortality in a Nationwide Birth Cohort in Korea, 1995–2009
The relationship between social disparity and specific causes of infant mortality has rarely been studied. The present study analyzed infant mortality trends according to the causes of death and the inequalities in specific causes of infant mortality between different parental social classes. We analyzed 8,209,836 births from the Statistics Korea between 1995 and 2009. The trends of disparity for cause-specific infant mortality according to parental education and employment were examined using the Cox proportional hazard model for the birth-year intervals of 1995–1999, 2000–2004, and 2005–2009. Adjusted hazard ratios were calculated after adjusting for infants’ gender, parents’ age, maternal obstetrical history, gestational age, and birth weight. An increasing trend in social inequalities in all-cause infant mortality according to paternal education was evident.
Social inequalities in infant mortality were greater for “Not classified symptoms, signs and findings” (International Classification of Diseases 10th revision [ICD-10]: R00–R99) and
“Injury, poisoning and of external causes” (S00–T98), particularly for “Ill-defined and unspecified causes” (R990) and “Sudden infant death syndrome (SIDS)” (R950); and increased overtime for “Not classified symptoms, signs and findings” (R00–R99), “Injury, poisoning and of external causes” (S00–T98) and “Conditions in perinatal period” (P00–
P96), particularly for “SIDS” (R950) and “Respiratory distress syndrome of newborns (RDS)”
(P220). The specific causes of infant mortality, in particular the “Not classified causes”
(R00–R99 coded deaths) should be investigated more thoroughly to reduce inequality in health.
Keywords: Trends of Social Inequalities; Cause-specific Infant Mortality; Maternal Education; Paternal Education; Maternal Employment; Paternal Employment
Mia Son,1 Soo-Jeong An,2and Young-Ju Kim2
1Department of Preventive Medicine, Kangwon National University, School of Medicine, Chuncheon, Korea; 2Department of Statistics, Kangwon National University, College of Natural Science, Chuncheon, Korea
Received: 5 February 2017 Accepted: 28 May 2017 Address for Correspondence:
Young-Ju Kim, PhD
Department of Statistics, Kangwon National University, College of Natural Science, 1 Kangwondaehak-gil, Chuncheon 24341, Republic of Korea
E-mail: [email protected]
Funding: This study was supported by a grant from the National R & D Program for Cancer Control, Ministry of Health and Welfare, Republic of Korea (0820280) and by the Ministry of Science, ICT and Future Planning (MSIP), Korea, under the Open ICT Convergence support program (NIPA-2015-H1819-13-1008) supervised by the National IT Industry Promotion Agency (NIPA).
https://doi.org/10.3346/jkms.2017.32.9.1401 • J Korean Med Sci 2017; 32: 1401-1414
INTRODUCTION
Social inequalities within the context of all-cause infant mortal- ity have been addressed (1-4). However, little is known of social disparity in infant mortality with regard to the specific causes of death, and social disparity trends over time according to specif- ic causes of infant death.
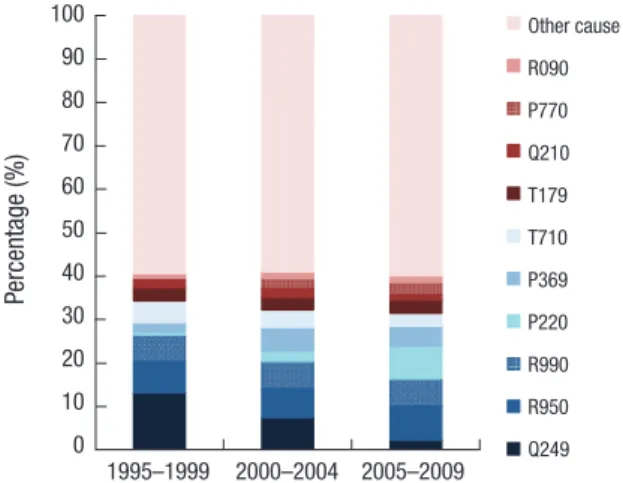
In Korea, all-cause infant mortality has encouragingly been in a downtrend. Korea is ranked as the 10th lowest level among Or- ganisation for Economic Co-operation and Development (OECD) countries in all-cause infant mortality. However, this decreasing trend has slowed for several specific causes of infant deaths since 2011 (5). In addition, the top specific causes of infant mortality have been changing. The R00–R99-coded deaths used for “Not classified symptoms, signs and findings (International Classifi- cation of Diseases 10th revision [ICD-10])” have now become the primary cause of infant mortality. “Congenital malformations”
(Q00–Q99), which in the mid-1990s was the primary cause of in- fant mortality, has been ranked second since 2000 (6).
Until now, the aforementioned category “Not classified symp-
toms, signs and findings (R00–R99-coded deaths) have been considered as merely as an “unknown” disease as a whole (7,8).
However, because code item “Sudden infant death syndrome (SIDS)” (R950) and “Ill-defined and unspecified causes” (R990) in this “unknown” disease category has become the first rank- ing cause, there is an even greater need to investigate the causes of infant deaths. However, only a few studies have addressed which diseases contribute most to the social disparities in in- fant mortality. Little consideration has been given to the study of social disparities in unknown causes of infant mortality, in- cluding ill-defined and unspecified causes and especially con- cerning SIDS.
How the changes in occurrence of specific causes of infant mortality contribute to the inequalities in infant mortality needs to be clarified. This study aims to analyze infant mortality trends by cause of death and disparities in infant mortality according to parental social class. It is hope that the findings will provide insight into efforts to reduce the social inequalities of infant mor- tality and will inform policies that seek to reduce the social in- equalities of infant mortality.
ORIGINAL ARTICLE
Occupation & Environmental Medicine
2017-03-16 https://crossmark-cdn.crossref.org/widget/v2.0/logos/CROSSMARK_Color_square.svg
1402
http://jkms.org https://doi.org/10.3346/jkms.2017.32.9.1401MATERIALS AND METHODS
Nationwide cohort data were obtained by linking birth and death certificates from the Statistics Korea from 1995 to 2009. A total of 8,209,836 births and 15,866 deaths were used in the statistical analysis, after excluding infants whose birth weight was less than 500 g or whose gestational age was less than 22 weeks (in accor- dance with the World Health Organization survival standard).
Infant death was defined as death within a year after birth. In- fants who were not identified as dead were followed-up for a year after birth.
Information on parental education level and employment, which are socioeconomic risk factors of infant mortality, were obtained from the birth certificates. Factors regarding maternal obstetrical history include the number of children, number of deaths of children, gestational age, parity, birth weight, and child gender. Parental education level was classified as ≥ university (≥ 13 years), high school (10–12 years), or ≤ middle school (≤ 9 years). Parental employment consisted of the non-manual group (e.g., legislators, senior officials, managers, professionals, tech- nicians and practical professionals, office workers, service work- ers, and sales workers), manual group (e.g., skilled agricultural, forestry and fishery workers, craft workers, device/machine op- erators/assemblers, and laborers), and the economically inac- tive group (e.g., unemployed, students, housekeepers, and sol- diers).
In this study, after comparing the distribution of “3-character categories (cause-specific mortality)” defined by ICD-10 as well as “4-character subcategories (detailing cause-specific mortali- ty)” defined by ICD-10 of infant death, we selected the top four
“3-character categories” and the top four “4-character subcate- gories” of infant death between 1995 and 2009. The causes of infant death were classified by the Korean Standard Classifica- tion of Disease into “3-character categories” of infant death be-
tween 1995 and 2009: “Conditions in perinatal period” (P00–
P96); “Congenital malformations” (Q00–Q99); “Not classified symptoms, signs and findings” (R00–R99); and “Injury, poison- ing and of external causes” (S00–T98). In addition to these four causes of infant death, “4-character subcategories” of infant death with a relatively high prevalence between 1995 and 2010, based on data from the National Statistics Office of Korea, were also studied. These included “Congenital malformation of the heart” (Q249); “SIDS” (R950); “Ill-defined and unspecified causes”
(R990); and “Respiratory distress syndrome of newborns (RDS)”
(P220) (Fig. 1).
To examine the trend of infant mortality, birth years were clas- sified into three intervals: 1995–1999, 2000–2004, and 2005–2009.
We calculated infant mortality rate as being the number of deaths of children aged less than one year old per 1,000 live births in the same birth interval. The disparity of cause-specific infant mortality according to parental education and employment was examined using the difference in infant mortality rate and the adjusted hazard ratio (HR) from a Cox proportional hazard model. The adjusted HRs were calculated after adjusting for in- fants’ gender, parents’ age, maternal obstetrical history (e.g., parity, number of children, and number of deaths among chil- dren), gestational age, and birth weight. We tested for an incre- asing trend of disparity in cause-specific infant mortality over time by analyzing for causality-linked differences in infant mor- tality rate and performed tests on adjusted HR using linear re- gression modeling. All analyses were performed using SAS 9.3 (SAS Institute Inc., Cary, NC, USA), and the significance level was set at 0.05.
Ethics statement
The study protocol was approved by the Institutional Review Board of Kangwon National University (IRB No. KWNUIRB-2016- 09-003-001). Informed consent was confirmed by IRB.
Fig. 1. Percentage of cause-specific infant death in the time trend of 1995–1999, 2000–2004, and 2005–2009.
0%
10%
20%
30%
40%
50%
60%
70%
80%
90%
100%
1995-1999 2000-2004 2005-2009
Percentage
Other causes I00-I99 G00-G99 J00-J99 S00-T99 R00-R99 Q00-Q99 P00-P96
0%
10%
20%
30%
40%
50%
60%
70%
80%
90%
100%
1995-1999 2000-2004 2005-2009
Percentage
other causes R090 P770 Q210 T179 T710 P369 P220 R990 R950 Q249 Other causes : 939 causes of infant death of less than 1%
Fig. 1. Percentage of cause-specific infant death in the time trend of 1995-1999, 2000-2004, and 2005-2009.
Percentage (%)
Other causes: 9 causes of infant death of less than 3%
1995–1999 2000–2004 2005–2009 100
90 80 70 60 50 40 30 20 10 0
Other causes I00-I99 G00-G99 J00-J99 S00-T99 R00-R99 Q00-Q99 P00-P96 0%
10%
20%
30%
40%
50%
60%
70%
80%
90%
100%
1995-1999 2000-2004 2005-2009
Percentage
Other causes I00-I99 G00-G99 J00-J99 S00-T99 R00-R99 Q00-Q99 P00-P96
0%
10%
20%
30%
40%
50%
60%
70%
80%
90%
100%
1995-1999 2000-2004 2005-2009
Percentage
other causes R090 P770 Q210 T179 T710 P369 P220 R990 R950 Q249 Other causes : 939 causes of infant death of less than 1%
Fig. 1. Percentage of cause-specific infant death in the time trend of 1995-1999, 2000-2004, and 2005-2009.
0%
10%
20%
30%
40%
50%
60%
70%
80%
90%
100%
1995-1999 2000-2004 2005-2009
Percentage
Other causes I00-I99 G00-G99 J00-J99 S00-T99 R00-R99 Q00-Q99 P00-P96
0%
10%
20%
30%
40%
50%
60%
70%
80%
90%
100%
1995-1999 2000-2004 2005-2009
Percentage
other causes R090 P770 Q210 T179 T710 P369 P220 R990 R950 Q249 Other causes : 939 causes of infant death of less than 1%
Fig. 1. Percentage of cause-specific infant death in the time trend of 1995-1999, 2000-2004, and 2005-2009.
Percentage (%)
Other causes: 939 causes of infant death of less than 1%
1995–1999 2000–2004 2005–2009 100
90 80 70 60 50 40 30 20 10 0
Other cause R090 P770 Q210 T179 T710 P369 P220 R990 R950 Q249
RESULTS
All-cause mortality according to parents’ social class
Table 1 presents the all-cause infant mortality rate of each birth year interval. In all birth-year intervals, the infant mortality rate
was higher when the parental educational level was lower, when paternal employment was in the economically inactive status, when maternal employment was manually active or economi- cally inactive, when parental age was either < 25 years or ≥ 40 years, and when the infants were in the preterm birth (PTB) or
Table 1. Infant mortality rate according to parental age, parental education, parental employment, and birth characteristics in Korea in the time trend of 1995–1999, 2000–
2004, and 2005–2009
Characteristics
1995–1999 2000–2004 2005–2009
No. of birth
No. of infant death
Infant mortality rate*
No. of birth
No. of infant death
Infant mortality rate*
No. of birth
No. of infant death
Infant mortality rate*
Paternal education
≥ University 1,426,097 2,448 1.72 1,376,027 1,925 1.40 1,452,776 1,891 1.30
High school 1,631,021 3,809 2.34 1,130,126 2,401 2.12 744,658 1,605 2.16
≤ Middle school 247,607 992 4.01 111,554 419 3.76 57,082 232 4.06
Maternal education
≥ University 981,018 1,641 1.67 1,157,691 1,567 1.35 1,372,941 1,811 1.32
High school 2,094,620 4,685 2.24 1,377,952 2,827 2.05 837,136 1,742 2.08
≤ Middle school 232,605 936 4.02 86,211 383 4.44 51,773 214 4.13
Paternal employment
Non-manual 1,661,221 3,086 1.86 1,417,437 2,171 1.53 1,362,914 1,905 1.40†
Manual 1,482,405 3,761 2.54 1,035,986 2,198 2.12 742,971 1,496 2.01†
Inactive 160,285 410 2.56 147,723 355 2.40 97,998 236 2.41
Maternal employment
Non-manual 322,516 534 1.66 337,769 441 1.31 467,294 570 1.22†
Manual 105,545 295 2.80 99,572 223 2.24 107,125 185 1.73‡
Inactive 2,874,156 6,420 2.23 2,176,085 4,098 1.88 1,673,279 2,991 1.79†
Paternal age
< 25 127,558 390 3.06 66,863 176 2.63 41,193 118 2.86
25–29 1,163,629 2,417 2.08 676,101 1,192 1.76 421,636 610 1.45†
30–34 1,459,501 3,012 2.06 1,285,563 2,137 1.66 1,057,793 1,553 1.47†
35–39 463,948 1,151 2.48 473,615 917 1.94 585,395 1,048 1.79†
≥ 40 92,642 288 3.11 117,235 338 2.88 151,232 399 2.64
Maternal age
< 25 578,760 1,546 2.67 286,451 672 2.35 156,795 400 2.55
25–29 1,800,069 3,576 1.99 1,242,061 2,090 1.68 855,417 1,290 1.51
30–34 748,642 1,645 2.20 887,504 1,498 1.69 957,867 1,452 1.52
35–39 162,848 446 2.74 179,974 442 2.46 264,332 550 2.08
≥ 40 21,137 60 2.84 27,460 89 3.24 32,189 82 2.55
No. of children
1 3,266,749 6,949 2.13 2,576,089 4,456 1.73 2,210,209 3,424 1.55†
≥ 2 46,860 334 7.13 49,952 333 6.67 58,410 358 6.13‡
Parity (birth order)
1 1,615,535 2,899 1.79 1,277,645 1,885 1.48 1,185,731 1,607 1.36
2 1,388,094 3,438 2.48 1,086,566 2,185 2.01 864,353 1,555 1.80†
≥ 3 309,866 946 3.05 260,997 716 2.74 215,096 608 2.83
No. of death among children
0 3,290,675 7,108 2.16 2,606,797 4,638 1.78 2,254,147 3,644 1.62
≥ 1 22,819 175 7.67 18,399 148 8.04 11,013 125 11.35
Gender of births
Females 1,573,443 3,286 2.09 1,255,641 2,140 1.70 1,098,424 1,725 1.57
Males 1,740,207 3,997 2.30 1,370,687 2,660 1.94 1,171,434 2,058 1.76
LBW
No LBW 3,205,188 5,829 1.82 2,522,040 3,334 1.32 2,164,603 2,262 1.04†
LBW 108,462 1,454 13.41 104,288 1,466 14.06 105,255 1,521 14.45†
PTB
No PT 3,207,496 6,101 1.90 2,513,401 3,411 1.36 2,151,403 2,340 1.09
PT 106,154 1,182 11.13 112,927 1,389 12.30 118,455 1,443 12.18
Total 3,313,650 7,283 2.20 2,626,328 4,800 1.83 2,269,858 3,783 1.67†
LBW = low birth weight, PTB = preterm birth.
*Infant mortality rate: deaths per 1,000 infants; †P value for trend < 0.050; ‡< 0.010.
1404
http://jkms.org https://doi.org/10.3346/jkms.2017.32.9.1401low birth weight (LBW) state.
The all-cause infant mortality rate per 1,000 infants in each birth-year interval decreased with time (2.20 for infants born in 1995–1999, 1.83 for infants born in 2000–2004, and 1.67 for in- fants born in 2005–2009; P < 0.001). The mortality rate increased over time for LBW infants (P < 0.050).
Cause-specific infant mortality, according to parental education
The difference in infant mortality rate for cause-specific deaths
“3-character categories” in the in the ICD-10 between infants with the highest and the lowest parental education levels was the largest for “Not classified symptoms, signs and findings”
(R00–R99-coded deaths). The difference increased over time (P = 0.003 for paternal education; P = 0.004 for maternal edu- cation). The infant mortality rate for “Conditions in perinatal period” (P00–P96) increased for infants with all paternal educa- tion levels, and the infant mortality rate for “Congenital malfor- mations” (Q00–Q99) was found to be decreasing for infants with all maternal education levels. In particular, the infant mortality
rate for “Not classified symptoms, signs and findings” (R00–R99) was increased for infants whose parents’ educational level was the lowest (Fig. 2).
In all birth-year intervals, infants’ death risk from any of four
“3-character categories” increased in conjunction with increas- ingly lower parental educational levels after adjusting for gen- der, parental age, maternal obstetrical history (parity, the num- ber of children, and the number of death among children), ges- tational age, and birth weight. The adjusted HR for infants was the largest for both “Not classified symptoms, signs and find- ings” (R00–R99) and “Injury, poisoning and of external causes”
(S00–T98) in relation to parental educational level in every birth- year interval; when comparing infants whose parents had a mid- dle school or lower educational level with infants whose parents had a university-level education or higher (Table 2). Identifica- tion was made of the major causes of death for which the social inequalities between a parental educational level of either uni- versity or higher vs. middle school or lower) increased the risk of infant mortality over time. These major causes of death in- cluded “Congenital malformations” (Q00–Q99) (P < 0.010), “Not
Fig. 2. Difference in infant mortality of cause-specific death according to parental education in the time trend of 1995–1999, 2000–2004, and 2005–2009.
*P value for trend of difference in infant mortality between university and middle school; †P value for trend of difference in infant mortality between university and high school.
Paternal education
0.00 0.20 0.40 0.60 0.80 1.00
1.20
S00-T98
<=Middle school
1 p = 0.0229 2 p = 0.1976
0.00 0.20 0.40 0.60 0.80 1.00 1.20
Infant mortality rate(1/1,000)
P00-P96
1p = 0.0005 2 p = 0.0023
0.00 0.20 0.40 0.60 0.80 1.00
1.20
Q00-Q99
1 p = 0.4007 2 p = 0.1851
0.00 0.20 0.40 0.60 0.80 1.00
1.20
R00-R99
1 p = 0.0029 2 p = 0.0248 Paternal education
1p : p-value for trend of difference in infant mortality between university and middle school
2p : p-value for trend of difference in infant mortality between university and high school
0.00 0.20 0.40 0.60 0.80 1.00
1.20
S00-T98
<=Middle school
1 p = 0.1174 2 p = 0.2670
0.00 0.20 0.40 0.60 0.80 1.00 1.20
Infant mortality rate(1/1,000)
P00-P96
1 p = 0.2006 2 p = 0.3870
0.00 0.20 0.40 0.60 0.80 1.00
1.20
Q00-Q99
1 p = 0.9514 2 p = 0.0704
0.00 0.20 0.40 0.60 0.80 1.00
1.20
R00-R99
1 p = 0.0040 2 p = 0.0994 Maternal education
Fig. 2. Difference in infant mortality of cause-specific death according to parental education in the time trend of 1995-1999, 2000-2004, and 2005-2009.
Infant mortality rate (1/1,000)
1995–... 2000–... 2005–...
1.2 1.0 0.8 0.6 0.4 0.2 0
P00-P96
*P = 0.0005
†P = 0.0023
0.00 0.20 0.40 0.60 0.80 1.00
1.20
S00-T98
<=Middle school
1 p = 0.0229 2 p = 0.1976
0.00 0.20 0.40 0.60 0.80 1.00 1.20
Infant mortality rate(1/1,000)
P00-P96
1p = 0.0005 2 p = 0.0023
0.00 0.20 0.40 0.60 0.80 1.00
1.20
Q00-Q99
1 p = 0.4007 2 p = 0.1851
0.00 0.20 0.40 0.60 0.80 1.00
1.20
R00-R99
1 p = 0.0029 2 p = 0.0248 Paternal education
1p : p-value for trend of difference in infant mortality between university and middle school
2p : p-value for trend of difference in infant mortality between university and high school
0.00 0.20 0.40 0.60 0.80 1.00
1.20
S00-T98
<=Middle school
1 p = 0.1174 2 p = 0.2670
0.00 0.20 0.40 0.60 0.80 1.00 1.20
Infant mortality rate(1/1,000)
P00-P96
1 p = 0.2006 2 p = 0.3870
0.00 0.20 0.40 0.60 0.80 1.00
1.20
Q00-Q99
1 p = 0.9514 2 p = 0.0704
0.00 0.20 0.40 0.60 0.80 1.00
1.20
R00-R99
1 p = 0.0040 2 p = 0.0994 Maternal education
Fig. 2. Difference in infant mortality of cause-specific death according to parental education in the time trend of 1995-1999, 2000-2004, and 2005-2009.
1995–... 2000–... 2005–...
1.2 1.0 0.8 0.6 0.4 0.2 0
Q00-Q99
*P = 0.4007
†P = 0.1851
0.00 0.20 0.40 0.60 0.80 1.00
1.20
S00-T98
<=Middle school
1 p = 0.0229 2 p = 0.1976
0.00 0.20 0.40 0.60 0.80 1.00 1.20
Infant mortality rate(1/1,000)
P00-P96
1p = 0.0005 2 p = 0.0023
0.00 0.20 0.40 0.60 0.80 1.00
1.20
Q00-Q99
1 p = 0.4007 2 p = 0.1851
0.00 0.20 0.40 0.60 0.80 1.00
1.20
R00-R99
1 p = 0.0029 2 p = 0.0248 Paternal education
1p : p-value for trend of difference in infant mortality between university and middle school
2p : p-value for trend of difference in infant mortality between university and high school
0.00 0.20 0.40 0.60 0.80 1.00
1.20
S00-T98
<=Middle school
1 p = 0.1174 2 p = 0.2670
0.00 0.20 0.40 0.60 0.80 1.00 1.20
Infant mortality rate(1/1,000)
P00-P96
1 p = 0.2006 2 p = 0.3870
0.00 0.20 0.40 0.60 0.80 1.00
1.20
Q00-Q99
1 p = 0.9514 2 p = 0.0704
0.00 0.20 0.40 0.60 0.80 1.00
1.20
R00-R99
1 p = 0.0040 2 p = 0.0994 Maternal education
Fig. 2. Difference in infant mortality of cause-specific death according to parental education in the time trend of 1995-1999, 2000-2004, and 2005-2009.
1995–... 2000–... 2005–...
1.2 1.0 0.8 0.6 0.4 0.2 0
R00-R99
*P = 0.0029
†P = 0.0248
0.00 0.20 0.40 0.60 0.80 1.00
1.20
S00-T98
<=Middle school
1 p = 0.0229 2 p = 0.1976
0.00 0.20 0.40 0.60 0.80 1.00 1.20
Infant mortality rate(1/1,000)
P00-P96
1p = 0.0005 2 p = 0.0023
0.00 0.20 0.40 0.60 0.80 1.00
1.20
Q00-Q99
1 p = 0.4007 2 p = 0.1851
0.00 0.20 0.40 0.60 0.80 1.00
1.20
R00-R99
1 p = 0.0029 2 p = 0.0248 Paternal education
1p : p-value for trend of difference in infant mortality between university and middle school
2p : p-value for trend of difference in infant mortality between university and high school
0.00 0.20 0.40 0.60 0.80 1.00
1.20
S00-T98
<=Middle school
1 p = 0.1174 2 p = 0.2670
0.00 0.20 0.40 0.60 0.80 1.00 1.20
Infant mortality rate(1/1,000)
P00-P96
1 p = 0.2006 2 p = 0.3870
0.00 0.20 0.40 0.60 0.80 1.00
1.20
Q00-Q99
1 p = 0.9514 2 p = 0.0704
0.00 0.20 0.40 0.60 0.80 1.00
1.20
R00-R99
1 p = 0.0040 2 p = 0.0994 Maternal education
Fig. 2. Difference in infant mortality of cause-specific death according to parental education in the time trend of 1995-1999, 2000-2004, and 2005-2009.
1995–... 2000–... 2005–...
1.2 1.0 0.8 0.6 0.4 0.2 0
S00-T98
*P = 0.0229
†P = 0.1976
≤ Middle school
0.00 0.20 0.40 0.60 0.80 1.00
1.20
S00-T98
<=Middle school
1 p = 0.0229 2 p = 0.1976
0.00 0.20 0.40 0.60 0.80 1.00 1.20
Infant mortality rate(1/1,000)
P00-P96
1p = 0.0005 2 p = 0.0023
0.00 0.20 0.40 0.60 0.80 1.00
1.20
Q00-Q99
1 p = 0.4007 2 p = 0.1851
0.00 0.20 0.40 0.60 0.80 1.00
1.20
R00-R99
1 p = 0.0029 2 p = 0.0248 Paternal education
1p : p-value for trend of difference in infant mortality between university and middle school
2p : p-value for trend of difference in infant mortality between university and high school
0.00 0.20 0.40 0.60 0.80 1.00
1.20
S00-T98
<=Middle school
1 p = 0.1174 2 p = 0.2670
0.00 0.20 0.40 0.60 0.80 1.00 1.20
Infant mortality rate(1/1,000)
P00-P96
1 p = 0.2006 2 p = 0.3870
0.00 0.20 0.40 0.60 0.80 1.00
1.20
Q00-Q99
1 p = 0.9514 2 p = 0.0704
0.00 0.20 0.40 0.60 0.80 1.00
1.20
R00-R99
1 p = 0.0040 2 p = 0.0994 Maternal education
Fig. 2. Difference in infant mortality of cause-specific death according to parental education in the time trend of 1995-1999, 2000-2004, and 2005-2009.
0.00 0.20 0.40 0.60 0.80 1.00
1.20
S00-T98
<=Middle school
1 p = 0.0229 2 p = 0.1976
0.00 0.20 0.40 0.60 0.80 1.00 1.20
Infant mortality rate(1/1,000)
P00-P96
1p = 0.0005 2 p = 0.0023
0.00 0.20 0.40 0.60 0.80 1.00
1.20
Q00-Q99
1 p = 0.4007 2 p = 0.1851
0.00 0.20 0.40 0.60 0.80 1.00
1.20
R00-R99
1 p = 0.0029 2 p = 0.0248 Paternal education
1p : p-value for trend of difference in infant mortality between university and middle school
2p : p-value for trend of difference in infant mortality between university and high school
0.00 0.20 0.40 0.60 0.80 1.00
1.20
S00-T98
<=Middle school
1 p = 0.1174 2 p = 0.2670
0.00 0.20 0.40 0.60 0.80 1.00 1.20
Infant mortality rate(1/1,000)
P00-P96
1 p = 0.2006 2 p = 0.3870
0.00 0.20 0.40 0.60 0.80 1.00
1.20
Q00-Q99
1 p = 0.9514 2 p = 0.0704
0.00 0.20 0.40 0.60 0.80 1.00
1.20
R00-R99
1 p = 0.0040 2 p = 0.0994 Maternal education
Fig. 2. Difference in infant mortality of cause-specific death according to parental education in the time trend of 1995-1999, 2000-2004, and 2005-2009.
Maternal education
Infant mortality rate (1/1,000)
1995–... 2000–... 2005–...
1.2 1.0 0.8 0.6 0.4 0.2 0
P00-P96
*P = 0.2006
†P = 0.3870
1995–... 2000–... 2005–...
1.2 1.0 0.8 0.6 0.4 0.2 0
Q00-Q99
*P = 0.9514
†P = 0.0704
1995–... 2000–... 2005–...
1.2 1.0 0.8 0.6 0.4 0.2 0
R00-R99
*P = 0.0040
†P = 0.0994
1995–... 2000–... 2005–...
1.2 1.0 0.8 0.6 0.4 0.2 0
S00-T98
*P = 0.1174
†P = 0.2670
≤ Middle school
classified symptoms, signs and findings” (R00–R99) (P < 0.001), and “Injury, poisoning and of external causes” (S00–T98) (P <
0.010) for paternal education (Table 2). For maternal education, this was “Not classified symptoms, signs and findings” (R00–
R99) (P < 0.001), which coincided with the analysis of differ- ence for parental education in infant mortality rate (Table 2).
Cause-specific infant mortality, according to parental employment
The difference in the infant mortality rate for cause-specific deaths
“3-character categories” between infants whose fathers’ employ-
ment was either non-manually active or economically inactive was the largest for “Conditions in perinatal period” (P00–P96) and it increased (P = 0.014). Infant mortality rates for “Condi- tions in perinatal period” (P00–P96) increased over time for in- fants regardless of paternal employment status, whereas infant mortality rates for “Congenital malformations” (Q00–Q99) were found to be decreasing over time for infants regardless of pa- rental employment status. Infants from families whose mothers engaged in manual employment had higher mortality rates than infants with economically inactive mothers (Fig. 3).
The adjusted HR of death for infants with economically inac-
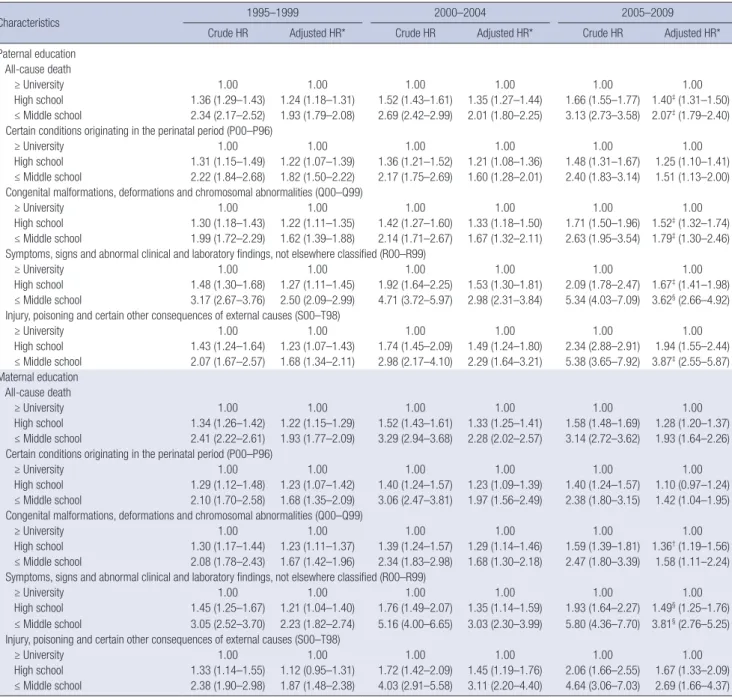
Table 2. Adjusted HRs of cause-specific infant mortality (95% CI) according to parental education in the time trend of 1995–1999, 2000–2004, and 2005–2009
Characteristics 1995–1999 2000–2004 2005–2009
Crude HR Adjusted HR* Crude HR Adjusted HR* Crude HR Adjusted HR*
Paternal education All-cause death
≥ University 1.00 1.00 1.00 1.00 1.00 1.00
High school 1.36 (1.29–1.43) 1.24 (1.18–1.31) 1.52 (1.43–1.61) 1.35 (1.27–1.44) 1.66 (1.55–1.77) 1.40‡ (1.31–1.50) ≤ Middle school 2.34 (2.17–2.52) 1.93 (1.79–2.08) 2.69 (2.42–2.99) 2.01 (1.80–2.25) 3.13 (2.73–3.58) 2.07‡ (1.79–2.40) Certain conditions originating in the perinatal period (P00–P96)
≥ University 1.00 1.00 1.00 1.00 1.00 1.00
High school 1.31 (1.15–1.49) 1.22 (1.07–1.39) 1.36 (1.21–1.52) 1.21 (1.08–1.36) 1.48 (1.31–1.67) 1.25 (1.10–1.41) ≤ Middle school 2.22 (1.84–2.68) 1.82 (1.50–2.22) 2.17 (1.75–2.69) 1.60 (1.28–2.01) 2.40 (1.83–3.14) 1.51 (1.13–2.00) Congenital malformations, deformations and chromosomal abnormalities (Q00–Q99)
≥ University 1.00 1.00 1.00 1.00 1.00 1.00
High school 1.30 (1.18–1.43) 1.22 (1.11–1.35) 1.42 (1.27–1.60) 1.33 (1.18–1.50) 1.71 (1.50–1.96) 1.52‡ (1.32–1.74) ≤ Middle school 1.99 (1.72–2.29) 1.62 (1.39–1.88) 2.14 (1.71–2.67) 1.67 (1.32–2.11) 2.63 (1.95–3.54) 1.79‡ (1.30–2.46) Symptoms, signs and abnormal clinical and laboratory findings, not elsewhere classified (R00–R99)
≥ University 1.00 1.00 1.00 1.00 1.00 1.00
High school 1.48 (1.30–1.68) 1.27 (1.11–1.45) 1.92 (1.64–2.25) 1.53 (1.30–1.81) 2.09 (1.78–2.47) 1.67‡ (1.41–1.98) ≤ Middle school 3.17 (2.67–3.76) 2.50 (2.09–2.99) 4.71 (3.72–5.97) 2.98 (2.31–3.84) 5.34 (4.03–7.09) 3.62§ (2.66–4.92) Injury, poisoning and certain other consequences of external causes (S00–T98)
≥ University 1.00 1.00 1.00 1.00 1.00 1.00
High school 1.43 (1.24–1.64) 1.23 (1.07–1.43) 1.74 (1.45–2.09) 1.49 (1.24–1.80) 2.34 (2.88–2.91) 1.94 (1.55–2.44) ≤ Middle school 2.07 (1.67–2.57) 1.68 (1.34–2.11) 2.98 (2.17–4.10) 2.29 (1.64–3.21) 5.38 (3.65–7.92) 3.87‡ (2.55–5.87) Maternal education
All-cause death
≥ University 1.00 1.00 1.00 1.00 1.00 1.00
High school 1.34 (1.26–1.42) 1.22 (1.15–1.29) 1.52 (1.43–1.61) 1.33 (1.25–1.41) 1.58 (1.48–1.69) 1.28 (1.20–1.37) ≤ Middle school 2.41 (2.22–2.61) 1.93 (1.77–2.09) 3.29 (2.94–3.68) 2.28 (2.02–2.57) 3.14 (2.72–3.62) 1.93 (1.64–2.26) Certain conditions originating in the perinatal period (P00–P96)
≥ University 1.00 1.00 1.00 1.00 1.00 1.00
High school 1.29 (1.12–1.48) 1.23 (1.07–1.42) 1.40 (1.24–1.57) 1.23 (1.09–1.39) 1.40 (1.24–1.57) 1.10 (0.97–1.24) ≤ Middle school 2.10 (1.70–2.58) 1.68 (1.35–2.09) 3.06 (2.47–3.81) 1.97 (1.56–2.49) 2.38 (1.80–3.15) 1.42 (1.04–1.95) Congenital malformations, deformations and chromosomal abnormalities (Q00–Q99)
≥ University 1.00 1.00 1.00 1.00 1.00 1.00
High school 1.30 (1.17–1.44) 1.23 (1.11–1.37) 1.39 (1.24–1.57) 1.29 (1.14–1.46) 1.59 (1.39–1.81) 1.36† (1.19–1.56) ≤ Middle school 2.08 (1.78–2.43) 1.67 (1.42–1.96) 2.34 (1.83–2.98) 1.68 (1.30–2.18) 2.47 (1.80–3.39) 1.58 (1.11–2.24) Symptoms, signs and abnormal clinical and laboratory findings, not elsewhere classified (R00–R99)
≥ University 1.00 1.00 1.00 1.00 1.00 1.00
High school 1.45 (1.25–1.67) 1.21 (1.04–1.40) 1.76 (1.49–2.07) 1.35 (1.14–1.59) 1.93 (1.64–2.27) 1.49§ (1.25–1.76) ≤ Middle school 3.05 (2.52–3.70) 2.23 (1.82–2.74) 5.16 (4.00–6.65) 3.03 (2.30–3.99) 5.80 (4.36–7.70) 3.81§ (2.76–5.25) Injury, poisoning and certain other consequences of external causes (S00–T98)
≥ University 1.00 1.00 1.00 1.00 1.00 1.00
High school 1.33 (1.14–1.55) 1.12 (0.95–1.31) 1.72 (1.42–2.09) 1.45 (1.19–1.76) 2.06 (1.66–2.55) 1.67 (1.33–2.09) ≤ Middle school 2.38 (1.90–2.98) 1.87 (1.48–2.38) 4.03 (2.91–5.58) 3.11 (2.20–4.40) 4.64 (3.06–7.03) 2.69 (1.66–4.37) HR = hazard ratio, CI = confidence interval.
*Adjusted for gender, parents’ age, maternal obstetrical history (parity, the number of children, the number of death among children), gestational age, birth weight; †P value for trend < 0.050; ‡< 0.010; §< 0.001.
1406
http://jkms.org https://doi.org/10.3346/jkms.2017.32.9.1401tive fathers or manually employed mothers was larger for all birth-
year intervals as compared with those whose parental employ- ment was non-manual. The adjusted HR for infants was the larg- est for “Not classified symptoms, signs and findings” (R00–R99) or “Injury, poisoning and of external causes” (S00–T98) in every birth-year interval according to paternal employment, and for
“Not classified symptoms, signs and findings” (R00–R99) accord- ing to maternal employment (Table 3). There was no increasing trend in adjusted HR for parental employment status (Table 3).
Cause-specific infant mortality according to infant’s LBW or PTB
The risk for all-cause infant mortality increased over time for infants with LBW (P < 0.001) or PTB (P = 0.002). The adjusted HR for infants with LBW or PTB was the largest for “Conditions in perinatal period” (P00–P96). The adjusted HR for infants with LBW increased for “Conditions in perinatal period” (P00–P96) (P = 0.022) and “Congenital malformations” (Q00–Q99) (P = 0.019). The adjusted HR for infants with PTB increased for “Con- ditions in perinatal period” (P00–P96) (P = 0.017) and “Injury,
poisoning and of external causes” (S00–T98) (P < 0.001) (not shown).
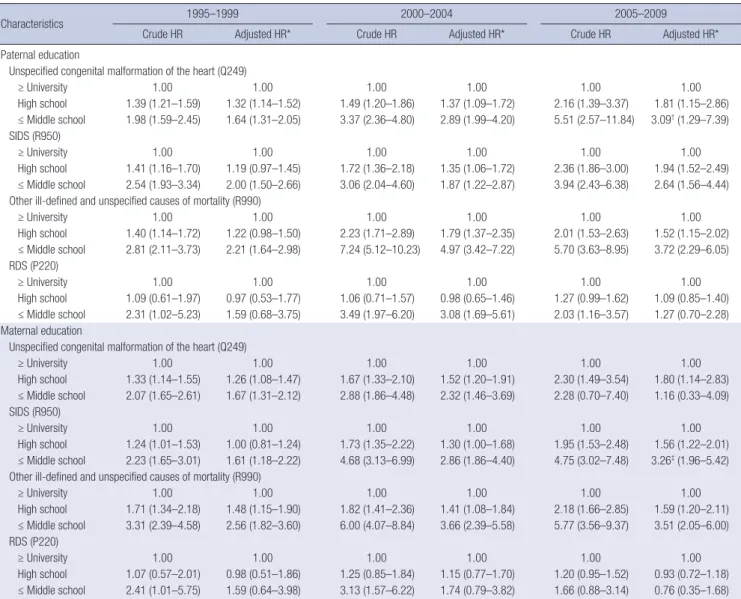
Detailed cause-specific infant mortality, according to parental education
The difference in infant mortality rate for detailed cause-specif- ic death (“4-character categories”) between infants with the highest vs. the lowest parental educational levels was the larg- est for both “Ill-defined and unspecified causes” (R990) and
“SIDS” (R950). It was found to be increasing for “SIDS” (R950) over time (P = 0.018) for infants according to maternal educa- tional level (Fig. 4).
The adjusted HR for “Ill-defined and unspecified causes”
(R990) according to parental educational level was the highest of that of all birth-year intervals (Table 4). The social inequali- ties of infant mortality according to paternal educational level increased over time for “Congenital malformation of the heart”
(Q249) (P < 0.050), possibly due to the very low infant deaths due to “Congenital malformation of the heart” (Q249) in 2005–
2009 for infants whose fathers were the highest-educated; the
0.000.20 0.40 0.60 0.80 1.00 1.20
Infant mortality rate(1/1,000)
P00-P96
0.00 0.20 0.40 0.60 0.80 1.00
1.20
Q00-Q99
0.00 0.20 0.40 0.60 0.80 1.00
1.20
R00-R99
0.00 0.20 0.40 0.60 0.80 1.00
1.20
S00-T98
Inactive Manual Paternal employment
1 p = 0.0144 2 p = 0.0973
1 p = 0.2255 2 p = 0.5423
1 p = 0.2511 2 p = 0.5938
1 p = 0.1127 2 p = 0.7962
1p : p-value for trend of difference in infant mortality between non-manual and inactive
2p : p-value for trend of difference in infant mortality between non-manual and manual 0.00
0.20 0.40 0.60 0.80 1.00 1.20
Infant mortality rate(1/1,000)
P00-P96
0.00 0.20 0.40 0.60 0.80 1.00
1.20
Q00-Q99
0.00 0.20 0.40 0.60 0.80 1.00
1.20
R00-R99
0.00 0.20 0.40 0.60 0.80 1.00
1.20
S00-T98
Inactive Manual Maternal employment
1 p = 0.2022 2 p = 0.4589
1 p = 0.7192 2 p = 0.6869
1 p =0.4526 2 p =0.9745
1 p = 0.4917 2 p = 0.8988
Fig. 3. Difference in infant mortality of cause-specific death according to parental employment in the time trend of 1995- 1999, 2000-2004, and 2005-2009.
0.00 0.20 0.40 0.60 0.80 1.00 1.20
Infant mortality rate(1/1,000)
P00-P96
0.00 0.20 0.40 0.60 0.80 1.00
1.20
Q00-Q99
0.00 0.20 0.40 0.60 0.80 1.00
1.20
R00-R99
0.00 0.20 0.40 0.60 0.80 1.00
1.20
S00-T98
Inactive Manual Paternal employment
1 p = 0.0144 2 p = 0.0973
1 p = 0.2255 2 p = 0.5423
1 p = 0.2511 2 p = 0.5938
1 p = 0.1127 2 p = 0.7962
1p : p-value for trend of difference in infant mortality between non-manual and inactive
2p : p-value for trend of difference in infant mortality between non-manual and manual 0.00
0.20 0.40 0.60 0.80 1.00 1.20
Infant mortality rate(1/1,000)
P00-P96
0.00 0.20 0.40 0.60 0.80 1.00
1.20
Q00-Q99
0.00 0.20 0.40 0.60 0.80 1.00
1.20
R00-R99
0.00 0.20 0.40 0.60 0.80 1.00
1.20
S00-T98
Inactive Manual Maternal employment
1 p = 0.2022 2 p = 0.4589
1 p = 0.7192 2 p = 0.6869
1 p =0.4526 2 p =0.9745
1 p = 0.4917 2 p = 0.8988
Fig. 3. Difference in infant mortality of cause-specific death according to parental employment in the time trend of 1995- 1999, 2000-2004, and 2005-2009.
Fig. 3. Difference in infant mortality of cause-specific death according to parental employment in the time trend of 1995–1999, 2000–2004, and 2005–2009.
*P value for trend of difference in infant mortality between non-manual and inactive; †P value for trend of difference in infant mortality between non-manual and manual.
Paternal employment
Infant mortality rate(1/1,000)
1995–... 2000–... 2005–...
1.2 1.0 0.8 0.6 0.4 0.2 0
P00-P96
*P = 0.0144
†P = 0.0973
1995–... 2000–... 2005–...
1.2 1.0 0.8 0.6 0.4 0.2 0
Q00-Q99
*P = 0.2255
†P = 0.5423
1995–... 2000–... 2005–...
1.2 1.0 0.8 0.6 0.4 0.2 0
R00-R99
*P = 0.2511
†P = 0.5938
1995–... 2000–... 2005–...
1.2 1.0 0.8 0.6 0.4 0.2 0
S00-T98
*P = 0.1127
†P = 0.7962
Inactive Manual
Maternal employment
Infant mortality rate (1/1,000)
1995–... 2000–... 2005–...
1.2 1.0 0.8 0.6 0.4 0.2 0
P00-P96 *P = 0.2022
†P = 0.4589
1995–... 2000–... 2005–...
1.2 1.0 0.8 0.6 0.4 0.2 0
Q00-Q99
*P = 0.7192
†P = 0.6869
1995–... 2000–... 2005–...
1.2 1.0 0.8 0.6 0.4 0.2 0
R00-R99
*P = 0.4526
†P = 0.9745
1995–... 2000–... 2005–...
1.2 1.0 0.8 0.6 0.4 0.2 0
S00-T98
*P = 0.4917
†P = 0.8988
Inactive Manual
adjusted HR according to maternal educational level increased over time for “SIDS” (R950) (P < 0.010) (Table 4).
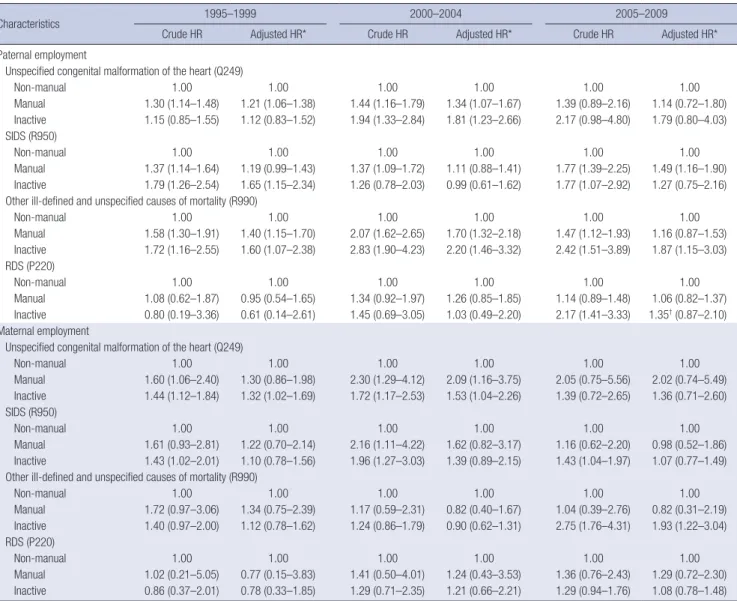
Detailed cause-specific infant mortality, according to parental employment
The difference between the infant mortality rate of the detailed cause-specific deaths “4-character categories” of infants whose father was either non-manually employed or who was econom- ically inactive was the largest for “Ill-defined and unspecified causes” (R990). While differences in the infant mortality rate
according to parental employment were increasing for “RDS”
(P220) (P = 0.041 for paternal employment; P = 0.012 for ma- ternal employment), the crude mortality rates were very low for all parental employment status (Fig. 5).
The adjusted HRs of infants were the highest both for “Ill-de- fined and unspecified causes” (R990) according to paternal em- ployment and for R990 and “Ill-defined and unspecified causes”
(R990) according to maternal employment in every birth-year interval (Table 5). The adjusted HR for “RDS” (P220) increased over time for economically inactive paternal employment sta-
Table 3. Adjusted HRs of cause-specific infant mortality (95% CI) according to parental employment in the time trend of 1995–1999, 2000–2004, and 2005–2009Characteristics 1995–1999 2000–2004 2005–2009
Crude HR Adjusted HR* Crude HR Adjusted HR* Crude HR Adjusted HR*
Paternal employment All-cause death
Non-manual 1.00 1.00 1.00 1.00 1.00 1.00
Manual 1.37 (1.30–1.43) 1.25 (1.19–1.31) 1.39 (1.31–1.47) 1.24 (1.17–1.32) 1.44 (1.35–1.54) 1.28 (1.19–1.37) Inactive 1.38 (1.24–1.53) 1.28 (1.15–1.42) 1.57 (1.40–1.76) 1.36 (1.21–1.53) 1.72 (1.51–1.97) 1.31 (1.14–1.51) Certain conditions originating in the perinatal period (P00–P96)
Non-manual 1.00 1.00 1.00 1.00 1.00 1.00
Manual 1.26 (1.12–1.42) 1.15 (1.02–1.30) 1.27 (1.13–1.43) 1.14 (1.01–1.28) 1.36 (1.20–1.54) 1.23 (1.09–1.40) Inactive 1.37 (1.06–1.78) 1.24 (0.95–1.60) 1.67 (1.36–2.06) 1.33 (1.07–1.64) 1.80 (1.42–2.28) 1.22 (0.95–1.56) Congenital malformations, deformations and chromosomal abnormalities (Q00–Q99)
Non-manual 1.00 1.00 1.00 1.00 1.00 1.00
Manual 1.30 (1.19–1.42) 1.21 (1.10–1.32) 1.25 (1.11–1.41) 1.16 (1.03–1.31) 1.44 (1.26–1.65) 1.31 (1.14–1.50) Inactive 1.24 (1.02–1.51) 1.19 (0.97–1.45) 1.63 (1.32–2.02) 1.54 (1.24–1.92) 1.61 (1.22–2.13) 1.38 (1.04–1.83) Symptoms, signs and abnormal clinical and laboratory findings, not elsewhere classified (R00–R99)
Non-manual 1.00 1.00 1.00 1.00 1.00 1.00
Manual 1.55 (1.37–1.74) 1.35 (1.20–1.53) 1.70 (1.46–1.98) 1.39 (1.19–1.63) 1.68 (1.42–1.98) 1.38 (1.17–1.64) Inactive 1.78 (1.40–2.25) 1.60 (1.25–2.03) 1.90 (1.43–2.51) 1.49 (1.12–1.98) 2.17 (1.59–2.96) 1.60 (1.16–2.20) Injury, poisoning and certain other consequences of external causes (S00–T98)
Non-manual 1.00 1.00 1.00 1.00 1.00 1.00
Manual 1.44 (1.26–1.65) 1.28 (1.12–1.47) 1.82 (1.52–2.18) 1.62 (1.35–1.95) 1.61 (1.29–2.00) 1.36 (1.08–1.70) Inactive 1.44 (1.08–1.92) 1.30 (0.97–1.73) 1.82 (1.29–2.56) 1.54 (1.08–2.19) 2.24 (1.49–3.36) 1.76 (1.16–2.68) Maternal employment
All-cause death
Non-manual 1.00 1.00 1.00 1.00 1.00 1.00
Manual 1.69 (1.47–1.95) 1.43 (1.24–1.65) 1.72 (1.46–2.01) 1.44 (1.22–1.69) 1.42 (1.20–1.67) 1.23 (1.04–1.45) Inactive 1.35 (1.24–1.47) 1.19 (1.09–1.30) 1.44 (1.31–1.59) 1.24 (1.12–1.37) 1.47 (1.34–1.60) 1.22 (1.11–1.34) Certain conditions originating in the perinatal period (P00–P96)
Non-manual 1.00 1.00 1.00 1.00 1.00 1.00
Manual 1.35 (0.93–1.95) 1.17 (0.81–1.69) 1.53 (1.13–2.08) 1.25 (0.92–1.70) 1.28 (0.95–1.73) 1.17 (0.86–1.59) Inactive 1.20 (0.97–1.48) 1.09 (0.88–1.35) 1.25 (1.04–1.50) 1.11 (0.93–1.33) 1.38 (1.18–1.61) 1.18 (1.00–1.39) Congenital malformations, deformations and chromosomal abnormalities (Q00–Q99)
Non-manual 1.00 1.00 1.00 1.00 1.00 1.00
Manual 1.44 (1.09–1.90) 1.22 (0.92–1.62) 1.89 (1.39–2.58) 1.68 (1.23–2.30) 1.50 (1.10–2.06) 1.28 (0.93–1.77) Inactive 1.35 (1.15–1.59) 1.24 (1.05–1.47) 1.48 (1.22–1.80) 1.37 (1.13–1.68) 1.34 (1.13–1.60) 1.16 (0.97–1.39) Symptoms, signs and abnormal clinical and laboratory findings, not elsewhere classified (R00–R99)
Non-manual 1.00 1.00 1.00 1.00 1.00 1.00
Manual 2.13 (1.50–3.03) 1.58 (1.10–2.26) 1.53 (0.98–2.40) 1.13 (0.71–1.77) 1.29 (0.82–2.04) 1.08 (0.69–1.71) Inactive 1.57 (1.25–1.99) 1.24 (0.98–1.57) 1.64 (1.26–2.12) 1.18 (0.91–1.54) 1.82 (1.44–2.30) 1.34 (1.05–1.70) Injury, poisoning and certain other consequences of external causes (S00–T98)
Non-manual 1.00 1.00 1.00 1.00 1.00 1.00
Manual 1.53 (1.04–2.26) 1.28 (0.86–1.90) 1.74 (1.02–2.98) 1.48 (0.86–2.55) 1.30 (0.76–2.24) 1.04 (0.60–1.82) Inactive 1.20 (0.95–1.52) 1.00 (0.79–1.27) 1.86 (1.34–2.57) 1.47 (1.06–2.05) 1.40 (1.05–1.86) 1.04 (0.78–1.40) HR = hazard ratio, CI = confidence interval.
*Adjusted for gender, parents' age, maternal obstetrical history (parity, the number of children, the number of death among children), gestational age, birth weight.