N
umerous Long-term studies of osseointe- grated implants have been carries out with high- ly successful outcomes. The current and the past long-term studies report cumulative success rate of 97% to approximately 80% in less successful re- sults.1,2 If these long-term studies were some- what limited to standard Bra�nemark in the past, they are now no longer limited in implant type,site, bone type, prostheses type and many other variations.3,4These reflect how much implant dentistry have advanced and become a part of rou- tine dental treatment with diverse usage. This state- ment is true in European and North American pop- ulation and all over the world. However these pre- viously reported long-term studies are only found in the population groups stated. Many of these reports have been accepted widely as the gold
LONGITUDINAL CLINICAL STUDY ON THE EFFICACY OF OSSEOINTEGRATED DENTAL
IMPLANTS IN PARTIALLY EDENTULOUS KOREAN PATIENTS : AN 8-YEAR PROSPECTIVE STUDY
Dong-Hoo Han, D.D.S., Ph.D., Hanna Eun-Kyong Bae, B.D.S.
Department of Prosthodontics, Oral Science Research Center, College of Dentistry,
Yonsei University
This study was to evaluate the clinical evidence for the success and the predictability of the osseoin- tegrated dental implants in the partially edentulous Korean patients. 201 patients have received total of 502 Bra�nemark implants, which were restored with either single or multiu- nit fixed superstructures at the Implants Clinic, Yonsei University Dental Hospital. The clin- ical and radiographic evaluations carried out on the patients for maximum 8 years were assessed annually for peri-implant inflammation, implant mobility (PTV), Plaque Index (PI), Gingival Index (GI), Bleeding on Probing (BOP), Keratinized Mucosa width and any changes in the sur- rounding bone level. The radiographs were taken at completion of the restoration, and annually thereafter. On the last recall appointments the patients filled a questionnaire consist of 29 questions in four categories. The cumulative non-failure rate of success was 93.9%. The first year mean bone loss was 0.3mm and less than 0.2mm annually thereafter. The periodontal parameters, keratinized tissue width and periotest values stabilized after initial changes in the first few years. The questionnaire has shown general satisfactory responses in all four aspect of dental implants treatment, including chewing efficacy, comfort, aesthetics and speech. The results support the predictability and success of the long-term rehabilitation of implant sup- ported prostheses in partially edentulous Korean patients.
J Korean Acad Prosthodont : Volume 39, Number 6, 2001
standard in representing the success rate of the im- plants being placed despite the differences in ethnic population. With out any dispute that with differences in the diet, skeletal structures and soft tissue characteristic the effect of stress on the dentition will vary, this implies that stress envi- ronment for the implants replacing the lost den- tition will be also different. Brachychephalic fa- cial skeletal shape of Korean which are in-be- tween Northern Chinese and Japanese have been documented however there are no scientific eval- uation on the bone quality, masticatory habit, dietary differences on the Korean to other Asian population or Caucasian population.5Although the major dietary substances differ to other Asian population clinically it has been known that the highly fibrous Korean diet demands substantial occlusal and lateral forces during function. It is on- ly therefore just to carry out long-term success rate of the implant treatment in Korean patients who represent some difference in oral environment.
To further the clinical evaluation of the implant treatment, a survey was carried out to evaluate a subjective assessment of the treatment by the patients. This was additional evaluation to clin- ical evaluation with strict criteria. The satisfaction which patient feels are the true success to the patients whatever the clinical evaluation would be.
The purpose of this study was to collect objec- tive clinical evidence and subjective evaluation through the questionnaire by the patients, to evaluate success and predictability of osseointe- grated dental implants in partially edentulous
Korean patients.
MATERIALS & METHODS
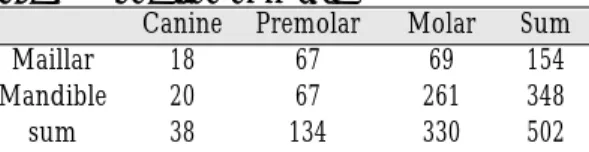
A total of 502 implants were inserted in con- secutive 201 patients at Implant Clinic, Younsei University Dental Hospital from January 1993 until January 2000 accordance to the standards protocol described.28 A single clinician carried out the prosthetic treatment of all patients and the review evaluation was carried out by the same clini- cian and trained doctors to standardize the eval- uation. There was no specific patient selection but have accepted all the patients who were fit to have been treated for partially edentulous ridges on canine and posterior to this site, with Branemark implants. The mean patients age was 45.5 years (between 18 to 68 years) and implant to age dis- tribution is shown in Table Ⅰ. Greater proportion of female 57%(114 patients), was noted. Of 502 implants 154 implants were inserted in maxillar and reaming 348 implants in the mandible. 330 implants were placed in the molar regions. Table
Ⅱ. The reviewed duration of implants were from minimal of one year to 8years in function with prostheses and the average length of the review was 3years. The selected patients underwent last review appointments for clinical and radi- ographical examination between May2000 to April 2001.
Each patients were given a recall appointments on 6monthly for initial two years and then annu- ally thereafter. For a consistent collection of the data only annual review data were collected and
Table Ⅰ. Gender and age distribution
<20 20-35 36-50 51-65 >65 Sum
Female 2 28 51 29 4 114
Male - 19 28 33 7 87
2 47 79 62 11 201
Table Ⅱ. Location of fixture
Canine Premolar Molar Sum
Maillar 18 67 69 154
Mandible 20 67 261 348
sum 38 134 330 502
used. On the day of the connecting superstructures and on each review appointments, clinical eval- uation was made and radiographs were taken of the implants using parallel long-cone technique.
An evaluation form was made and completed at each time. This had lists of clinical observation that was required to make to produce a consistent clin- ical data. The evaluation criteria were modified from that of Albrektsson et al6described in 1986 to include GI, BOP, PI and the width of keratinised tissue was measured on both lingual and buccal of mandibular implants restoration and only on the buccal aspects on the maxilla. The stability was assessed at each appointment by removal of prostheses and used periotest (Siemens AG, Bensheim, Germany). Verbal confirmations on any pain or problems that may have been noticed by the patients were recorded on the evaluation sheet. Any changes in the marginal bone level or presence of peri-implant radiolucencies were noted from standardized radiographs. All the radiographs of all the implants reviewed were scanned and measured for the marginal bone level. The known length in this study was mea- surement of five threads on the implants and longitudinal measurements of both mesial and dis- tal implant margins to bone contact were measured from a reference point, abutment-fixture junction on the implants. The values were then applied to a formula described by Manz7and the level of the bone was measured. To minimize the error of oper- ator, one person carried out all the radiographic measurements. The values were added and divid- ed to obtain the average values.
The questionnaire consisted of 29 questions which can be categorized into four types of ques- tions; comfort, chewing ability, speech and aes- thetics. Details of the questions are as on Table Ⅰ.
Each question answers were divided into five dif- ferent categories in which patients could indicate, as they felt most appropriate.8,9 This enables choice of broad spectrum of answers, and simple
interpretation and analysis of the questionnaire.
Patients attending review clinic from November 2000 until April 2001 completed the question- naire. Table Ⅲ.
RESULTS
Life table
In 8 years 502 implants were placed and reviewed annually of these 15 known failure have been accounted. 6 implants were lost prior to the delivery prosthesis, four in the first year of the delivery prosthesis and five on the second year of delivery as shown on the life table. There were total of 12 failed implants with diameter of 3.75 with greater number with shorter in length.
Table Ⅳ. The proportions of the failed implants were similar in the both mandible and maxilla, 8 and 7 as correspond. During the review one per- son died, representing three implants on the third year. The table Ⅴ shows the cumulative non- failure rate, was 93.9% by the end of 8year review.
Table Ⅲ. Type of questions on Questionnaire
Comfort on prostheses
discomfort intraorally since connection of prostheses episodes of check or tongue bite
altered sensation or facial pain episodes of swellings or infection food impaction
Aesthetics
able to smile and face public self-confidence with appearance
satisfaction with colouration and shape of prostheses Speech
difficulties in pronunciation and specific examples in Korean
Chewing
satisfaction with ability to chew food in general ability to chew specific foods 8 examples
Table Ⅴ. Life Table Presentaion of Reviewed Patients failure
No.implant not yet Drop (with only Annual Annual cumula-
at Start elapsed out failure/with deceased failure non failure tive non
(no. (no. (no. surviving rate(%) rate(%) failure
patient) patient) patient) implants) rate(%)
year 502
Abutment
connection 496(193) 6(2/4) 1.2 98.8 98.8
1 394(161) 97(30) 4(2/2) 1 99 98
2 261(107) 51(21) 77(32) 5(0/5) 1.9 98.1 97.7
3 139(56) 104(38) 18(12) 3(0/ 1)drceased 100 95.7
4 73(32) 56(20) 10(4) 100 95
5 45(19) 20(9) 8(4) 100 94.6
6 26(10) 14(9) 5(3) 100 94.3
7 11(4) 13(5) 2(1) 100 94
8 7(2) 4(1) 100 93.9
When closer examination was made, the table reveals a large proportion of the drop out as patients failed to attend the review clinics despite efforts from the Implants clinic and only 56%
implants were regularly followed up on the review clinics.
Mild complications
During the clinical review, mild complications were observed. On removal of the prostheses routinely, there was 36 cases of screw loosen- ing could have been observed with greater num- ber of occurrence in the multi- united prostheses than the single restoration. In the first and second Table Ⅳ. Diameter and length of failed implant
3.75*10 4 5.00*10 1 Lower posterior 8 3.75*13 4 5.00*13 2
3.75*15 3 upper posterior 7
3.75*20 1
Table Ⅵ. Mild complications reported during the follow-up period
Type of complication Del. 1st yr 2nd yr 3rd yr 4th yr 5th yr 6th yr 7th yr Screw loosening 12 (ms:9/mc:3) 11 (ms) 11 (ss:1/ms:10) 1 (sc) 1 (ms)
Screw bending 1 (ss) 2 (ms)
Screw fracture 1 (ms)
Fixture fracture 1 (ms)
Porcelain or resin fracture 4 (ms:3/sc:1) 2 (ms) 1 (ms) 2 (ms) 1 (ms) 1 (ms)
Cement washout 1 (sc)
Infection 1 (ms) 1 (ms) 1 (sc)
Adverse psychological reaction 3 (ms) ss : single screw type sc : single cement type ms : multiple unit screw type mc : multiple unit cement type
year, bent screws were observed, single episode of screw fracture on the fifth year and fracture of superstructures in every year except on the fifth year. There were episodes of gingival infections and adverse psychological reaction by patient representing three implants to implant treat- ments. Through out the review period no serious complications such as anesthesia, parathesia, and alteration of facial sensation or facial pain were reported. Table Ⅵ.
Soft tissue evaluations
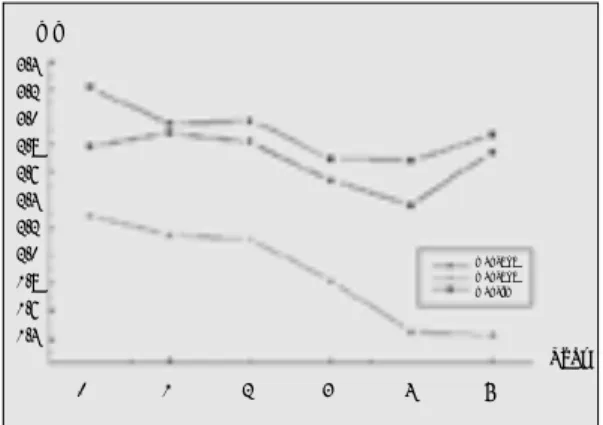
Measurement to evaluate soft tissue health, GI, PI, BOP and widthness of keratinized mucosa contiguous to the implants were made. The GI, PI, and BOP values increased slightly in the first three years from 0.08 to 0.13 in GI, 0.45 to 0.66 in PI and 0.45 to 0.54in BOP. All three indices had a large standard deviation but it remained con- stant in values. As graphs indicate the lower values of the first year deteriorates in the fol- lowing years. This could be found in all three indices. (Fig. 1) The keratinized tissue width- ness changes were also represented as graph.
(Fig. 2) The largest average value was at lingual of mandible and the lowest was at buccal of mandible at initial examination. Generally the largest in each area was at the first measure-
ment, connection of superstructure and they were 2.78, 2.28 and 3.21 on buccal side of maxil- la, buccal side of mandible and lingual side of mandible respectively. This shows a general trend in reduction in the keratinized tissue width- ness with increase in duration since connection of superstructure.
Stability Test
The tooth mobility in this clinical study was car- ried out in all the implants review and at every recall appointments. The average value of the peri- otest at delivery of superstructure was -4.51±2.61.
There was linear decrease in PTV to -5.49±2.61 at the third year and stabilized at this value for the remaining duration of review with little deviation.
(Fig. 3) The changes in the values were statistically tested using paired t-test. The first and second year values were p=0.00 and p=0.01 respectively and they were statistically significant. On the third and fourth year the values were p=0.55 and 0.39 and they were statistically not significant.
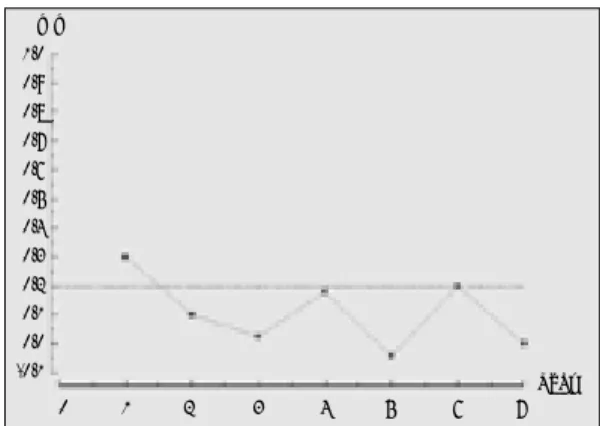
Radiographic evaluation
The result of averaged values of each year of review was represented on the graph. (Fig.4) On the first year the mean marginal bone loss was 0.3 ±0.08mm On the following years the average
Fig. 1. Annual changes of indices Fig. 2.Annual changes the width of keratinized tissue width
mm
Year
0 1 2 3 4 5
3.4 3.2 3.0 2.8 2.6 2.4 2.2 2.0 1.8 1.6 1.4 mm/length
Gingival Index Plaque Index Bleeding Index
man_buc man_buc man_lin
Year
1 2 3 4 5 6 7 8
1.0 0.9 0.8 0.7 0.6 0.5 0.4 0.3 0.2 0.1 0.0 3.0
annual marginal bone loss were less than 0.2mm.
The values were 0.1±0.07mm , 0.025±0.05mm and 0.18±0.13mm on the second, third year and fourth year of marginal bone losses. However all the values were statistically insignificant. The reliability on the values after fifth year is ques- tionable as the sample size is too small to repre- sent the values.
Four Field Table
All the results of both soft tissue evaluation, clin- ical complication, stability test and the radi- ographical evaluation of each implants over the reviewed period were cumulated together and each implant was classified in three grades of suc- cess, survival, failure and unaccounted. Each Category is based on the classification described by the Roos et al.10)however for the stability test, PTV was used in place of the manual mobility test and any zero or negative value was used as acceptable in this evaluation for grade 1 in mobil- ity test. This is represented on the Four Field
Table. Table ⅤⅡ. Unlike the values of Roos et al, most of the implants were tested for stability and there was less number of the implants in the second category of success. This has shown that 46.2% of the implants were success but as described earlier large proportion of the implants,43.2%
were unaccounted for and 7.6% were surviving and 3% represented by failed implants.
Survey
The Questionnaire filled by the patients does not represent all the patients who were reviewed on regular recall appointments. However, lat- ter six month of the reviewed patients were all asked to fill the questionnaire and the results were grouped into four types of questions and were represented as charts. Full 100% satisfaction was noted in the speech(Fig. 5) but as the restora- tions were mainly on the posterior area, the patients may have noted a little difference. The comfort, aesthetics(Fig. 12) and chewing ability were all favored for the implant treatment. In eval- uation of comfort(Fig. 6), 87% of patients felt excellent or good were comfortable with prosthesis but approximately 3% of patients felt uncom- fortable. In specific to food impaction, 21%
claimed of no discomfort or history from food impaction, 41% had acceptable food impaction but 38% had heavy food impaction. The chewing Fig. 3. Annual changes in periotest values Fig. 4. Annual changes in marginal bone loss
Table Ⅶ. Four Field Table
Success grade1&2 unaccounted for
46%(n=232) 46%(n=232)
Surviving Failure
7.5%(n=38) 3%(n=15)
mm
Year
0 1 2 3 4 5 6 7
1.0 0.9 0.8 0.7 0.6 0.5 0.4 0.3 0.2 0.1 0.0 -0.1 PTV
Dellvery
1 2 3 4 5 6 7 8 Year
0 -1 -2 -3 -4 -5 -6 -7 -8
ability(Fig. 7) represents sum of responses of all the eight different types of Korean food where each food had different texture and hardness. On the
specific food type, even when the food is highly demanding on masticatory function and force where the patients have been advised not to
Fig. 5. Speech Fig. 6. Comfort of Prosthesis
Fig. 7. Chewing Ability Fig. 8.ChewingAbility on Specific Food(Kimche-veg-
itable)
Fig. 9. Chewing Ability o Specific Food(Dried Squid) Fig. 10. Chewing Ability on Specific Food(peanut)
0% 10% 2%
6%
81%
32% 10% 2%
2%
86%
18%
3%
39%
52% 0%4%
20%
76%
0%
23%
2%
21% 2%
8%
100%
normal sound distorted sound
excellent good acceptable difficult very difficult
excellent good acceptable difficult very difficult excellent good acceptable difficult very difficult excellent good acceptable difficult very difficult
excellent good acceptable
uncomfortable very uncomfortable
chew such as dried squid fish, the patients still had these food and found improvements in chew- ing.(Fig. 8�11) On specific food responses more than half of the patients were excellent or good masticatory function. The highest satisfaction on chewing was with Kimche, a vegetable dish, with 88% good or excellent chewing and lowest with 54% in dried squid fish.
DISCUSSION
Numerous authors have documented longitu- dinal studies in the implant treatments and rep- resentation of the information in each study may not be consistent with others to make a healthy comparison and to obtain scientific information.
Guide to this field of science could be taken from several literatures. The American Dental Association describes clinical, radiographical and patient parameter should be combined in eval- uation. Albrektsson 199811states that for a correct scientific reports one should have a good sample size of minimum 50 implants and advisable to car- ried out in a multi-center studies with a supervisor to sustain a constant evaluation standard in each centers. The article addresses the limitation of use in lifetime table. This can misrepresent the success rate in a cumulative non-failure rate, which in truth is a survival rate rather than a success rate. To jus-
tify an implant for a success it should be examined in strict success criteria and often this is not car- ried out.
This study is carried out in a single -center with one operator to deliver the prostheses. This obviously has advantage in producing a con- stant standard but has limitation in that the bias of single operator and center is present in the study.
After healing of the surgical procedure, the biological seal will form around the neck of the implants, that of functional epithelium, 1-1.5mm and connective tissue region which is superior to alveolar bone, 1.5-2mm12 The health of marginal gingival ultimately affects the marginal bone level and prognosis of implant.13 The criteria used in this study was based on those described by Albrektsson 19866, but elaborated further by car- rying out detailed examination of gingival using GI, PI and BOP evaluation on each implant.
Behneke et al14have stated that there was no soft tissue parameter correlated with prognosis of implants. Severe inflammatory observations have not been observed on the previous journals.
Although the changes in the gingival indices have deteriorated after first three years, this may have been influenced by the patients’own lack of oral hygiene care rather than any other factors and in a shorter period, similar observation of increase in soft tissue indices were observed in Behneke.
The Plaque formation around the implants can be affected by the implant surface type and pros- thesis. Remandini et al15showed that in 24 hours there was significantly high proportion of plaque adhesion but Quirynen16 indicated that after third month, there was little variation in the composition of the microorganisms.
Keratinized gingival thickness was also evalu- ated. With keratinized tissue, the values have grad- ually decreased. Although the value of mandibu- lar buccal area was less than other sites the rates were similar on all the sites. The increase in the val- Fig. 11. Aesthetics
64%
8%
28%
excellent acceptable dissatisfied
ues after third year may be invalid as the sample size is small.
In Osseointegration of implants the bone under- goes three different stages; formation of woven bone, adaptation of lamellar and parallel fibered bone deposition and finally functional adaptation which continues for the rest of life.17The latter, the dynamic modeling of the bone allows the main- tenance of implants in long term through com- munication with osteocytes and osteoblasts in response to changes in the environment especially the masticatory force.12The degree of true osseoin- tegration cannot be physically measured without histological evaluation. This is not feasible in patients and stability test and radiographic exam- ination are often used in substitute. Other meth- ods also have been described with varying in its accuracy.
The stability test in Albrektsson11has measured macro-movements when the inter-observer var- ied greatly reducing its reproducibility. There have been journals, which voices stability test using periotest is inappropriate due to its inac- curacy. This has been disputed with more quan- tifiable method of detecting stability, especially in a long-term study with its high repeatability.18In this study PTV have been used in evaluating and the values of the PTV becomes gradually more negative. Which is similar to that of Behneke.14 However, a correct orientation of the instrument is vital in its accurate measurements.19As the implants functionally adapted, in gross term ankylosis to alveolar bone and its bone remodeling over years may have been represented as greater osseoinetgration.20,25In PTV with increase in the osseointegration the value is more negative as the duration of the contact between the restoration and the periotest tip is short thus more negative in its value. Therefore may indicate degree of success of the implant osseointegration.
The radiographic examination and measurements were as represented on the graph. It would seem
that the result of first three years are again more true representative of the implants due to the sample size. The first few years have shown a grad- ual decrease in the values of bone loss. In a detailed examination of the each value, the increase in the marginal bone loss values in two occasions fourth and sixth year were from single implant with increased bone loss in a small sam- ple size which therefore have been affected by the value greatly. Meijier21has stated a large standard deviation with its best accurate method, use of slid- ing gauge. Which has been also reflected in this study. The explanation of difficulties in determining accurate level of marginal bone around the implants was given. Benn on the other hand does not account any of currently available meth- ods were sensitive enough to measure bone changes less than 1 mm. The most recommend- ed effort however stands with standardized radi- ographic technique and use of large sample size.
The result however was within the limits of suc- cess criteria of Albrektsson.
It is known that the marginal bone level changes prior to and after connection of superstructure. This has bee noted that the changes are not only in the vertical direction and others have measured hor- izontal and area of bone loss.27Due to this loss in the bone the soft tissue can be affected and the interpapillary tissue quantity and quality can changes depending on the support. This can be reflected on the survey response to food impaction.
In soft tissue evaluation Behneke14disputed this but many others states otherwise. Therefore it would have been interesting to review the changes in food impaction against time, interdental space and type of structure adjacent to the implants, whether it is natural dentition or implants.
As described by Albrektsson 1998, the true success criteria of implants require a through evaluation of the implants must be made and each implants classified for its success or failure. Buser et al22when applied the lifetime table in a large
sample size a successful interpretation of the information could be achieved. However a lifetime table can often be misleading and even in our study over 90% of cumulative survival rate has been obtained with high level of unaccounted patients.
To produce data for four field table, each implant evaluation of soft tissue, discomfort and radi- ographs were made the each implant evalua- tion over the review periods were summoned together for classification as done in Roos et al.10 In the evaluation of the other studies final restora- tions were rarely removed and tested for its mobility or stability. There was small quantity of class 2 implants and the success rate of 46.2%. It is great misfortune to have such a high level of incompliance, which, is a characteristic of Korean dental patients regarding follow up appoint- ments. It must be emphasized that these patients attending the University Dental Hospital may be more dentally aware than average population and with additional effort from staff members of implant clinic have achieved 57% recall rate.
This is an inadequate for a healthy reference to suc- cess of implants but this can act as guiding point to future studies with larger sample size, differ- ent implant system and higher proportion of patient attendance for recall appointments.
Patient satisfaction of osseointegrated dental implants have been studied and reported in the past with a positive responses and substantial improvements on the function and well being of patients were noted.23,24,26 In the current study, high patient satisfaction level corresponded with results of other studies despite the differences in many dietary and anatomical variations. Detailed patient information collected in the Clancy et al23indicated significance of patient expectation and lack of discomfort to patient satisfaction level. In Zarb et al24, only verbal confirmation was made and recorded. However this study has carried out detailed investigation in the mas- ticatory function and the satisfaction level which
was in favourable outcome even with the most demanding environments.
CONCLUSION
The objective clinical result of this prospective longitudinal clinical study and responses of ques- tionnaire of partially edentulous Korean patients treated with implant-supported prostheses indi- cate a favorable outcome.
The cumulative non-failure rate was 97% how- ever, the four field tables shows that the suc- cess in implants were 46.2% in 8 years of review, as there was high proportion of unaccounted patients in this prospective study.
Patient satisfaction rate obtained from the ques- tionnaire indicate general satisfaction with implant treatment.
This investigation was supported in part by Yonsei University Research Fund of 2001.
REFERENCE
1. Friberg B, Nilson H, Palmquist C. MKII: the self- tapping Bra�nemark implant: 5-year results of a prospective 3-centre study Clin Oral Impl Res 1997;8:279-285.
2. Becker W, Becker B E, Abdulaziz Alsuwyed, Sultan Al-Mubarak. Long-term evaluation of 282 implants in maxillary and mandibular molar po- sitions: a prospective study. J Periodontol 1999;70:896-901.
3. Lekholm U, Gunne J, Herny P et al Survival of the Bra�nemark implants in partially edntulous jaws: A 10-year prospective multi-center study Int J Oal Maxillo Implants 1999;14:639-645.
4. Jemt T, Lekholm U. Oral implant treatment in posterior partially edentulous jaws: a 5-year follow- up report. Int J Oral Maxillofac Implants 1993;8:635- 640.
5. Koh K S, Shon H J, Rhee E K etal Anthropological study on the facial flatness of Korean from the- historic to themodern period Korean J Phyical Anthrop 1999;12:211-221.
6. Albrektsson T, Zarb G, et al The long-term efficacy od currently used dental implants: A review and proposed criteria of success Int J Oal Maxillo Implants 1986;1:11-25.
7. Manz MC. Radiographi assessment of peri im- plnat verticla bone loss: DICRG imterm report
no.9 J Oal Maxillofac Surg 1997;55:62-71.
8. Kent G, Jhons R. A controlled longitudional study on the psycholigical effects of osseoitegerated dental iImplants Int J Oal Maxillo Implants 1991;6:470-474.
9. Goldberg D P, Rickels K, Downing R, Hesbacher P. A comparison of two psychiatric screening test. Brit. J. Psychiat 1976;129:61-7.
10. Roos J, Lekholm U, Jemt T, Grondahl K, Albrektsson T. A qualitative and quantitive method for eval- uating implant success: A 5-year retrospective analysis of the Bra�nemark implant. Int J Oral Maxillofacial implant 1997;12:504-14.
11. Albrektsson T, Zarb G A. Determinants of correct clinical reporting. Int J Prosthodontics 1998;11:517- 21.
12. Stanford C M. Biomechanical andfunctional be- haviour of implants Adv Dent Res 1999;13:88-92.
13. Adell R, Lekholm U, Rockler B, Bra�nemark PI A 15- year study of osseointegrated implants in the treatment of the edentulous jaw. Int J Oral Surg 1981;10:387-416.
14. Behneke A, Behneke N, d’Hoelt B, Wagner W Hard and soft tissue reactions to ITI screw implants:
3- Year Longitudinal Results of a Prospective Study Int J Oal Maxillo Implants 1997;12: 749- 757.
15. Rimondini L, Fare S, et al The effect of surface rough- ness on early in vivo plaque colonisation on tita- nium. J Periodontol 1997;68:556-562.
16. Quirynen M, Bollen CM et al The influence of ti- tanium abutment surface roughness on plaque accumulation andgingivitis: short-term observa- tions. Int J Oral Maxillofac Implants 1996;11:169- 178.
17. Schenk R, Buser D. Osseointegration: a reality Periodontology 2000 1998;17:22-35.
18. Truhlar R S, Lauciello F, Morris H F, Ochi S. The influence of bone quality on periotest values of en- dosseous dental impalnts at Stage II /surgery J Oal Maxillofac Surg 1997, Suppl 5; 55:55-61.
19. Chavez H, Ortman L F, DeFranco R L, Medige J Assessment of oral impalnt mobility J Prosthet
Dent 1993;70:421-6.
20. Drago C J. A prospective study to assess os- seointegration of dental endosseous implants with the periotest instrument Int J Oal Maxillo Implants 2000;15:389-395.
21. Meijer H A, Steen W H A, Bosman F A comparison of methods to assess marginal bone height around endosseous implants J Clin Periodontol 1993;20:250- 253.
22. Buser D, Mericske-Stern R, Bernard JP, Behneke N et al Long-term evaluation of non-submerged ITI implants Part 1; 8-year life table analysis of a prospective multi-center study with 2359 im- plnats. Clin Oral Impl Res 1997;8:161-172.
23. Clancy J M S, Buchs A U, Homayoun A. A ret- rospective analysis of one implant system in an oral surgery practive. Phase I: Patient satisfaction. J Prosthet Dent 1991;65:265-71.
24. Zarb GA The longitudinal clinical effectiveness of osseointegrated dental implants indental implants in posterior edentulous ptients Int J Prosthodont 1993;6:189-196.
25. Olive J, Aparicio C The periotest methood as a mea- sure of osseointegrated oral impalnt stability Int J Oral Maxillofacial implant 1990;5:390-400.
26. Ekfeldt A, Carlsson G E, Borjesson G. Clinical evaluation of single-tooth restorations supported by osseointergrated implants: a retrospective study. Int J Oral Maxillofac implants 1994;9:179-183.
27. Tarnow D P, Cho S C, Wallace S S. The effect if in- ter-implant distance on the height of inter-im- plant bone crest J Periodontol 2000;71:546-549.
28. Lekholm U. Clinical procedures for treatment with osseointegrated dental implants J Prosthet Dent 1983;50:116-120.
Reprint request to:
DR.DONG-HOOHAN
DEPT. OFPROSTHODONTICS, ORALSCIENCERESEARCHCENTER,COLLEGE
OFDENTISTRY, YONSEIUNIVERSITY
134, SHINCHON-DONG,SEODAEMOON-GU,SEOUL,120-095, KOREA Tel: 82-2-361-8940 Fax: 82-2-312-3598
E-mail: [email protected]