https://doi.org/10.4174/astr.2021.100.1.8 Annals of Surgical Treatment and Research
Are the elderly patient’s changes in the health-related quality of life one year after gastrectomy for stomach cancer different from those in young patients?
Dong-Seok Han1, Jaeil Ahn2, Hye Seong Ahn1
1Department of Surgery, SMG-SNU Boramae Medical Center, Seoul, Korea
2Department of Biostatistics, Bioinformatics, and Biomathematics, Georgetown University, Washington DC, USA
INTRODUCTION
The number of elderly patients who underwent gastrectomy increased recently. This trend will be continued because life expectancy has been improved and the proportion of elderly patients is predicted to grow. In Korea, the proportion of elderly patients aged more than 70 years was continuously increased
from 9.1% in 1995 to 25.3% in 2014 according to the Information Committee of the Korean Gastric Cancer Association [1]. The Surveillance, Epidemiology, and End Results (SEER) database in the United States also shzowed that elderly patients aged 80 years and more increased from 11.7% in period 1988–2003 to 13.1% in period 2004–2010 [2].
Although old age currently is not considered as an absolute
Received October 15, 2020, Revised October 19, 2020, Accepted October 19, 2020
Corresponding Author: Hye Seong Ahn
Department of Surgery, SMG-SNU Boramae Medical Center, 20 Boramae- ro 5-gil, Dongjak-gu, Seoul 07061, Korea
Tel: +82-2-870-2276, Fax: +82-2-831-2826 E-mail: comette@snu.ac.kr
ORCID: https://orcid.org/0000-0001-6853-7793
Copyright ⓒ 2021, the Korean Surgical Society
cc Annals of Surgical Treatment and Research is an Open Access Journal. All articles are distributed under the terms of the Creative Commons Attribution Non- Commercial License (http://creativecommons.org/licenses/by-nc/4.0/) which permits unrestricted non-commercial use, distribution, and reproduction in any medium, provided the original work is properly cited.
Purpose: Gastrectomy for elderly patients can significantly deteriorate the health-related quality of life (HRQoL). There was no report comparing HRQoL of elderly patients with young patients after gastrectomy for gastric cancer. This study assessed the differences in the changes of HRQoL at one year after gastrectomy according to age.
Methods: From May 2014 to Feb 2016, we prospectively enrolled patients undergoing gastrectomy for gastric cancer. They completed the European Organization for Research and Treatment of Cancer and gastric questionnaires preoperatively and at postoperative 1, 3, 6, 9, and 12 months.
Results: We included 57 elderly patients (≥70 years old) and 74 younger patients. The elderly had similar demographic, surgical, and pathological characteristics with young patients except that elderly had more comorbidity, laparoscopic gastrectomies, and lesser postoperative chemotherapy. One month after gastrectomy, the score of global health status/
quality of life, physical, role, and social functioning were significantly impaired in elderly patients. Among them, physical and role functioning were more impaired than those of young patients. The scores of physical functioning, role functioning, cognitive functioning, and social functioning were not fully recovered till 1 year after surgery. There was a significant age group difference in the changes in physical function over the 1-year follow-up.
Conclusion: Elderly patients’ global health status/quality of life and social functioning significantly decreased at postoperative 1 month and recovered by 6 months after gastrectomy. There was a significant age-specific difference in physical functioning throughout the 1-year follow-up. Surgeons need to pay more attention to recovery of the elderly patients’ HRQoL after gastrectomy.
[Ann Surg Treat Res 2021;100(1):8-17]
Key Words: Elderly patients, Gastrectomy, Gastric cancer, Quality of life
contraindication to surgery for gastric cancer, postoperative morbidity and mortality in elderly patients were usually reported as higher than younger patients [3,4]. Gastrectomy can significantly deteriorate the health-related (HR) quality of life (QoL) [5-8]. As for surgical outcomes, there were many reports about morbidity, mortality, and survival rate. However, there were few studies about HRQoL in elderly patients.
The purposes of this study were to analyze the changes of the HRQoL in elderly patients who were 70 years old or elder according to the periods (preoperative day, postoperative 1, 3, 6, 9, and 12 months) and to compare them with those of young patients.
METHODS
Patients
From May 2014 to February 2016, we prospectively enrolled patients undergoing gastrectomy. They were asked to complete the HRQoL questionnaires preoperatively and at 5 postoperative intervals up to 1 year (postoperative 1, 3, 6, 9, and 12 months). Patients who postoperatively completed at least 2 questionnaires were included and patients with (1) combined resection except for cholecystectomy and splenectomy, (2) previous or combined malignancies, or (3) neurologic or psychological conditions disable to answer the questionnaires were excluded. This study was approved by Institutional Review Board of SMG-SNU Boramae Medical Center (No. 16-2014-127) and the written informed consent was obtained.
Surgery
All patients underwent surgery first according to Korean Practice Guideline for Gastric Cancer if the tumor is outside of the indication for endoscopic resection or and ≥cT1b or cN+ and M0 gastric cancer [9] and upfront surgery is standard treatment for gastric cancer in Korea. Considering the location and clinical stage of tumor and the length of resectional margin, distal gastrectomy/pylorus-preserving gastrectomy or total gastrectomy was done. Reconstruction was performed with Billroth I or II gastrojejunostomy after distal gastrectomy, and Roux-en-Y esophagojejunostomy after total gastrectomy. D1+
lymphadenectomy and D2 lymphadenectomy were performed for early gastric cancer patients and advanced gastric cancer patients, respectively. Laparoscopic gastrectomy was performed if the tumor was not advanced.
After surgery, patients were placed on a diet program that included drinking water on the 3rd postoperative day, followed by a liquid and soft diet. Patients were planned to be discharged on the 7th day, postoperatively.
Health-related quality of life assessment
European Organization for Research and Treatment of Cancer (EORTC) Quality of Life Questionnaires (QLQ). It consisted of the general module, the EORTC QLQ-C30, and the gastric cancer-specific module, the EORTC QLQ-STO22 [10-12]. The EORTC QLQ-C30 included 30 questions; a global health status/
QoL scale, 5 functional scales (physical, role, emotional, cognitive, and social), and 9 symptoms scales/items (fatigue, nausea and vomiting, pain, dyspnea, insomnia, appetite loss, constipation, diarrhea, and financial difficulties). The EORTC QLQ-STO22 is a supplement to the QLQ-C30 and is including 22 questions evaluating 9 symptom scales/items (dysphasia, chest and abdominal pain, reflux, eating restriction, dry mouth, taste, body image, anxiety, and hair loss).
The preoperative HRQoL assessment was performed when patients were hospitalized for surgery; alternatively, the postoperative HRQoL assessment was performed at the outpatient department. For global QoL and the functional scales, a higher score indicates better HRQoL, with 100 being perfect. For symptom scales, a lower score indicates better HRQoL, with 0 being perfect or no symptoms reported.
Statistics
Demographic and clinical parameters of both age groups (70 years or older vs. 69 years or younger) were summarized using mean ± standard deviation for continuous variables and frequency (percentage) for categorical variables. The differences in the continuous variables were compared using 2-sample t-test and/or Wilcoxon rank-sum test and Pearson chi-square tests, and exact binomial tests were used to compare the distributions in categorical variables. Normal quantile-quantile plots were examined for checking normality of HRQoL assessment.
For comparison between the age groups at each time point, 2-sample t-test were used. For comparison between adjacent time points, 2-sample t-tests were conducted. To account for within-individual correlations, mixed-effects models were fitted for each of 24 HRQoL outcomes adjusting for age, sex, extent of gastrectomy (partial or whole), minimal invasive gastrectomy (open or laparoscopic gastrectomy), TNM stage, postoperative chemotherapy, time, time2, and age × time2, respectively.
To address missing data due to dropouts, we also explored last-observation carried forward approach (LOCF) and the inverse probability weight (IPW) [13]. A 2-sided P-value of <0.05 was considered statistically significant. For statistical analysis, the R program package (R Foundation for Statistical Computing, Vienna, Austria; http://www.r-project.org) and IBM SPSS Statistics ver. 23 (IBM Corp., Armonk, NY, USA) was used.
RESULTS
Patients
Table 1. Patients’ demographic, surgical, and tumor characteristics
Characteristic Elderly group (n = 57) Young group (n = 74) P-value
Age (yr) 75.5 ± 4.4 56.2 ± 9.1 <0.001
Sex
Male 41 (71.9) 51 (68.9) 0.847
Female 16 (28.1) 23 (31.1)
Body mass index (kg/m2) 23.5 ± 3.5 23.5 ± 2.9 0.919
Comorbidity (+) 43 (75.4) 38 (54.4) 0.005
Pulmonary disease 7 (12.3) 1 (1.4) 0.010
Laparoscopy 49 (86.0) 54 (73.0) 0.072
Operation extent
Distal 46 (80.7) 56 (75.7) 0.492
Total 11 (19.3) 18 (24.3)
Anastomosis, BI/BII/Roux-enY 11/35/11 27/26/18 0.013
No. of retrieved LN 39.4 ± 15.7 40.5 ± 14.3 0.692
Operation time (min) 172.0 ± 29.7 166.7 ± 38.5 0.623
TNM stage
T1 37 (64.9) 48 (64.9) 0.526
N0 38 (66.7) 50 (67.6) 0.913
M0 54 (94.7) 73 (98.6) 0.317
TNM stage according to AJCC 7th edition
I 40 (70.2) 47 (63.5) 0.365
II 6 (10.5) 13 (17.6)
III 8 (14.0) 13 (17.6)
IV 3 (5.3) 1 (1.4)
Hospital stay day 10.2 ± 9.2 8.0 ± 1.9 0.050
Morbidity in 30 day 16 (28.1) 16 (21.6) 0.394
Mortality in 30 day 0 (0) 0 (0)
Reoperation 0 (0) 0 (0)
Postoperative chemotherapy 10 (17.5) 24 (32.4) 0.054
Recurrence within 1 yr 5 (8.8) 4 (5.4) 0.502
Death within 1 yr 1 (1.8) 1 (1.4) 0.852
Values are presented as mean ± standard deviation or number (%).
BI, Billroth I; BII, Billroth II; LN, lymph node; AJCC, American Joint Committee on Cancer.
Screened 252 (May 2014 2016)
Consented: 149
Eligible: 144 Excluded: 5 (unresected)
Included in analysis (2 or more follow-up): 131
Less than 2 follow-up: 13 - Death: 1
- Follow-up loss: 12
Complete follow-up and answer: 78 Incomplete follow-up or refusal: 53 - Death: 2
- Follow-up loss or incomplete answer: 51
Fig. 1. Patients’ registration.
and finally 57 elderly patients (≥70 years old) and 74 younger patients were included (Fig. 1).
Patients’ characteristics were summarized in Table 1.
The elderly patients had similar demographic, surgical, and pathological characteristics with young patients while the elderly had more comorbidity (P = 0.005), especially pulmonary disease (P = 0.010). The elderly patients tend to have more laparoscopic surgery, Billroth II anastomosis after distal gastrectomy, longer hospital stay, and more frequent postoperative chemotherapy, which were not significantly different from the younger patients. There were also no significant differences in morbidity, mortality, and reoperation, respectively.
Changes of HRQoL 1 year after gastrectomy
Table 2 showed preoperative HRQoL scores of the age groups.
Preoperatively, elderly patients had lower score of physical functioning and more symptoms of dyspnea and dysphagia.
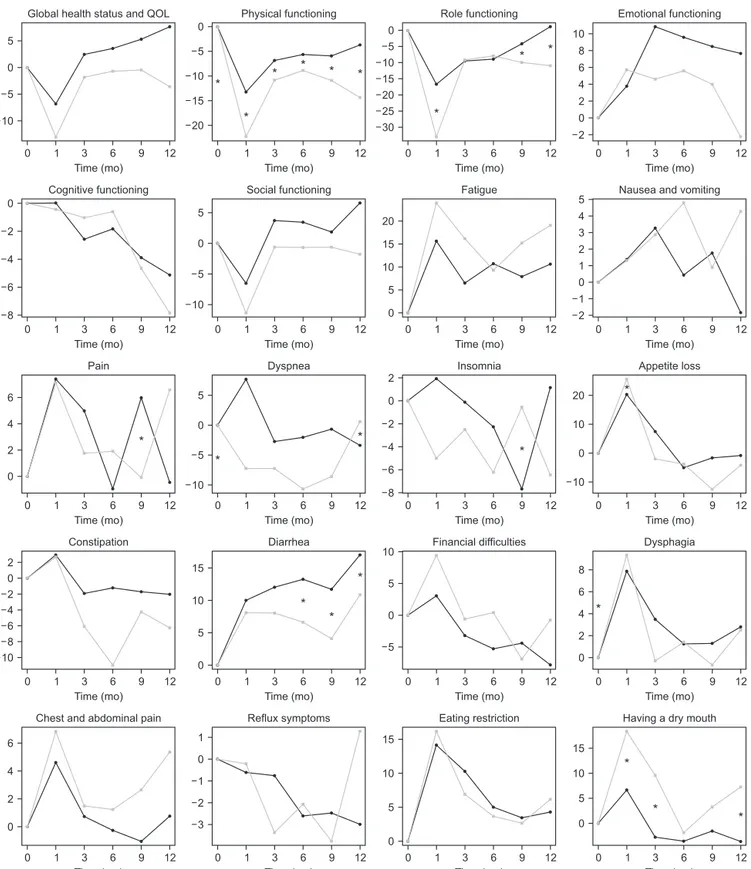
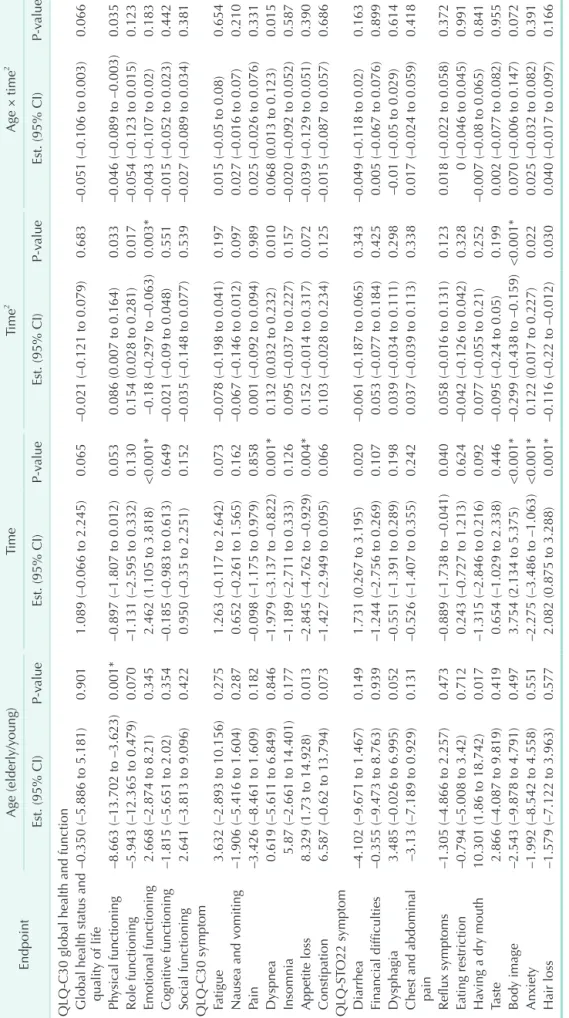
Postoperative longitudinal changes of HRQoL were shown in Fig. 2. The elderly patients’ scores of global health status/QoL, physical functioning, role functioning, and social functioning
were severely deteriorated one month after gastrectomy. The scores of global health status/QoL and emotional functioning were recovered to some degree of preoperative levels but those of physical functioning, role functioning, cognitive functioning, and social functioning were not fully recovered till 1 year after surgery. Pain, appetite loss, and financial difficulties were worsened 1 month after gastrectomy and improved till 1 year after surgery. Fatigue and diarrhea were continuously worsened after gastrectomy. Dysphagia, chest and abdominal pain, eating restriction, and dry mouth showed similar patterns which were worsened 1 month after gastrectomy and improved till 1 year after surgery. But they were not completely recovered.
Predictive factors for HRQoL
Noting that HRQoL could be confounded with demographical (age and sex) and clinical factors (extent of gastrectomy, laparoscopic gastrectomy, TNM stage, and postoperative chemotherapy), multivariable adjusted regression analysis using mixed-effects models were performed for each HRQoL, respectively (Table 3). Considering the age groups, on average over the 1-year follow-up, the elderly group appeared to show
Table 2. Preoperative quality of life
Questionnaire Elderly group (n = 57) Young group (n = 74) P-value
QLQ-C30 global health and function
Global health status and quality of life 63.2 ± 25.4 61.3 ± 22.5 0.458
Physical functioning 85.0 ± 16.2 90.4 ± 15.6 0.006
Role functioning 87.7 ± 23.5 90.8 ± 22.4 0.191
Emotional functioning 81.7 ± 23.0 77.0 ± 23.1 0.102
Cognitive functioning 90.4 ± 14.1 92.3 ± 15.2 0.249
Social functioning 87.1 ± 23.8 81.5 ± 27.8 0.218
QLQ-C30 symptom
Fatigue 17.0 ± 18.9 18.8 ± 22.4 0.942
Nausea and vomiting 4.7 ± 11.3 7.2 ± 15.9 0.556
Pain 6.4 ± 18.0 7.9 ± 15.9 0.177
Dyspnea 20.5 ± 32.6 9.9 ± 23.9 0.030
Insomnia 25.2 ± 36.9 18.5 ± 28.2 0.497
Appetite loss 22.8 ± 35.7 14.0 ± 27.6 0.143
Constipation 19.3 ± 32.1 11.0 ± 22.9 0.149
Diarrhea 7.0 ± 23.4 10.4 ± 22.0 0.084
Financial difficulties 25.2 ± 33.5 27.5 ± 34.2 0.684
QLQ-STO22 symptom
Dysphagia 10.0 ± 12.2 5.6 ± 11.5 0.011
Chest and abdominal pain 7.5 ± 11.5 11.7 ± 17.1 0.221
Reflux symptoms 10.9 ± 16.3 11.7 ± 18.3 0.905
Eating restriction 8.0 ± 13.3 8.3 ± 15.2 0.723
Having a dry mouth 26.9 ± 31.1 22.1 ± 30.4 0.291
Taste 10.5 ± 28.3 6.3 ± 17.2 0.949
Body image 3.5 ± 12.1 7.7 ± 19.5 0.199
Anxiety 36.8 ± 26.4 44.0 ± 22.3 0.073
Hair loss 7.0 ± 15.7 5.2 ± 17.4 0.135
10
Time (mo) 0
5 0 5
Global health status and QOL
12
1 3 6 9
20
Time (mo) 0
0 5 10
Physical functioning
12
1 3 6 9
30
Time (mo) 0
0
10 5
Role functioning
12
1 3 6 9
Time (mo) 0
10 8 6 4 2 0 2
Emotional functioning
12
1 3 6 9
15
15 20 25
10
0
Time (mo)
Time (mo)
Time (mo)
Time (mo) 0
0
0
0 0 2 4 6 8
6
2
6 0
4 6
2
Cognitive functioning
Pain
Constipation
Chest and abdominal pain 12
12
12
12 1
1
1
1 3
3
3
3 6
6
6
6 9
9
9
9
10
Time (mo)
Time (mo)
Time (mo)
Time (mo) 0
0
0
0 5
15
1 5
5 0
10
Social functioning
Dyspnea
Diarrhea
Reflux symptoms 12
12
12
12 1
1
1
1 3
3
3
3 6
6
6
6 9
9
9
9
0
Time (mo)
Time (mo)
Time (mo)
Time (mo) 0
0
0
0 2 0 2 4 6
0
15 20 15 10 5
5
Fatigue
Insomnia
Financial difficulties
Eating restriction 12
12
12
12 1
1
1
1 3
3
3
3 6
6
6
6 9
9
9
9
Time (mo)
Time (mo)
Time (mo)
Time (mo) 0
0
0
0 5
20
15 8 10
6 4 3 2 1
4 2 0
0 2
10
Nausea and vomiting
Appetite loss
Dysphagia
Having a dry mouth 12
12
12
12 1
1
1
1 3
3
3
3 6
6
6
6 9
9
9
9 5
1
0
8 4 0
2 0
8 4 2
0 5 10
5 10
10 5 0 10
5
0 0
1 2 3
Young Elderly
*
*
* *
* *
*
* *
*
*
*
*
*
*
*
*
*
*
* *
Fig. 2. Periodic changes in health-related quality of life (QoL) scores. *Significant difference between the elderly and young patients (P < 0.05).
lower scores in physical function compared to the younger group (mean difference [MD], –8.663; 95% confidence interval [CI], –13.702 to –3.623; P = 0.001) (Fig. 2) while there are no statistically significant differences in global health status/QoL (MD, –0.353; 95% CI, –5.886 to 5.181; P = 0.901). Considering the age group and time change together, there was a significant age group difference in the changes in physical function over the 1-year follow-up where the elderly group tends to decrease in their physical function after 9 months (P = 0.035) (Table 3).
The score of global health status/QoL shows the similar pattern until the 1st month after surgery; however, there were opposite trends between the 2 groups while this difference did not reach statistical significance (P = 0.066) (Table 3, Fig. 2). Elderly patients had significant appetite loss and dry mouth (P = 0.013 and P = 0.017, respectively).
Meanwhile, total gastrectomy, laparoscopic gastrectomy, postoperative chemotherapy, TNM stage, and sex also significantly affect some scores of HRQoL after gastrectomy (Table 4).
DISCUSSION
Patients after gastrectomy were reported to encounter functional impairments and symptoms, but experience only a slightly impaired global HRQoL [5,8]. HRQoL deteriorations in physical, role, and cognitive functioning scales, and significant reductions lasted till 36-month after total gastrectomy [14].
Persistent QoL deterioration after distal subtotal gastrectomy is primarily due to financial difficulties, eating restrictions, and body image concerns [6].
However, there was no report that compares HRQoL of elderly and young patients after gastrectomy for gastric cancer.
This study demonstrated the difference in HRQoL between elderly patients and young patients. Elderly patients’ score of global health status/QoL, physical functioning, role functioning, and social functioning were significantly deteriorated at
Furthermore, the scores of impaired physical functioning, role functioning, cognitive functioning, and social functioning were not restored till postoperative 1 year. This study also demonstrated that there was a significant age group difference in the longitudinal changes in physical function over the 1-year follow-up, but not in global health status/QoL.
Except for age groups, other factors related to HRQoL identified in this study were time trend, sex, total gastrectomy, laparoscopic gastrectomy, and postoperative chemotherapy.
Total gastrectomy was known to have more negative effect on HRQoL than distal gastrectomy [5,7,8,14-17], which preserves more stomach and requires a less extensive lymphadenectomy.
The lower HRQoL of women was consistent with other studies [5,18]. Laparoscopic distal gastrectomy resulted in significantly better HRQoL scores on global health status/QoL and most functionings [5,7,19] and many randomized controlled trials to support this are ongoing [20-22].
This study has several limitations. First, EORTC QLQ-C30 and QLQ-STO22 tools were not optimized for elderly patients and tended to overestimate the HRQoL of the elderly. For comparison with young patients, using well-established tool like EORTC QLQ was inevitable. Second, a large amount of missing data occurred during the follow-up. Most participants showed up for scheduled visit, but some refused to complete the HRQoL assessments because they felt the QoL questionnaire too burdensome. Twelve patients (8.3%) were excluded owing to incomplete follow-ups and a further 35.4% (51 of 144) were included but had incomplete data. An additional 1.4% of patients died during follow-up. We explored several approaches to account for missing data, including various joint likelihood- factorization techniques for longitudinal studies. For example, we found that result showed similar results when we analyzed our data using the LOCF and IPW approaches (Supplementary Fig. 1) [13]. However, we acknowledge that missing data approaches methods suffered from inherent limitations as we cannot test the performances of each approach in the absence
Young Elderly
0
Time (mo) 0
20
10 5
Taste
12
1 3 6 9
0
Time (mo) 0
25 20
10
Body image
12
1 3 6 9
Time (mo) 0
0
Anxiety
12
1 3 6 9
Time (mo) 0
10
5
Hair loss
12
1 3 6 9
5 15
15 5
10
0 5
*
Fig. 2. Continued.
Table 3. Multivariable adjusted mixed effect model outcomes for 24 health-related quality of life endpoints EndpointAge (elderly/young)TimeTime2 Age × time2 Est. (95% CI)P-valueEst. (95% CI)P-valueEst. (95% CI)P-valueEst. (95% CI)P-value QLQ-C30 global health and function Global health status and quality of life–0.350 (–5.886 to 5.181)0.9011.089 (–0.066 to 2.245)0.065–0.021 (–0.121 to 0.079)0.683–0.051 (–0.106 to 0.003)0.066 Physical functioning–8.663 (–13.702 to –3.623)0.001*–0.897 (–1.807 to 0.012)0.0530.086 (0.007 to 0.164)0.033–0.046 (–0.089 to –0.003)0.035 Role functioning–5.943 (–12.365 to 0.479)0.070–1.131 (–2.595 to 0.332)0.1300.154 (0.028 to 0.281)0.017–0.054 (–0.123 to 0.015)0.123 Emotional functioning2.668 (–2.874 to 8.21)0.3452.462 (1.105 to 3.818)<0.001*–0.18 (–0.297 to –0.063)0.003*–0.043 (–0.107 to 0.02)0.183 Cognitive functioning–1.815 (–5.651 to 2.02)0.354–0.185 (–0.983 to 0.613)0.649–0.021 (–0.09 to 0.048)0.551–0.015 (–0.052 to 0.023)0.442 Social functioning2.641 (–3.813 to 9.096)0.4220.950 (–0.35 to 2.251)0.152–0.035 (–0.148 to 0.077)0.539–0.027 (–0.089 to 0.034)0.381 QLQ-C30 symptom Fatigue3.632 (–2.893 to 10.156)0.2751.263 (–0.117 to 2.642)0.073–0.078 (–0.198 to 0.041)0.1970.015 (–0.05 to 0.08)0.654 Nausea and vomiting–1.906 (–5.416 to 1.604)0.2870.652 (–0.261 to 1.565)0.162–0.067 (–0.146 to 0.012)0.0970.027 (–0.016 to 0.07)0.210 Pain–3.426 (–8.461 to 1.609)0.182–0.098 (–1.175 to 0.979)0.8580.001 (–0.092 to 0.094)0.9890.025 (–0.026 to 0.076)0.331 Dyspnea0.619 (–5.611 to 6.849)0.846–1.979 (–3.137 to –0.822)0.001*0.132 (0.032 to 0.232)0.0100.068 (0.013 to 0.123)0.015 Insomnia5.87 (–2.661 to 14.401)0.177–1.189 (–2.711 to 0.333)0.1260.095 (–0.037 to 0.227)0.157–0.020 (–0.092 to 0.052)0.587 Appetite loss8.329 (1.73 to 14.928)0.013–2.845 (–4.762 to –0.929)0.004*0.152 (–0.014 to 0.317)0.072–0.039 (–0.129 to 0.051)0.390 Constipation6.587 (–0.62 to 13.794)0.073–1.427 (–2.949 to 0.095)0.0660.103 (–0.028 to 0.234)0.125–0.015 (–0.087 to 0.057)0.686 QLQ-STO22 symptom Diarrhea–4.102 (–9.671 to 1.467)0.1491.731 (0.267 to 3.195)0.020–0.061 (–0.187 to 0.065)0.343–0.049 (–0.118 to 0.02)0.163 Financial difficulties–0.355 (–9.473 to 8.763)0.939–1.244 (–2.756 to 0.269)0.1070.053 (–0.077 to 0.184)0.4250.005 (–0.067 to 0.076)0.899 Dysphagia3.485 (–0.026 to 6.995)0.052–0.551 (–1.391 to 0.289)0.1980.039 (–0.034 to 0.111)0.298–0.01 (–0.05 to 0.029)0.614 Chest and abdominal pain–3.13 (–7.189 to 0.929)0.131–0.526 (–1.407 to 0.355)0.2420.037 (–0.039 to 0.113)0.3380.017 (–0.024 to 0.059)0.418 Reflux symptoms–1.305 (–4.866 to 2.257)0.473–0.889 (–1.738 to –0.041)0.0400.058 (–0.016 to 0.131)0.1230.018 (–0.022 to 0.058)0.372 Eating restriction–0.794 (–5.008 to 3.42)0.7120.243 (–0.727 to 1.213)0.624–0.042 (–0.126 to 0.042)0.3280 (–0.046 to 0.045)0.991 Having a dry mouth10.301 (1.86 to 18.742)0.017–1.315 (–2.846 to 0.216)0.0920.077 (–0.055 to 0.21)0.252–0.007 (–0.08 to 0.065)0.841 Taste2.866 (–4.087 to 9.819)0.4190.654 (–1.029 to 2.338)0.446–0.095 (–0.24 to 0.05)0.1990.002 (–0.077 to 0.082)0.955 Body image–2.543 (–9.878 to 4.791)0.4973.754 (2.134 to 5.375)<0.001*–0.299 (–0.438 to –0.159)<0.001*0.070 (–0.006 to 0.147)0.072 Anxiety–1.992 (–8.542 to 4.558)0.551–2.275 (–3.486 to –1.063)<0.001*0.122 (0.017 to 0.227)0.0220.025 (–0.032 to 0.082)0.391 Hair loss–1.579 (–7.122 to 3.963)0.5772.082 (0.875 to 3.288)0.001*–0.116 (–0.22 to –0.012)0.0300.040 (–0.017 to 0.097)0.166 Assessed using European Organization for Research and Treatment of Cancer Quality of Life Questionnaires (QLQ). EST., estimate; CI, confidence interval. *Significant difference (P < 0.05).
Parameter estimates for 24 health-related quality of life outcomes except age and time EndpointMale sexPostop chemotherapyDistal/totalOpen/laparoscopicTNM stage Est. (95% CI)P-valueEst. (95% CI)P-valueEst. (95% CI)P-valueEst. (95% CI)P-valueEst. (95% CI)P-value 3.292 (–2.187 to 8.771)0.239–3.001 (–12.617 to 6.616)0.5411.113 (–5.193 to 7.420)0.729–3.580 (–12.241 to 5.082)0.418–5.193 (–9.893 to –0.494)0.030 2.550 (–2.558 to 7.659)0.328–2.301 (–11.241 to 6.638)0.6142.938 (–2.937 to 8.813)0.327–0.071 (–8.132 to 7.989)0.986–4.039 (–8.380 to 0.302)0.068 2.965 (–3.278 to 9.208)0.352–6.919 (–17.901 to 4.063)0.2172.092 (–5.097 to 9.281)0.568–0.027 (–9.909 to 9.854)0.996–8.739 (–14.132 to –3.346)0.001* 9.427 (4.139 to 14.715)<0.001*11.471 (2.146 to 20.795)0.016–5.355 (–11.448 to 0.739)0.085–10.349 (–18.730 to –1.969)0.0160.704 (–3.898 to 5.305)0.764 ve 3.416 (–0.385 to 7.216)0.0783.470 (–3.200 to 10.140)0.3083.026 (–1.349 to 7.400)0.1750.186 (–5.821 to 6.194)0.9521.613 (–1.646 to 4.872)0.332 –0.111 (–6.544 to 6.322)0.9735.647 (–5.633 to 16.927)0.3271.887 (–5.521 to 9.295)0.618–4.127 (–14.292 to 6.037)0.426–4.085 (–9.587 to 1.418)0.146 –1.643 (–8.09 to 4.804)0.618–7.823 (–19.150 to 3.503)0.176–0.434 (–7.851 to 6.983)0.9092.435 (–7.753 to 12.623)0.639–1.065 (–6.610 to 4.480)0.707 –5.331 (–8.619 to –2.044)0.001*–6.148 (–11.957 to –0.338)0.0381.491 (–2.299 to 5.280)0.4414.436 (–0.779 to 9.652)0.095–0.195 (–3.076 to 2.685)0.894 –1.560 (–6.522 to 3.403)0.538–0.965 (–9.679 to 7.750)0.8282.126 (–3.586 to 7.839)0.4667.796 (–0.051 to 15.643)0.0524.129 (–0.135 to 8.393)0.058 1.993 (–4.297 to 8.283)0.5357.440 (–3.572 to 18.452)0.185–1.77 (–9.005 to 5.465)0.6328.658 (–1.270 to 18.586)0.0878.421 (3.068 to 13.774)0.002* –7.99 (–16.650 to 0.669)0.071–6.316 (–21.465 to 8.833)0.414–3.541 (–13.500 to 6.417)0.4860.127 (–13.534 to 13.788)0.985–2.713 (–10.065 to 4.640)0.470 –4.543 (–10.462 to 1.375)0.132–7.377 (–17.891 to 3.138)0.1694.580 (–2.250 to 11.409)0.1897.636 (–1.774 to 17.046)0.1123.033 (–2.236 to 8.302)0.259 –0.831 (–7.952 to 6.289)0.819–2.160 (–14.658 to 10.338)0.735–5.188 (–13.383 to 3.006)0.215–4.339 (–15.594 to 6.917)0.450–2.956 (–9.067 to 3.154)0.343 3.435 (–1.762 to 8.632)0.195–16.442 (–25.631 to –7.254)<0.001*1.514 (–4.477 to 7.506)0.6204.978 (–3.269 to 13.225)0.237–0.678 (–5.238 to 3.882)0.771 4.450 (–4.89 to 13.79)0.350–7.100 (–23.421 to 9.221)0.394–2.981 (–13.724 to 7.762)0.58611.923 (–2.802 to 26.647)0.1134.553 (–3.349 to 12.456)0.259 O22 symptom –1.455 (–4.827 to 1.917)0.398–1.577 (–7.529 to 4.375)0.604–0.214 (–4.098 to 3.669)0.9143.193 (–2.154 to 8.54)0.2421.250 (–1.676 to 4.176)0.402 –2.052 (–6.040 to 1.935)0.313–0.833 (–7.850 to 6.185)0.8164.986 (0.394 to 9.577)0.0332.355 (–3.960 to 8.670)0.465–0.438 (–3.869 to 2.993)0.802 –2.393 (–5.817 to 1.031)0.171–1.086 (–7.137 to 4.966)0.725–3.162 (–7.104 to 0.781)0.116–1.987 (–7.421 to 3.446)0.473–1.177 (–4.146 to 1.793)0.437 –2.194 (–6.281 to 1.892)0.293–1.425 (–8.628 to 5.779)0.6984.265 (–0.440 to 8.970)0.0762.528 (–3.947 to 9.003)0.4441.862 (–1.671 to 5.394)0.302 –6.385 (–14.936 to 2.166)0.1432.983 (–11.998 to 17.964)0.696–1.672 (–11.506 to 8.162)0.7393.517 (–9.985 to 17.019)0.610–0.117 (–7.384 to 7.151)0.975 –9.578 (–16.234 to –2.923)0.005*–9.469 (–21.222 to 2.285)0.1143.753 (–3.913 to 11.419)0.337–0.755 (–11.312 to 9.801)0.888–0.943 (–6.726 to 4.840)0.749 4.578 (–2.603 to 11.759)0.211–7.475 (–20.116 to 5.166)0.2462.649 (–5.617 to 10.914)0.530–1.354 (–12.725 to 10.016)0.815–3.539 (–9.724 to 2.647)0.262 –2.541 (–9.156 to 4.074)0.451–14.620 (–26.210 to –3.029)0.0134.787 (–2.820 to 12.393)0.2173.626 (–6.818 to 14.071)0.496–2.748 (–8.375 to 2.879)0.339 –8.118 (–13.561 to –2.674)0.003*–7.595 (–17.174 to 1.983)0.1202.114 (–4.151 to 8.380)0.508–1.357 (–9.974 to 7.261)0.758–3.994 (–8.677 to 0.689)0.095 ch and Treatment of Cancer Quality of Life Questionnaires (QLQ). al.
data for transparency. Third, EORTC assessments consist of a lot of questions so that the rate of questionnaire completion is relatively low. To boost the completion rate and the patient retention rate, reward programs can be considered for a future study. Lastly, this study lacked long-term results and the strategy to reduce the missing data or the cross-sectional study design may help this limitation. But when we reviewed the previous studies which showed that time trend is mainly associated with HRQoL in the early recovery period whereas HRQoL remains relatively stable after the 1st year following surgery [5,15,16,23], similar long-term results were expected.
Future research includes (1) nonlinear trend over the course of follow-up using the nonlinear mixed effects model; (2) the time-varying nutrition in the regression model to better understand the impact of the nutrition on the HRQoL of the patient.
In summary, elderly patients had lower score of physical functioning before surgery. Global health status/QoL, physical functioning, role functioning, and social functioning were deteriorated 1 month after gastrectomy and improved 3 months after gastrectomy. But those were not fully recovered. Age group significantly affected the scores of physical functioning and the difference last till 1-year after surgery.
In conclusion, elderly patients’ QoL, especially physical functioning, was not completely recovered one year after gastrectomy unlike those of younger patients. Hence surgeons need to pay more attention to the elderly patients’ QoL after gastrectomy.
SUPPLEMENTARY MATERIALS
Supplementary Fig. 1 can be found via https://doi.org/10.4174/
astr.2021.100.1.8.
ACKNOWLEDGEMENTS
Fund/Grant Support
This work was supported by a clinical research grant-in- aid from the Seoul Metropolitan Government Seoul National University (SMG-SNU) Boramae Medical Center (03-2014-13).
Conflict of Interest
No potential conflict of interest relevant to this article was reported.
ORCID ID
Dong-Seok Han: https://orcid.org/0000-0002-9003-7987 Jaeil Ahn: https://orcid.org/0000-0001-7998-4759 Hye Seong Ahn: https://orcid.org/0000-0001-6853-7793
Author Contribution
Conceptualization: HSA Formal Analysis: HSA, JA Investigation: All authors Methodology: HSA, DSH Project Administration: HSA Writing – Original Draft: All authors Writing – Review & Editing: All authors
REFERENCES
1. Information Committee of Korean Gastric Cancer Association. Korean Gastric Cancer Association Nationwide Survey on Gastric Cancer in 2014. J Gastric Cancer 2016;16:131-40.
2. Song P, Wu L, Jiang B, Liu Z, Cao K, Guan W. Age-specific effects on the prognosis after surgery for gastric cancer: a SEER population-based analysis. Oncotarget 2016;7:48614-24.
3. Katai H, Ishikawa T, Akazawa K, Isobe Y, Miyashiro I, Oda I, et al. Five-year survival analysis of surgically resected gastric cancer cases in Japan: a retrospective analysis of more than 100,000 patients from the nationwide registry of the
Japanese Gastric Cancer Association (2001-2007). Gastric Cancer 2018;21:144- 54.
4. Yang JY, Lee HJ, Kim TH, Huh YJ, Son YG, Park JH, et al. Short- and long-term outcomes after gastrectomy in elderly gastric cancer patients. Ann Surg Oncol 2017;24:469-77.
5. Brenkman HJ, Tegels JJ, Ruurda JP, Luyer MD, Kouwenhoven EA, Draaisma WA, et al. Factors influencing health-related quality of life after gastrectomy for cancer.
Gastric Cancer 2018;21:524-32.
6. Lee SS, Chung HY, Kwon O, Yu W. Long- term shifting patterns in quality of life after distal subtotal gastrectomy:
preoperative- and healthy-based interpre- tations. Ann Surg 2015;261:1131-7.
7. K aranicolas PJ, Graham D, Gönen M, Strong VE, Brennan MF, Coit DG.
Quality of life after gastrectomy for adenocarcinoma: a prospective cohort study. Ann Surg 2013;257:1039-46.
8. Kim AR, Cho J, Hsu YJ, Choi MG, Noh JH, Sohn TS, et al. Changes of quality of life in gastric cancer patients after curative resection: a longitudinal cohort study in Korea. Ann Surg 2012;256:1008-13.
9. Guideline Committee of the Korean Gastric Cancer Association (KGCA), Development Working Group & Review Panel. Korean Practice Guideline for
Gastric Cancer 2018: an evidence-based, multi-disciplinary approach. J Gastric Cancer 2019;19:1-48.
10. Yun YH, Park YS, Lee ES, Bang SM, Heo DS, Park SY, et al. Validation of the Korean version of the EORTC QLQ-C30. Qual Life Res 2004;13:863-8.
11. Aaronson NK, Ahmedzai S, Bergman B, Bullinger M, Cull A, Duez NJ, et al. The European Organization for Research and Treatment of Cancer QLQ-C30: a quality- of-life instrument for use in international clinical trials in oncology. J Natl Cancer Inst 1993;85:365-76.
12. Vickery CW, Blazeby JM, Conroy T, Arraras J, Sezer O, Koller M, et al. Development of an EORTC disease-specific quality of life module for use in patients with gastric cancer. Eur J Cancer 2001;37:966-71.
13. Ahn J, Ahn HS. Bayesian analysis of longitudinal quality of life measures with informative missing data using a selection model. Stat Methods Med Res 2020;29:1354-67.
14. Lee SS, Chung HY, Kwon OK, Yu W.
Quality of life in cancer survivors 5 years or more after total gastrectomy: a case- control study. Int J Surg 2014;12:700-5.
15. Avery K, Hughes R, McNair A, Alderson D, Barham P, Blazeby J. Health-related quality of life and survival in the 2 years after surgery for gastric cancer. Eur J Surg Oncol 2010;36:148-54.
16. Park KB, Park JY, Lee SS, Chung HY, Kwon OK. Chronological changes in quality of life and body composition after gastrectomy for locally advanced gastric cancer. Ann Surg Treat Res 2020;98:262-9.
17. Park S, Chung HY, Lee SS, Kwon O, Yu W.
Serial comparisons of quality of life after distal subtotal or total gastrectomy: what are the rational approaches for quality of life management? J Gastric Cancer 2014;14:32-8.
18. van de Poll-Franse LV, Mols F, Gundy CM, Creutzberg CL, Nout RA, Verdonck-de Leeuw IM, et al. Normative data for the EORTC QLQ-C30 and EORTC-sexuality items in the general Dutch population.
Eur J Cancer 2011;47:667-75.
19. Kim YW, Baik YH, Yun YH, Nam BH, Kim DH, Choi IJ, et al. Improved quality of life outcomes after laparoscopy-assisted distal gastrectomy for early gastric cancer:
results of a prospective randomized clinical trial. Ann Surg 2008;248:721-7.
20. Hur H, Lee H Y, Lee H J, K im MC, Hyung WJ, Park YK, et al. Efficacy of laparoscopic subtotal gastrectomy with D2 lymphadenectomy for locally advanced gastric cancer: the protocol of the KLASS-02 multicenter randomized controlled clinical trial. BMC Cancer 2015;15:355.
21. Straatman J, van der Wielen N, Cuesta MA, Gisbertz SS, Hartemink KJ, Alonso Poza A, et al. Surgical techniques, open versus minimally invasive gastrectomy after chemotherapy (STOMACH trial):
study protocol for a randomi zed controlled trial. Trials 2015;16:123.
22. Haverkamp L, Brenkman HJ, Seesing MF, Gisbertz SS, van Berge Henegouwen MI, Luyer MD, et al. Laparoscopic versus open gastrectomy for gastric cancer, a multicenter prospectively randomized controlled trial (LOGICA-trial). BMC Cancer 2015;15:556.
23. Zhang M, Zhang C, Wu QC. Health-related quality of life and survival among 10-year survivors of esophageal cancer surgery:
gastric tube reconstruction versus whole stomach reconstruction. J Thorac Dis 2019;11:3284-91.