ABSTRACT
Purpose: We investigated the relationship between sonographic measurements of fatty liver and body mass index standard deviation score (BMI-Z score), abdominal wall fat thickness (AWFT), and serum biochemical parameters in childhood obesity.
Methods: Anthropometric, laboratory, and ultrasonography data were obtained from 174 children with BMI-Z score >1. After the qualitative grading of hepatosteatosis (grades 0–3), the quantitative liver–kidney echogenicity ratio (LKER) was calculated using a software tool. Groups according to sex, age (AG-I to AG-III), BMI-Z score (BMG-I to BMG-III), and hepatosteatosis degree (HS-I and HS-II) were formed. The differences and distributions of the variables were statistically analyzed and compared among the groups.
Results: Serum transaminase and glucose levels showed a positive correlation with LKER, whereas the HDL level showed a negative correlation. BMI-Z score and AWFT showed a positive correlation with fasting insulin level and HOMA-IR value. LKER was significantly higher in girls than in boys (p=0.008). In the AG-I group (age 3–8.9 years), the BMI-Z score was significantly higher, whereas AWFT was significantly lower than in the other age groups (p<0.001). The cutoff point of LKER for predicting grade 2 or higher steatosis (HS-II group) was determined to be 1.83. Cardiovascular disease risk was significantly higher in the HS-II group (p=0.035).
Conclusion: As a valuable quantitative measurement tool, LKER can be used for the
sonographic screening of fatty liver. AWFT, on the basis of its correlation with fasting insulin level and HOMA-IR value, may be a useful sonographic parameter in the management of childhood obesity.
Keywords: Ultrasonography; Pediatrics; Childhood obesity; Hepatic steatosis;
Anthropometry
INTRODUCTION
Childhood obesity and its associated comorbidities are worldwide public health problems, and their prevalence is increasing. Obesity is closely associated with nonalcoholic fatty
Original Article
Received: Nov 23, 2020 Revised: Mar 12, 2021 Accepted: Jul 10, 2021 Correspondence to Çağrı Damar
Department of Pediatric Radiology, Faculty of Medicine, Gaziantep University, Şehitkamil, Gaziantep 27310, Turkey.
E-mail: [email protected] Copyright © 2021 by The Korean Society of Pediatric Gastroenterology, Hepatology and Nutrition
This is an open-access article distributed under the terms of the Creative Commons Attribution Non-Commercial License (https://
creativecommons.org/licenses/by-nc/4.0/) which permits unrestricted non-commercial use, distribution, and reproduction in any medium, provided the original work is properly cited.
ORCID iDs Çağrı Damar
https://orcid.org/0000-0001-7208-1290 Emregül Işık
https://orcid.org/0000-0003-0162-6745 Şükrü Güngör
https://orcid.org/0000-0002-0433-5970 Conflict of Interest
The authors have no financial conflicts of interest.
Çağrı Damar ,1 Emregül Işık ,2 and Şükrü Güngör 3
1Department of Pediatric Radiology, Faculty of Medicine, Gaziantep University, Gaziantep, Turkey
2 Clinics of Pediatric Endocrinology, Department of Pediatrics, Gaziantep Children's Hospital, Gaziantep, Turkey
3 Clinics of Pediatric Gastroenterology, Hepatology and Nutrition, Department of Pediatrics, Faculty of Medicine, Kahramanmaras Sutcu Imam University, Kahramanmaraş, Turkey
Relationship between Quantitative
Sonographic Measurements and
Serum Biochemical Parameters in
Childhood Obesity
liver disease (NAFLD) and metabolic syndrome (MetS). NAFLD is the main cause of hepatosteatosis in childhood. Metabolic and nutritional factors, viral agents, toxicity, and drugs can be specified as other causes [1]. Excessive fat accumulation in hepatocytes is described as hepatosteatosis. Consequently, inflammation and fibrosis in the liver parenchyma may lead to steatohepatitis [2].
Quantitative methods including the use of software based on radiological modalities, such as ultrasonography (US), computed tomography, and magnetic resonance imaging, are noninvasive techniques for the diagnosis and quantification of hepatosteatosis [1-5].
Biopsy, which is an invasive procedure performed to determine the degree of steatosis, is the gold standard method that also allows the determination of accompanying inflammation, parenchymal damage, and fibrosis in the fatty liver [2,6,7].
US has emerged as an inexpensive, practical, reliable, and radiation-free examination method for assessing the degree of hepatic steatosis, among other radiological modalities. In routine clinical practice, a diffuse increased echo pattern of the liver parenchyma compared with the renal cortical or splenic parenchyma is considered to be consistent with steatosis. With sonographic visual evaluation, hepatic steatosis is qualitatively graded as mild to severe (grades 1–3) [2,3,6]. However, this grading system is subjective, as it is not based on a quantification method but is dependent on the interpretation of the sonographer [8]. Since the 1980s, sonographic quantitative methods, ranging from simple to complex, have been proposed for the evaluation of fatty liver [9].
The main objective of this study was to evaluate the correlation between sonographic quantitative measurements of hepatic steatosis and body mass index standard deviation score (BMI-Z score), abdominal wall fat thickness (AWFT), and serum biochemical parameters in obese children.
MATERIALS AND METHODS
This study was performed in a secondary care children's hospital and approved by the Gaziantep University, Faculty of Medicine Clinical Research Ethics Committee (protocol no.
2019/352).
Patient selection
The study included 174 overweight and obese children aged 3–18 years who attended the pediatric endocrinology clinic between January 2017 and January 2018. The study participants were randomly selected from patients who visited the clinic consecutively during their outpatient appointments. The patients were grouped in equal numbers according to sex.
Informed consent was obtained from the parents of all children.
Exclusion criteria
Patients with right renal agenesis, right multicystic dysplastic kidney, right hydronephrosis accompanied by parenchymal thinning, or glomerulonephritis were excluded from the study.
Any children with diseases that could affect the liver parenchymal echo pattern and the echo structure, such as viral or idiopathic hepatitis, storage diseases, thalassemia, tyrosinemia, or Wilson's disease, were also excluded. We further excluded children with missing data on biochemical parameters.
Anthropometric measurements
The height of all children participating in the study was measured using a vertical portable stadiometer calibrated to the nearest millimeter (without socks and shoes). Their weight was measured using a digital electronic scale (while wearing light clothes). The weight-Z score, height-Z score, and BMI-Z score were calculated according to age and sex using World Health Organization data. The study included those with BMI-Z score >1.
Serum biochemical parameters
After an appropriate fasting duration, the selected participants were examined for serum aspartate aminotransferase (AST), alanine aminotransferase (ALT), thyroid-stimulating hormone (TSH), free thyroxine (fT4), high-density lipoprotein (HDL), low-density
lipoprotein (LDL), insulin, homeostasis model assessment of insulin resistance (HOMA-IR), serum total cholesterol, and triglyceride levels.
Cardiovascular disease risk
As our patients were overweight or obese, which may pose a risk of cardiovascular disease, we used a HOMA-IR cutoff point of 3.42 [10].
Insulin resistance
Insulin resistance was defined as a HOMA-IR value of ≥3.16 [11].
Serum lipid profile
The parameters were determined as follows [12]: low HDL, HDL ≤45 mg/dL;
hypercholesterolemia, total cholesterol ≥150 mg/dL; hypertriglyceridemia, triglycerides ≥100 mg/dL; and high LDL cholesterol, LDL cholesterol ≥100 mg/dL.
Sonographic study
1. B-mode US and data collection
Gray-scale US was performed by a qualified pediatric radiologist with at least 5 years of experience, using an F8 Expert system (GE Medical Systems, Milwaukee, WI, USA) with a 3–5-MHz convex probe. The patients were positioned supine with the right arm in abduction.
For standardization of the images, constant B-mode abdominal values were pre-set as time- gain compensation values (0 dB), frequency (4.0), depth (15–20 cm), and focus (5 cm). To obtain high-quality images, only the B-mode gain values were changed among the imaging parameters of the US device. As this change had an equal effect on the brightness of the liver and kidneys during imaging, it was assumed that it will not change the measurement values.
Cine recordings in audio video interleave (.avi) file format were taken so that the liver and right kidney could be evaluated holistically. At least five craniocaudal–oblique images were obtained with the right anterior intercostal–subcostal approach so that the right-lobe segments of the liver (V-VIII) and the long axis of the right kidney could be observed together.
In addition, AWFT (from the skin surface to the anterior fascia of the rectus abdominis muscle) was measured at the umbilicus level and the values (in millimeters) were recorded (Fig. 1).
2. Classical grading of hepatosteatosis
Hepatosteatosis was graded (grades 0–3) using the well-known classical qualitative method on cine recordings, based on the consensus of two radiologists (the other radiologist had at least 8 years of experience) [13].
3. Liver–kidney echogenicity ratio (LKER) measurement
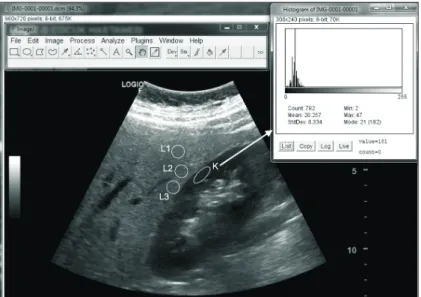
Images were saved in Digital Imaging and Communications in Medicine (DICOM) file format and uploaded to the computer. From the DICOM image data, blurred images due to motion artifacts were eliminated and images with appropriate resolution were selected and processed with the gray-scale histogram option in the ImageJ program (version 1.52q; National Institutes of Health, Bethesda, MD, USA) [14]. In the histogram, a total of three quantitative values were obtained from the liver parenchyma (L1–3) and a single value was obtained from the parallel renal cortical parenchyma (K) by placing circular and elliptical regions of interest (ROI=30×30 pixels [~8×8 mm] for the liver and ROI=50×20 pixels [~5×13 mm] for the kidney) at a depth of 5±1 cm on the images (Fig. 2). The arithmetic mean of these three liver histogram values were recorded.
Abdominal wall fat thickness
Rectus abdominis muscle
Fig. 1. Transverse plane measurement of abdominal wall fat thickness at the umbilicus level. During imaging, good probe–skin contact should be maintained.
Fig. 2. Histogram analysis of the liver/right kidney ultrasonographic image obtained in the sagittal plane of the right upper-quadrant of the body, using ImageJ software. A total of three quantitative values were obtained from the liver parenchyma (L1-3) and a single value was obtained from the parallel renal cortical parenchyma (K) by placing circular and elliptical regions of interest (ROI=30×30 pixels for the liver and ROI=50×20 pixels for the kidney) at a depth of 5±1 cm on the images.
LKER was calculated from the obtained data. In the selection of the parenchymal measurement area, the main vessels and biliary ducts of the liver and the medulla and sinus structures of the kidney were avoided. Homogeneous and uniform parenchymal areas were preferred.
Group creation 1. BMI-Z score groups
The BMI-Z score was calculated using the national metric standards for children [15]. The 174 total children were divided into three groups according to their BMI-Z scores. The first group (BMG-I) had BMI-Z scores between 1 and 2; second group (BMG-II), BMI-Z scores between 2 and 3; and third group (BMG-III), BMI-Z scores >3.
2. Age groups
We classified the participants into age groups according to normal puberty. All participating children were divided into three age groups, as follows: AG-I, age between 3 and 8.9 years (prepubertal); AG-II, age between 9 and 13.9 years (pubertal); and AG-III, age between 14 and 17.9 years (postpubertal).
3. Quantitative hepatosteatosis groups
Two groups were created according to the classical grading of hepatosteatosis. The first group (HS-I) consisted of participants with lower than grade 2 hepatosteatosis, and the second group (HS-II) consisted of participants with grade 2 or higher hepatosteatosis. These qualitative hepatosteatosis groups (HS-I and HS-II) and the LKER values were statistically analyzed to determine an optimal cutoff point for the prediction of grade 2 or higher (moderate-to-severe) steatosis. Thereafter, the LKER data were distributed into these two groups based on the cutoff point.
The relationships between BMI-Z score, AWFT, serum biomarkers, and histogram data (LKER values) from the gray-scale US images were statistically evaluated within all the created groups.
Statistical analysis
Data obtained in the study were statistically analyzed using SPSS Statistics for Windows (version 20; IBM Corp., Armonk, NY, USA). The conformity of data to a normal distribution was assessed using the Kolmogorov–Smirnov test. Data were reported as minimum, maximum, and mean±standard deviation values. Receiver operating characteristic curve analysis was performed to determine the optimal cutoff point for the prediction of grade 2 or higher (moderate-to-severe) steatosis. In terms of BMI-Z score, LKER, and AWFT, to evaluate the differences between two groups (sex, hepatosteatosis) and among three groups (age, BMI-Z score), the independent-samples t-test, Mann–Whitney U-test, one-way analysis of variance, and Kruskal–Wallis test were applied as appropriate. To evaluate the correlation between variables, the Spearman test was used. A value of p<0.05 was considered statistically significant.
RESULTS
The study population comprised 87 girls and 87 boys with a mean age of 10.57±3.03 years (range, 3–17.9 years).
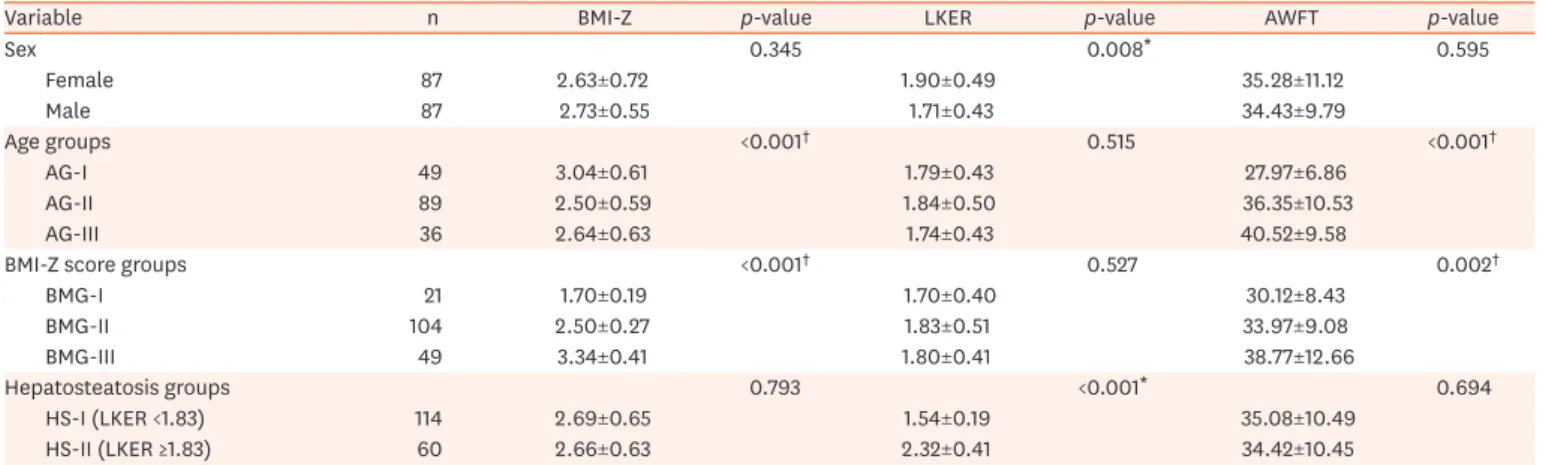
No statistically significant difference was observed between the sexes in terms of age, BMI-Z score, or AWFT (p=0.890, p=0.345, and p=0.595, respectively). LKER was significantly higher in girls than in boys (p=0.008) (Table 1).
When the BMI-Z score, LKER, and AWFT of the patients were compared according to age groups (AG-I to AG-III), the distribution of BMI-Z scores and AWFT values among the groups was statistically different (p<0.001 and p<0.001, respectively). Meanwhile, no significant difference in LKER was observed among the age groups (p=0.515) (Table 1).
When the LKER and AWFT values of the patients were compared among the BMI-Z score groups, the distribution of the AWFT values was statistically different among the groups (p=0.002), whereas no significant difference was found in terms of the LKER values (p=0.527) (Table 1).
The optimal LKER cutoff point for the prediction of grade 2 or higher (moderate-to-severe) steatosis was determined to be 1.83, with a sensitivity of 98% and a specificity of 91%. The area under the receiver operating characteristic curve was 0.99 (95% confidence interval, 0.98–0.99) (Fig. 3). When the BMI-Z scores and AWFT values of the patients were compared according to the degree of hepatosteatosis, the distribution of BMI-Z scores and AWFT values between the HS-I and HS-II groups was not statistically different (p=0.793 and p=0.694, respectively) (Table 1).
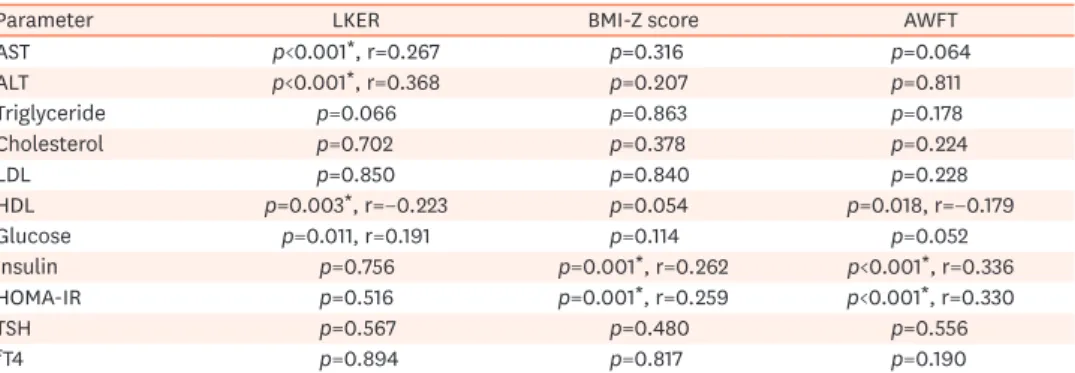
When the correlation between the LKER values and biochemical parameters of the patients was evaluated, a positive correlation was observed between LKER and AST, ALT, and glucose levels (r=0.267, p<0.001; r=0.368, p<0.001; and r=0.191, p=0.011, respectively). A negative correlation was found between HDL levels and LKER values (r=−0.233, p=0.003). No significant correlation was found between other biochemical parameters and LKER values (Table 2).
When the correlation between the BMI-Z scores and biochemical parameters of the patients was evaluated, a positive correlation was found between BMI-Z scores and insulin and HOMA-IR values (r=0.262, p=0.001 and r=0.259, p=0.001, respectively). No significant correlation was found between other biochemical parameters and BMI-Z scores (Table 2).
Table 1. Statistical analysis of LKER, BMI-Z score, and AWFT according to different groups
Variable n BMI-Z p-value LKER p-value AWFT p-value
Sex 0.345 0.008* 0.595
Female 87 2.63±0.72 1.90±0.49 35.28±11.12
Male 87 2.73±0.55 1.71±0.43 34.43±9.79
Age groups <0.001† 0.515 <0.001†
AG-I 49 3.04±0.61 1.79±0.43 27.97±6.86
AG-II 89 2.50±0.59 1.84±0.50 36.35±10.53
AG-III 36 2.64±0.63 1.74±0.43 40.52±9.58
BMI-Z score groups <0.001† 0.527 0.002†
BMG-I 21 1.70±0.19 1.70±0.40 30.12±8.43
BMG-II 104 2.50±0.27 1.83±0.51 33.97±9.08
BMG-III 49 3.34±0.41 1.80±0.41 38.77±12.66
Hepatosteatosis groups 0.793 <0.001* 0.694
HS-I (LKER <1.83) 114 2.69±0.65 1.54±0.19 35.08±10.49
HS-II (LKER ≥1.83) 60 2.66±0.63 2.32±0.41 34.42±10.45
Values are presented as number only or mean±standard deviation.
LKER: liver–kidney echogenicity ratio, BMI-Z score: body mass index standard deviation score, AWFT: abdominal wall fat thickness, AG-I to AG-III: age groups (AG-I: 3–8.9 years old, AG-II: 9–13.9 years old, AG-III: 14–17.9 years old), BMG-I to BMG-III: BMI-Z score groups, HS-I and H-II: hepatosteatosis groups.
*Independent Student's t-test. †One-way analysis of variance.
When the correlation between the AWFT values of the patients and the biochemical parameters was evaluated, a positive correlation was found between AWFT values and insulin levels and HOMA-IR values (r=0.336, p<0.001 and r=0.330, p<0.001, respectively).
In contrast, a negative correlation was observed between HDL levels and AWFT values (r=−0.179, p=0.018). No significant correlation was found between other biochemical parameters and AWFT values (Table 2).
We found that the transaminase (AST, ALT) and triglyceride levels were significantly higher in patients with grade 2 or higher hepatosteatosis (included in the HS-II group) than in those with lower than grade 2 hepatosteatosis (included in the HS-I group) (p<0.001, p<0.001, and p=0.042, respectively) (Table 3).
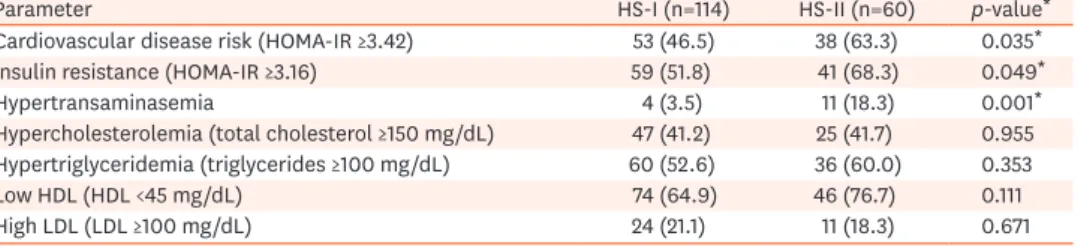
When the patients were evaluated according to the MetS parameters, we found that patients with grade 2 or higher hepatosteatosis (included in the HS-II group) had significantly higher cardiovascular disease risk, insulin resistance, and transaminase levels than those with lower than grade 2 hepatosteatosis (included in the HS-I group) (p=0.035, p=0.049, and p=0.001, respectively). The two hepatosteatosis groups (HS-I and HS-II) showed no statistically
1.0
0.8
0.6
0.4
0.2
1.0
Sensitivity
1-Specificity ROC curve
0 0.2 0.4 0.6 0.8
Fig. 3. Receiver operating characteristic (ROC) curve analysis yielded 1.83 as the optimal cutoff point for the prediction of moderate-to-severe steatosis. The area under the curve (blue) was determined to be 0.99.
Table 2. Correlation of LKER, BMI-Z score, and AWFT with serum biochemical parameters
Parameter LKER BMI-Z score AWFT
AST p<0.001*, r=0.267 p=0.316 p=0.064
ALT p<0.001*, r=0.368 p=0.207 p=0.811
Triglyceride p=0.066 p=0.863 p=0.178
Cholesterol p=0.702 p=0.378 p=0.224
LDL p=0.850 p=0.840 p=0.228
HDL p=0.003*, r=−0.223 p=0.054 p=0.018, r=−0.179
Glucose p=0.011, r=0.191 p=0.114 p=0.052
Insulin p=0.756 p=0.001*, r=0.262 p<0.001*, r=0.336
HOMA-IR p=0.516 p=0.001*, r=0.259 p<0.001*, r=0.330
TSH p=0.567 p=0.480 p=0.556
fT4 p=0.894 p=0.817 p=0.190
Correlation coefficient (r) values that are written in bold indicate negative correlations.
LKER: liver–kidney echogenicity ratio, BMI-Z score: body mass index standard deviation score, AWFT: abdominal wall fat thickness, AST: aspartate aminotransferase, ALT: alanine aminotransferase, LDL: low-density lipoprotein, HDL: high-density lipoprotein, HOMA-IR: homeostatic model assessment of insulin resistance, TSH: thyroid- stimulating hormone, fT4: free T4.
*The correlation (Spearman) is significant at the 0.01 level.
significant difference in terms of hypertriglyceridemia, hypercholesterolemia, low HDL, and high LDL (Table 4).
Although BMI-Z score and AWFT showed a correlation with each other (p=0.000, r=0.301), these parameters were not associated with LKER (p>0.001).
We found that the best LKER cutoff point for predicting hypertransaminasemia was ≥1.98 (73.3% sensitivity and 77.4% specificity, p<0.001) (Table 5).
Table 3. Comparison of laboratory results according to hepatosteatosis degree
Variable HS-I group (n=114) HS-II group (n=60) p-value*
ALT (IU/L) 22.49±12.47 33.05±21.53 0.001*
AST (IU/L) 21.62±6.47 27.20±12.19 0.001*
BMI-Z score 2.69±0.66 2.66±0.63 0.793
Weight-Z score 2.79±1.02 2.66±1.13 0.441
Height-Z score 0.54±1.12 0.50±1.55 0.865
AWFT 35.08±10.49 34.42±10.45 0.694
Glucose (mg/dL) 88.04±7.83 90.08±6.33 0.084
Insulin (μIU/mL) 22.34±21.72 21.82±16.72 0.878
HOMA-IR 4.87±4.92 5.04±4.37 0.833
Cholesterol (mg/dL) 146.26±33.99 147.56±28.19 0.800
Triglyceride (mg/dL) 115.78±65.95 143.43±92.10 0.042*
HDL (mg/dL) 41.50±9.64 39.31±10.21 0.165
LDL (mg/dL) 81.94±28.60 79.96±25.58 0.653
Values are presented as mean±standard deviation.
HS-I group (<grade 2 steatosis): the liver–kidney echogenicity ratio (LKER) of the patients was lower than the cutoff point of 1.83. HS-II group (≥grade 2 steatosis): the LKER of the patients was greater than or equal to the cutoff point of 1.83. HS-I and HS-II: hepatosteatosis groups, ALT: alanine aminotransferase, AST: aspartate aminotransferase, BMI-Z score: body mass index standard deviation score, AWFT: abdominal wall fat thickness, HOMA-IR: homeostatic model assessment of insulin resistance, HDL: high-density lipoprotein, LDL: low-density lipoprotein.
*Independent Student's t-test.
Table 4. Comparison of metabolic syndrome parameters of the patients in the two hepatosteatosis groups (HS-I and HS-II)
Parameter HS-I (n=114) HS-II (n=60) p-value*
Cardiovascular disease risk (HOMA-IR ≥3.42) 53 (46.5) 38 (63.3) 0.035*
Insulin resistance (HOMA-IR ≥3.16) 59 (51.8) 41 (68.3) 0.049*
Hypertransaminasemia 4 (3.5) 11 (18.3) 0.001*
Hypercholesterolemia (total cholesterol ≥150 mg/dL) 47 (41.2) 25 (41.7) 0.955 Hypertriglyceridemia (triglycerides ≥100 mg/dL) 60 (52.6) 36 (60.0) 0.353
Low HDL (HDL <45 mg/dL) 74 (64.9) 46 (76.7) 0.111
High LDL (LDL ≥100 mg/dL) 24 (21.1) 11 (18.3) 0.671
Values are presented as number (%).
HS-I group (<grade 2 steatosis): the liver–kidney echogenicity ratio (LKER) of the patients was lower than the cutoff point of 1.83. HS-II group (≥grade 2 steatosis): the LKER of the patients was greater than or equal to the cutoff point of 1.83. HS-I and HS-II: hepatosteatosis groups, HOMA-IR: homeostatic model assessment of insulin resistance, HDL: high-density lipoprotein, LDL: low-density lipoprotein.
*Independent Student's t-test.
Table 5. Determination of the best cutoff point of LKER for predicting hypertransaminasemia (A) and the best cutoff points of AWFT (B) and insulin level (C) for predicting insulin resistance
Variable Cutoff point Sensitivity Specificity AUC (95% CI) p-value for AUC*
A LKER ≥1.98 0.733 0.774 0.607–0.909 0.001*
B AWFT (mm) ≥36.5 0.603 0.737 0.586–0.760 <0.001*
C Insulin (μIU/mL) ≥19.21 1.00 0.909 0.989–1 <0.001*
LKER: liver–kidney echogenicity ratio, AWFT: abdominal wall fat thickness, AUC: area under the curve, CI: confidence interval.
*Receiver operating characteristic curve analysis.
We found that the best AWFT cutoff point for predicting insulin resistance was ≥36.5 mm (60.3% sensitivity and 73.7% specificity, p<0.001) (Table 5).
Further, we found that the best insulin level cutoff point for predicting insulin resistance was
≥19.21 μIU/mL (100% sensitivity and 90.9% specificity, p<0.001) (Table 5).
DISCUSSION
In children with obesity, early screening and evaluations with blood tests and radiological imaging are important to obtain necessary information that could guide treatment decisions [16]. Nonquantitative grading is a commonly used practical and relatively reliable method for the sonographic evaluation of NAFLD. A meta-analysis study showed that in the diagnosis of moderate-to-severe hepatic steatosis, US had sensitivity and specificity values of 84.8% and 93.6%, respectively, compared with histological examination [17]. Studies on quantitative sonographic measurements of hepatosteatosis have been conducted in two main areas: (i) image processing and (ii) raw radiofrequency signal processing [3,18]. LKER- based quantification of fatty liver is an image-processing technique that has shown a high correlation with biopsy results and other more reliable radiological quantitative methods (1H magnetic resonance spectroscopy). Studies in adult populations have proved that this technique can be used independently to measure hepatosteatosis [6,19-21]. With respect to NAFLD in childhood obesity, some studies including classical sonographic grading have been published; however, studies including quantitative US techniques are relatively rare [22]. For the reasons mentioned above, we performed US and an image analysis technique (LKER) for fatty liver quantification. We used an open-source image-processing program called ImageJ, which was developed for use in scientific studies [14]. This has enabled a more objective and easier investigation of the associations between numerical data.
A previous study reported that the prevalence rate of insulin resistance evaluated using HOMA-IR in obese children was 29.1% [23]. Other studies reported higher prevalence rates [24,25]. NAFLD and MetS are closely associated phenomena with common characteristics; however, the cause–
effect relationship of these entities is complex and controversial [16,26-28]. Some studies reported that there is no positive correlation between HDL cholesterol, triglycerides, and fasting glucose and body composition indicators [23,29], whereas other studies reported contrasting results [30].
In our study, no correlation was found between the serum fT4, TSH, LDL, and cholesterol levels and LKER. Nevertheless, a statistically negative correlation was observed between LKER and HDL level, as well as between AWFT and HDL level. In addition, patients with grade 2 or higher hepatosteatosis (included in the HS-II group) had significantly higher cardiovascular disease risk, insulin resistance, and transaminase levels. However, there was no significant difference between the two groups (HS-I and HS-II) in terms of dyslipidemia findings, such as low HDL levels, hypertriglyceridemia, hypercholesterolemia, and high LDL levels.
In terms of hepatosteatosis in children, Shannon et al. [13] reported that serum transaminase levels were not correlated either with histological or classic ultrasonographic grading. Chan et al. [31] found high ALT levels in 29% of obese Chinese children with hepatic steatosis diagnosed with US and reported a strong positive relationship between the severity of fatty liver and the ALT levels. Another study emphasized that the severity of liver damage and liver disease increases with increasing degree of obesity [32]. A positive but weak correlation was observed between serum transaminase and glucose levels and LKER values in our study.
On the basis of histopathologically proven data, different cutoff points (1.24, 1.28, and 1.49) of the hepatorenal index for diagnosing fatty liver (>5%) on US examinations have been reported in different studies [33-36]. In this study, the LKER value of 10 patients (5.7%) was lower than the cutoff point (1.24) previously defined by Borges et al. [34]. This result suggests that some obese children may not have fatty liver. Alternatively, it can be inferred that below the aforementioned cutoff point, US has a low sensitivity for the detection of hepatosteatosis.
A previous histopathological study determined the optimal cutoff point of the hepatorenal index for the prediction of moderate steatosis (≥25%) to be 1.86 in adults [36]. A study with adult participants that included magnetic resonance spectroscopy with a 3-T system (as a reference quantitative method) reported the cutoff point to be 1.75 [35]. In our current study, after the comparison of the observers' classical grading and histogram data, the optimal cutoff point of LKER for the prediction of moderate-to-severe steatosis was determined to be 1.83 in obese children.
We found that hypertransaminasemia can be predicted with 73.3% sensitivity and 77.4%
specificity in patients with LKER ≥1.98. Thus, increased liver parenchymal echogenicity on gray-scale US may be interpreted to represent not only steatosis but also steatohepatitis.
Serum insulin levels and HOMA-IR values were also found to be statistically positively correlated with the BMI-Z scores and AWFT values. To our knowledge, the positive but weak relationship of AWFT and insulin level or AWFT and HOMA-IR value has not been previously reported in the literature.
Although a weak correlation was found between BMI-Z score and AWFT in our study, no statistically significant correlation was determined between LKER and BMI-Z score or LKER and AWFT. This is, in part, contrary to the expectation that the degree of hepatosteatosis also increases as the BMI-Z score increases. According to our observations, obese children may have a higher incidence of hepatosteatosis than normal-weight children, but the severity may vary individually.
Limitations of the study
The first limitation of this study was that because the US device does not have an elastography option, organ stiffness and possible concomitant fibrosis could not be measured. Second, some factors that may affect US imaging, such as right upper-quadrant thoraco-abdominal wall thickness, diaphragm thickness, capsules of the liver and kidney, and the liver–kidney interface angle, were considered constant [37]. Third, the hepatic size was not measured as a comparison parameter. Fourth, the classical grading of fatty liver was determined according to the consensus of two radiologists without interobserver variability determination. Fifth, we did not investigate waist circumference as a parameter with a possible relationship to other parameters such as AWFT. Finally, the blood pressure and waist circumference values of the patients were not measured as components of the MetS evaluation.
Despite the above-described limitations, the analyzed sonographic measurements can be used as noninvasive quantitative methods for the diagnosis and follow-up of obese children with moderate-to-severe hepatosteatosis. In this study, fatty liver in children was measured using quantitative B-mode US. However, better planned, more comprehensive studies including different quantitative US evaluations (e.g., attenuation coefficient, backscatter coefficient, and speed of sound), US elastography techniques, and magnetic resonance imaging methods (e.g., dual-echo, spectroscopy, and proton density fat fraction) are still required.
In conclusion, gray-level histogram data obtained by processing sonographic images are useful for the calculation of LKER, which is a noninvasive, radiation-free, and quantitative method for the assessment and screening of NAFLD in childhood obesity. AWFT can be considered a simple and useful sonographic parameter because of its association with insulin levels and HOMA-IR values. This parameter can be added to the routine US examination of obese children.
ACKNOWLEDGEMENTS
We thank Dr. Aksamoglu for his help in radiological image processing.
REFERENCES
1. Idilman IS, Ozdeniz I, Karcaaltincaba M. Hepatic steatosis: etiology, patterns, and quantification. Semin Ultrasound CT MR 2016;37:501-10.
PUBMED | CROSSREF
2. Saadeh S, Younossi ZM, Remer EM, Gramlich T, Ong JP, Hurley M, et al. The utility of radiological imaging in nonalcoholic fatty liver disease. Gastroenterology 2002;123:745-50.
PUBMED | CROSSREF
3. Ozturk A, Grajo JR, Gee MS, Benjamin A, Zubajlo RE, Thomenius KE, et al. Quantitative hepatic fat quantification in non-alcoholic fatty liver disease using ultrasound-based techniques: a review of literature and their diagnostic performance. Ultrasound Med Biol 2018;44:2461-75.
PUBMED | CROSSREF
4. Schwenzer NF, Springer F, Schraml C, Stefan N, Machann J, Schick F. Non-invasive assessment and quantification of liver steatosis by ultrasound, computed tomography and magnetic resonance. J Hepatol 2009;51:433-45.
PUBMED | CROSSREF
5. Lee SS, Park SH. Radiologic evaluation of nonalcoholic fatty liver disease. World J Gastroenterol 2014;20:7392-402.
PUBMED | CROSSREF
6. Di Lascio N, Avigo C, Salvati A, Martini N, Ragucci M, Monti S, et al. Steato-score: non-invasive quantitative assessment of liver fat by ultrasound imaging. Ultrasound Med Biol 2018;44:1585-96.
PUBMED | CROSSREF
7. Takahashi Y, Fukusato T. Histopathology of nonalcoholic fatty liver disease/nonalcoholic steatohepatitis.
World J Gastroenterol 2014;20:15539-48.
PUBMED | CROSSREF
8. Alswat KA, Fallatah HI, Al-Judaibi B, Elsiesy HA, Al-Hamoudi WK, Qutub AN, et al. Position statement on the diagnosis and management of non-alcoholic fatty liver disease. Saudi Med J 2019;40:531-40.
PUBMED | CROSSREF
9. Maklad NF, Ophir J, Balsara V. Attenuation of ultrasound in normal liver and diffuse liver disease in vivo.
Ultrason Imaging 1984;6:117-25.
PUBMED | CROSSREF
10. Shashaj B, Luciano R, Contoli B, Morino GS, Spreghini MR, Rustico C, et al. Reference ranges of HOMA- IR in normal-weight and obese young Caucasians. Acta Diabetol 2016;53:251-60.
PUBMED | CROSSREF
11. Keskin M, Kurtoglu S, Kendirci M, Atabek ME, Yazici C. Homeostasis model assessment is more reliable than the fasting glucose/insulin ratio and quantitative insulin sensitivity check index for assessing insulin resistance among obese children and adolescents. Pediatrics 2005;115:e500-3.
PUBMED | CROSSREF
12. Expert Panel on Integrated Guidelines for Cardiovascular Health and Risk Reduction in Children and Adolescents; National Heart, Lung, and Blood Institute. Expert panel on integrated guidelines for cardiovascular health and risk reduction in children and adolescents: summary report. Pediatrics 2011;128(Suppl 5):S213-56.
PUBMED | CROSSREF
13. Shannon A, Alkhouri N, Carter-Kent C, Monti L, Devito R, Lopez R, et al. Ultrasonographic quantitative estimation of hepatic steatosis in children With NAFLD. J Pediatr Gastroenterol Nutr 2011;53:190-5.
PUBMED | CROSSREF
14. Rasband WS, Image J. [Internet]. Bethesda (MD): U. S. National Institutes of Health; 2021 [cited 2021 Mar 12]. Available from: https://imagej.nih.gov/ij/
15. Neyzi O, Günöz H, Furman A, Bundak R, Gökçay G, Darendeliler F, et al. [Weight, height, head circumference and body mass index references for Turkish children]. Çocuk Sağlığı Hastalık Dergocuk Sagligi Hastalik Derg 2008;51:1-14. Turkish.
16. Ko JS. New perspectives in pediatric nonalcoholic fatty liver disease: epidemiology, genetics, diagnosis, and natural history. Pediatr Gastroenterol Hepatol Nutr 2019;22:501-10.
PUBMED | CROSSREF
17. Hernaez R, Lazo M, Bonekamp S, Kamel I, Brancati FL, Guallar E, et al. Diagnostic accuracy and reliability of ultrasonography for the detection of fatty liver: a meta-analysis. Hepatology 2011;54:1082-90.
PUBMED | CROSSREF
18. Ferraioli G, Soares Monteiro LB. Ultrasound-based techniques for the diagnosis of liver steatosis. World J Gastroenterol 2019;25:6053-62.
PUBMED | CROSSREF
19. Xia MF, Yan HM, He WY, Li XM, Li CL, Yao XZ, et al. Standardized ultrasound hepatic/renal ratio and hepatic attenuation rate to quantify liver fat content: an improvement method. Obesity (Silver Spring) 2012;20:444-52.
PUBMED | CROSSREF
20. Mancini M, Prinster A, Annuzzi G, Liuzzi R, Giacco R, Medagli C, et al. Sonographic hepatic-renal ratio as indicator of hepatic steatosis: comparison with (1)H magnetic resonance spectroscopy. Metabolism 2009;58:1724-30.
PUBMED | CROSSREF
21. Zhang B, Ding F, Chen T, Xia LH, Qian J, Lv GY. Ultrasound hepatic/renal ratio and hepatic attenuation rate for quantifying liver fat content. World J Gastroenterol 2014;20:17985-92.
PUBMED | CROSSREF
22. Soder RB, Baldisserotto M, Duval da Silva V. Computer-assisted ultrasound analysis of liver echogenicity in obese and normal-weight children. AJR Am J Roentgenol 2009;192:W201-5.
PUBMED | CROSSREF
23. Gobato AO, Vasques AC, Zambon MP, Barros Filho Ade A, Hessel G. Metabolic syndrome and insulin resistance in obese adolescents. Rev Paul Pediatr 2014;32:55-62.
PUBMED | CROSSREF
24. Souza MSF, Leme RB, Franco RR, Romaldini CC, Tumas R, Cardoso AL, et al. [Metabolic syndrome in obese and overweight adolescents]. Rev Paul Pediatr 2007;25:214-20. Portuguese.
CROSSREF
25. Juárez-López C, Klünder-Klünder M, Medina-Bravo P, Madrigal-Azcárate A, Mass-Díaz E, Flores-Huerta S. Insulin resistance and its association with the components of the metabolic syndrome among obese children and adolescents. BMC Public Health 2010;10:318.
PUBMED | CROSSREF
26. Horan M, Gibney E, Molloy E, McAuliffe F. Methodologies to assess paediatric adiposity. Ir J Med Sci 2015;184:53-68.
PUBMED | CROSSREF
27. D'Adamo E, Castorani V, Nobili V. The liver in children with metabolic syndrome. Front Endocrinol (Lausanne) 2019;10:514.
PUBMED | CROSSREF
28. Nobili V, Alisi A, Valenti L, Miele L, Feldstein AE, Alkhouri N. NAFLD in children: new genes, new diagnostic modalities and new drugs. Nat Rev Gastroenterol Hepatol 2019;16:517-30.
PUBMED | CROSSREF
29. Weiss R, Dziura J, Burgert TS, Tamborlane WV, Taksali SE, Yeckel CW, et al. Obesity and the metabolic syndrome in children and adolescents. N Engl J Med 2004;350:2362-74.
PUBMED | CROSSREF
30. Nasreddine L, Naja F, Tabet M, Habbal MZ, El-Aily A, Haikal C, et al. Obesity is associated with insulin resistance and components of the metabolic syndrome in Lebanese adolescents. Ann Hum Biol 2012;39:122-8.
PUBMED | CROSSREF
31. Chan DF, Li AM, Chu WC, Chan MH, Wong EM, Liu EK, et al. Hepatic steatosis in obese Chinese children. Int J Obes Relat Metab Disord 2004;28:1257-63.
PUBMED | CROSSREF
32. Seth A, Orkin S, Yodoshi T, Liu C, Fei L, Hardy J, et al. Severe obesity is associated with liver disease severity in pediatric non-alcoholic fatty liver disease. Pediatr Obes 2020;15:e12581.
PUBMED | CROSSREF
33. Marshall RH, Eissa M, Bluth EI, Gulotta PM, Davis NK. Hepatorenal index as an accurate, simple, and effective tool in screening for steatosis. AJR Am J Roentgenol 2012;199:997-1002.
PUBMED | CROSSREF
34. Borges VF, Diniz AL, Cotrim HP, Rocha HL, Andrade NB. Sonographic hepatorenal ratio: a noninvasive method to diagnose nonalcoholic steatosis. J Clin Ultrasound 2013;41:18-25.
PUBMED | CROSSREF
35. Martín-Rodríguez JL, Arrebola JP, Jiménez-Moleón JJ, Olea N, González-Calvin JL. Sonographic quantification of a hepato-renal index for the assessment of hepatic steatosis in comparison with 3T proton magnetic resonance spectroscopy. Eur J Gastroenterol Hepatol 2014;26:88-94.
PUBMED | CROSSREF
36. Webb M, Yeshua H, Zelber-Sagi S, Santo E, Brazowski E, Halpern Z, et al. Diagnostic value of a computerized hepatorenal index for sonographic quantification of liver steatosis. AJR Am J Roentgenol 2009;192:909-14.
PUBMED | CROSSREF
37. Chan V, Perlas A. Basics of ultrasound imaging. In: Narouze SN, ed. Atlas of ultrasound-guided procedures in interventional pain management. New York: Springer New York, 2011:13-9.