INTRODUCTION
Cancer antigen 125 (CA125) is widely used as a biomarker for evaluating disease status and monitoring the efficacy of chemo- therapy in patients with epithelial ovarian cancer (EOC). Parallel changes in CA125 levels and cancer growth have been reported in EOC. As a result, CA125 levels and changes in CA125 levels during treatment have been extensively investigated.
Previous studies demonstrate the prognostic or predictive val- ues of single values (e.g., nadirs, normalizations, or thresholds)1-6 or kinetic parameters on two time points, such as percentage decrease,7,8 half-life,9-12 or area-under-the curve (AUC).13
The Gynecologic Cancer Intergroup (GCIG) defined CA125 response as a 50% reduction in CA125 levels compared to that
Clinical Significance of CA125 Level after the First Cycle of Chemotherapy on Survival of Patients with Advanced Ovarian Cancer
Maria Lee1,2*, Min Young Chang3*, Hanna Yoo4, Kyung Eun Lee3, Doo Byung Chay3, Hanbyoul Cho3, Sunghoon Kim5, Young Tae Kim5, and Jae-Hoon Kim3
1Department of Obstetrics and Gynecology, Seoul National University College of Medicine, Seoul;
2Department of Obstetrics and Gynecology, Yonsei University Graduate School, Seoul;
3Department of Obstetrics and Gynecology, Gangnam Severance Hospital, Yonsei University College of Medicine, Seoul;
4Biostatistics Collaboration Lab, Yonsei University College of Medicine, Seoul;
5Department of Obstetrics and Gynecology, Institute of Women’s Medical Life Science, Severance Hospital, Yonsei University College of Medicine, Seoul, Korea.
Purpose: To determine the most powerful cancer antigen 125 (CA125)-related prognostic factor for advanced epithelial ovarian cancer (EOC) and to identify cut-off values that distinguish patients with a poor prognosis from those with a good prognosis.
Materials and Methods: We included 223 patients who received staging laparotomy and were diagnosed with stage IIC–IV serous EOC. Cox regression analysis was used to determine the most significant prognostic factor among the following variables: serum CA125 before surgery and after the first, second, and sixth cycles of chemotherapy; the nadir CA125 value; the relative percentage change in CA125 levels after the first and second cycles of chemotherapy compared to baseline CA125; CA125 half-life; time to nadir; and time to normalization of the CA125 level.
Results: The CA125 level after the first chemotherapy cycle was the most significant independent prognostic factor for overall survival (OS). Time to normalization (p=0.028) and relative percentage change between CA125 levels at baseline and after the first chemotherapy cycle (p=0.021) were additional independent prognostic factors in terms of OS. The CA125 level after the first che- motherapy cycle (p=0.001) and time to normalization (p<0.001) were identified as independent prognostic factors for progression free survival (PFS).
Conclusion: Among well-established CA125-related prognostic factors, serum CA125 levels after the first cycle of chemotherapy and time to normalization were the most significant prognostic factors for both OS and PFS.
Key Words: CA125, ovarian cancer, prognostic factor, tumour marker Yonsei Med J 2016 May;57(3):580-587
http://dx.doi.org/10.3349/ymj.2016.57.3.580 pISSN: 0513-5796 · eISSN: 1976-2437
Received: July 28, 2015 Revised: August 28, 2015 Accepted: September 24, 2015
Co-corresponding authors: Dr. Jae-Hoon Kim, Department of Obstetrics and Gynecology, Gangnam Severance Hospital, Yonsei University College of Medicine, 211 Eonju-ro, Gangnam-gu, Seoul 06273, Korea.
Tel: 82-2-2019-3436, Fax: 82-2-3462-8209, E-mail: [email protected] and Dr. Sunghoon Kim, Department of Obstetrics and Gynecology, Institute of Women’s Medical Life Science, Severance Hospital, Yonsei University College of Medicine, 50-1 Yonsei-ro, Seodaemun-gu, Seoul 03722, Korea.
Tel: 82-2-2228-2230, Fax: 82-2-313-8357, E-mail: [email protected]
*Maria Lee and Min Young Chang contributed equally to this work.
•The authors have no financial conflicts of interest.
© Copyright: Yonsei University College of Medicine 2016
This is an Open Access article distributed under the terms of the Creative Com- mons Attribution Non-Commercial License (http://creativecommons.org/licenses/
by-nc/3.0) which permits unrestricted non-commercial use, distribution, and repro- duction in any medium, provided the original work is properly cited.
of a pre-treatment sample; the response must be confirmed and maintained for at least 28 days.14 However, in a recent clin- ical trial, an early decline in CA125 levels was not a surrogate marker for the efficacy of pegylated liposomal doxorubicin with carboplatin.15 Lee, et al.8 analysed CA125 reductions in patients enrolled in this trial and reported paradoxical outcomes regard- ing the prognostic value of the GCIG-defined CA125 response.
Thus, previous outcomes about most useful value of CA125 remain controversial. The limited researches have investigat- ed the most reliable and significant method for anticipating survival outcomes among the numerous prediction methods that use CA125. Therefore, the optimal method for predicting patient prognosis remains unknown.
The objective of this study was to identify the most powerful CA125-related significant prognostic factors for patients with EOC. We compared known CA125-related prognostic factors and provided cut-off values that differentiated patients into subgroups of favorable and poor survival outcomes.
MATERIALS AND METHODS
Patient populations
Patients who underwent staging laparotomy at the Severance and Gangnam Severance Hospital between March 2004 and March 2013 were included in this study. Inclusion criteria were as follows: 1) serous histological type ovarian cancer; 2) ad- vanced International Federation of Gynecology and Obstetrics (FIGO) stage IIC–IV; 3) more than six cycles of taxane+platin- um-based first-line chemotherapy after primary debulking sur- gery; 4) serially measured CA125 values; and 5) clinical and radiological assessment during follow-up or recurrences. Fi- nally, the study included 223 patients. Elevated CA125 levels are found in >90% of patients with advanced-stage disease, but in only 50% of patients with stage I disease.16 Normal serum CA125 levels are occasionally found in mucinous or endome- trioid ovarian cancers, whereas elevated CA125 levels are most frequently observed in serous cancer.17 In this study, ad- vanced stage patients with serous EOC were included to en- sure a homogeneous study population. Patients with border- line malignancies treated with neoadjuvant chemotherapy and patients who did not receive staging laparotomy at Sever- ance or Gangnam Severance Hospitals were excluded.
All patients received standard staging and debulking sur- geries from gynecologic oncological specialists based on FIGO recommendations.18 The first cycle of a taxane plus platinum- based chemotherapy regimen was started an average of 17±10 days after surgery. Six to ten courses of postoperative adjuvant chemotherapy (POAC) were administered at approximately three-week intervals.
This study was approved by the Institutional Review Boards of Severance Hospital and Gangnam Severance Hospital. Some sera for CA125 assay were provided by Korea Gynecologic Can-
cer Bank through Bio & Medical Technology Development Program of the Ministry of Education, Science and Technolo- gy, Korea.
Clinicopathological characteristics
The following clinicopathological data were obtained from medical records: age, FIGO stage, histological type and grade, pathological result, type of primary treatment (type of surgery and adjuvant chemotherapy), surgical findings (mass size, as- cites volume, residual mass size), CA125 level, surgery date, chemotherapy cycle and date, recurrence date, date of last visit, and date of death.
Histologic slides were reviewed by gynecologic pathologists, and histologic types were identified according to World Health Organization (WHO) criteria.19 The histologic grades of well- differentiated, moderately differentiated, and poorly differenti- ated tumours were classified as grades 1, 2, and 3, respectively.
Operative mass size was classified as either <5 cm or ≥5 cm, and ascites volume was classified as either <500 or ≥500 mL. A residual mass <1 cm after primary surgery was defined as op- timal debulking surgery, whereas a residual mass of ≥1 cm was defined as suboptimal debulking surgery.
The treatment start date was defined as the date on which surgical staging was performed. The date of the last visit was defined as the date of the last recorded visit for the patient to ei- ther the gynaecology department or any other department. The recurrence date was defined as the date on which newly devel- oped lesions were confirmed by computed tomography (CT), positron emission tomography (PET)-CT, or magnetic reso- nance imaging (MRI) based on elevated CA125 levels or clinical exams.
Overall survival (OS) and progression free survival (PFS) rates were calculated from the date of the first treatment to the date of death (last visit for surviving patients) and from the date of the first treatment to the date of recurrence (last visit in the ab- sence of recurrence), respectively.
CA125 assay
Pre-operative serum CA125 levels were measured within two weeks of the first surgery and approximately three weeks after each chemotherapy cycle, which was 1–3 days before the begin- ning of the subsequent chemotherapy cycle. CA125 immunoas- says were performed using a Beckman DXI (Beckman Coulter, Inc., Brea, CA, USA) at Severance Hospital and a Modular Analyt- ics E170 (Roche Diagnostics, Indianapolis, IN, USA) at Gangnam Severance Hospital according to manufacturer recommenda- tions. All assays were performed in duplicate, and the reference range for normal CA125 levels was defined as ≤35 U/mL.
CA125 kinetics
The CA125 nadir was defined as the absolute lowest CA125 val- ue after the start of chemotherapy. The time to nadir was de- fined as the duration from the date of the first treatment to the
date of the minimum value.
CA125 half-life (T1/2) was calculated based on mono-com- partment models and exponential regression in accordance with earlier studies.20-22 For the regression line calculation, at least three serial and aligned ln CA125 concentrations were re- quired from the first six blood samples.
Half-life=ln 2/s,
in which was the slope of the regression curve that reflected the effects of surgery and chemotherapy.
S=ln C1-ln C2/t2-t1=ln C1/C2/t2-t1.
Therefore, half-life=ln 2×(t2-t1)/ln C1/C2.
C1 was the CA125 value before the first treatment, and C2 was the value at which CA125 decreased to <35 U/mL for the first time. If the CA125 level never decreased to <35 U/mL with- in three months of starting chemotherapy, the lowest value during that period was selected. The times (in days) for C1 and C2 were given as t1 and t2, respectively.
Statistical analysis
Univariate and multivariate Cox model analyses were used to investigate the effects of each clinicopathological prognostic factor on OS and PFS. For the statistical analysis of CA125-re- lated prognostic factors, univariate Cox regression analysis was first performed with each variable and statistically significant variables were selected. Multivariate Cox regression analysis using stepwise selection was performed, and the most signifi- cant indicator of OS and PFS was then determined. Two meth- ods were utilized for determining optimal cut-off values of
each variable. First, the cut-off values that showed statistically significant outcomes regarding OS and PFS in earlier studies were used for the variables of pre-operative CA125, CA125 lev- els after the first and second chemotherapy cycles, time to nor- malization, and relative percentage change in CA125.4,10,20,23 Second, for the variables of nadir, time to nadir, CA125 half- life, and CA125 levels after the sixth chemotherapy cycle, the median was used to determine the cut-off value, because it was useful for dividing the group into two parts. Receiver operat- ing characteristic analysis revealed a low AUC without signifi- cance when death or recurrence was selected as an event. Con- sequently, the cut-off values were as follows: pre-operative CA125 levels, 500 U/mL; CA125 levels after the first and sec- ond chemotherapy cycles, 35 U/mL; CA125 levels after the sixth chemotherapy cycle, 9 U/mL; CA125 levels at nadir, 8 U/
mL; time to nadir, 160 days; time to normalization, third cycle;
CA125 half-life, three days; and CA125 relative percentage change, 71%.
Statistical analyses were performed with the software pack- age IBM SPSS Version 20.0 (SPSS Inc., Chicago, IL, USA). For all tests, all p values were two-sided, and p<0.05 was consid- ered statistically significant.
RESULTS
Patient demographics
Two hundred and twenty-three patients who met the inclu-
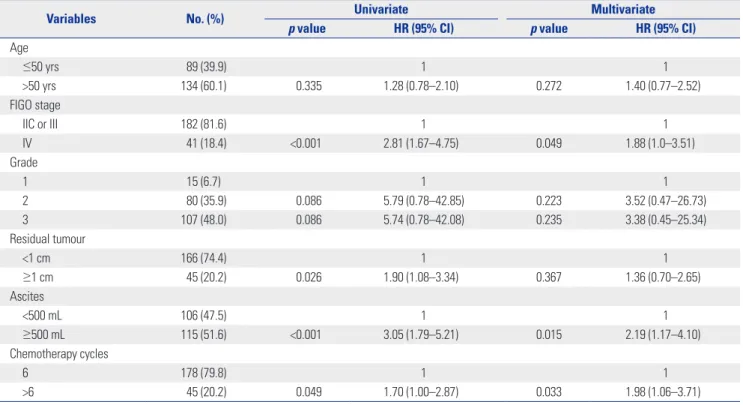
Table 1. Univariate and Multivariate Cox Model Analyses of Clinicopathological Characteristics for Overall Survival (n=223)
Variables No. (%) Univariate Multivariate
p value HR (95% CI) p value HR (95% CI)
Age
≤50 yrs 89 (39.9) 1 1
>50 yrs 134 (60.1) 0.335 1.28 (0.78–2.10) 0.272 1.40 (0.77–2.52)
FIGO stage
IIC or III 182 (81.6) 1 1
IV 41 (18.4) <0.001 2.81 (1.67–4.75) 0.049 1.88 (1.0–3.51)
Grade
1 15 (6.7) 1 1
2 80 (35.9) 0.086 5.79 (0.78–42.85) 0.223 3.52 (0.47–26.73)
3 107 (48.0) 0.086 5.74 (0.78–42.08) 0.235 3.38 (0.45–25.34)
Residual tumour
<1 cm 166 (74.4) 1 1
≥1 cm 45 (20.2) 0.026 1.90 (1.08–3.34) 0.367 1.36 (0.70–2.65)
Ascites
<500 mL 106 (47.5) 1 1
≥500 mL 115 (51.6) <0.001 3.05 (1.79–5.21) 0.015 2.19 (1.17–4.10)
Chemotherapy cycles
6 178 (79.8) 1 1
>6 45 (20.2) 0.049 1.70 (1.00–2.87) 0.033 1.98 (1.06–3.71)
FIGO, International Federation of Gynecology and Obstetrics; CI, confidence interval; HR, hazard ratio.
sion criteria were included in this study. Patient characteristics and the results of survival analysis regarding the clinicopatho- logical variables are shown in Table 1. The median patient age was 53 years (range, 25–81 years). Most (75.8%) patients had stage IIIC cancer; 80 patients (35.9%) were grade 2, and 107 pa- tients (48.0%) were grade 3 at the time of diagnosis. One hun- dred and sixty-six patients (74.4%) received optimal debulking surgery, and 45 patients (20.2%) had residual tumours >1 cm.
One hundred and seventy-eight patients (79.8%) received six cycles of taxane+platinum-based POAC, and 45 patients (20.2%) received seven to ten cycles. Univariate analysis showed that stage, largest diameter of residual tumour, ascites volume, and number of POAC cycles were prognostic factors for OS. Multi- variate analysis showed that stage, ascites volume, and num- ber of POAC cycles were prognostic factors for OS.
Distribution of CA125-related parameters
In the present study, the median pre-operative CA125 value in patients with stage IIC–IV serous ovarian cancer was 787.8 U/
mL (range, 13.0–12001.0 U/mL), and CA125 median values af- ter the first, second, and sixth chemotherapy cycles were 43.4 (range, 6.6–2677.2), 17.1 (range, 5.1–3954.5), and 8.8 (range, 2.2–9845.5) U/mL, respectively. The median CA125 nadir lev- el was 7.9 U/mL (range, 2.0–2677.2 U/mL), median time to nadir was 165.0 days (range, 37.0–929.0 days), and median CA125 half-life was 3.1 days (range, 1.5–188.4 days). The me- dian relative percentage change in CA125 compared to that at
baseline after the first and second chemotherapy cycles were 91.7% and 96.8%, respectively.
Prognostic impact of CA125-related variables
Survival analyses were performed for the following 10 criteria:
1) pre-operative CA125 level; CA125 levels after the 2) first, 3) second, and 4) sixth chemotherapy cycles; 5) nadir; 6) time to nadir; 7) time to normalization; 8) half-life; and the relative percentage change from baseline to the 9) first and 10) second cycles of chemotherapy.
Each variable was divided into two groups based on the pre- viously mentioned method.
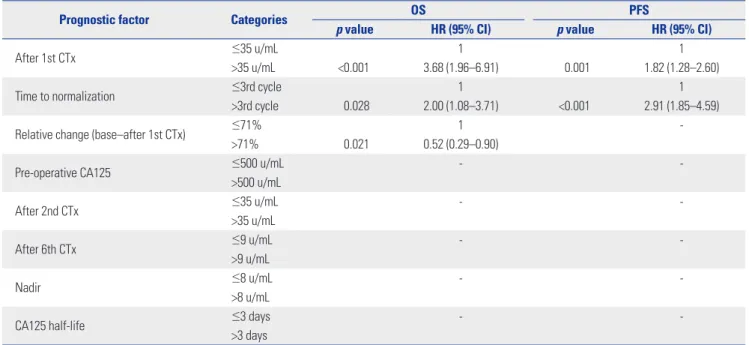
Univariate Cox regression showed that seven variables [pre- operative CA125 level, CA125 levels after the first, second, and sixth chemotherapy cycles, nadir, time to normalization, and relative percentage change (baseline to after first chemotherapy cycle)] were significant prognostic factors for OS; six variables [pre-operative CA125 level, CA125 levels after the first and sec- ond chemotherapy cycles, time to normalization, half-life, rela- tive percentage change (baseline to after first chemotherapy cycle)] were significant prognostic factors for PFS (Table 2).
To determine the most significant prognostic factors for OS and PFS, multivariate Cox regression, using stepwise regres- sion techniques was performed with the variables that showed significant outcomes in univariate analysis. As a result, the CA125 level measured after the first chemotherapy cycle, time to CA125 normalization, and relative percentage change of
Table 2. Univariate Analysis of CA125-related Prognostic Factors for Overall Survival and Progression Free Survival
Prognostic factor Categories OS PFS
p value HR (95% CI) p value HR (95% CI)
Pre-operative CA125 ≤500 u/mL 1 1
>500 u/mL 0.011 1.94 (1.17–3.24) 0.002 1.68 (1.22–2.31)
After 1st CTx ≤35 u/mL 1 1
>35 u/mL <0.001 4.46 (2.49–7.99) <0.001 2.30 (1.66–3.19)
After 2nd CTx ≤35 u/mL 1 1
>35 u/mL <0.001 2.85 (1.74–4.66) <0.001 2.65 (1.88–3.73)
After 6th CTx ≤9 u/mL 1 1
>9 u/mL 0.008 1.93 (1.19–3.15) 0.47 1.38 (1.00–1.88)
Nadir ≤8 u/mL 1 1
>8 u/mL 0.028 1.69 (1.06–2.68) 0.53 1.35 (1.00–1.84)
Time to nadir ≤160 days 1 1
>160 days 0.177 0.73 (0.46–1.16) 0.068 0.75 (0.55–1.02)
Time to normalization ≤3rd cycle 1 1
>3rd cycle <0.001 3.57 (2.00–6.38) <0.001 3.84 (2.50–5.88)
CA125 half-life ≤3 days 1 1
>3 days 0.129 0.70 (0.44–1.11) 0.021 0.70 (0.51–0.95)
Relative change (base–after 1st CTx) >71% 1 1
≤71% 0.001 0.42 (0.25–0.71) 0.031 0.66 (0.45–0.96)
Relative change (base–after 2nd CTx) >71% 1 1
≤71% 0.700 0.86 (0.39–1.87) 0.126 1.61 (0.88–2.98)
OS, overall survival; PFS, progression free survival; CI, confidence interval; HR, hazard ratio; CTx, chemotherapy; CA125, cancer antigen 125.
CA125, compared to that at baseline after the first chemother- apy cycle, were sequentially selected for OS; time to CA125 normalization followed by CA125 level after the first chemo- therapy cycle was selected for PFS (Table 3).
The CA125 level measured after the first chemotherapy cy- cle was selected as the most significant factor for OS and the second most significant prognostic factor for PFS, and was di- vided into two groups by the cut-off value of 35 U/mL. Kaplan- Meier analysis was then performed. The five-year OS rates were 87.4% and 56.9% for patients with CA125 levels ≤35 U/
mL and >35 U/mL, respectively, after the first chemotherapy
cycle (p<0.001). The prognosis for two-year PFS manifested differences of 69.7% and 36.7%, respectively (p<0.001) (Fig. 1).
Kaplan-Meier analysis of the time to normalization, which was selected as the second highest factor for OS and the most sig- nificant prognostic factor for PFS, determined that patients who did not show normal CA125 values within three chemothera- py cycles had significantly unfavourable OS and PFS (five-year OS: 50.1%, two-year PFS: 22.2%) compared to that in patients who demonstrated normal CA125 values (five-year OS: 73.4%, two-year PFS: 55.0%) (p<0.001) (Fig. 2).
Table 3. Multivariate Analysis of CA125-Related Prognostic Factors for Overall Survival and Progression Free Survival
Prognostic factor Categories OS PFS
p value HR (95% CI) p value HR (95% CI)
After 1st CTx ≤35 u/mL 1 1
>35 u/mL <0.001 3.68 (1.96–6.91) 0.001 1.82 (1.28–2.60)
Time to normalization ≤3rd cycle 1 1
>3rd cycle 0.028 2.00 (1.08–3.71) <0.001 2.91 (1.85–4.59)
Relative change (base–after 1st CTx) ≤71% 1 -
>71% 0.021 0.52 (0.29–0.90)
Pre-operative CA125 ≤500 u/mL - -
>500 u/mL
After 2nd CTx ≤35 u/mL - -
>35 u/mL
After 6th CTx ≤9 u/mL - -
>9 u/mL
Nadir ≤8 u/mL - -
>8 u/mL
CA125 half-life ≤3 days - -
>3 days
OS, overall survival; PFS, progression free survival; CI, confidence interval; HR, hazard ratio; CTx, chemotherapy; CA125, cancer antigen 125.
Fig. 1. Kaplan-Meier survival plot for overall survival and progression free survival according to CA125 after 1st cycle of chemotherapy. CA125, cancer antigen 125.
1.0
0.8
0.6
0.4
0.2
0.0
Overall survival (months) 1st cycle CA125 ≤35 u/mL 1st cycle CA125 >35 u/mL
0 50 100 150
Estimated survival function
1.0
0.8
0.6
0.4
0.2
0.0
Progression free survival (months) 1st cycle CA125 ≤35 u/mL 1st cycle CA125 >35 u/mL
0 20 40 60 80 100 120 140
Estimated survival function
DISCUSSION
The main finding of this study was that serum CA125 levels
≤35 U/mL after the first cycle of chemotherapy and normaliza- tion of CA125 levels within three cycles of chemotherapy were the most significant prognostic factors for both OS and PFS.
Until now, an alternative to CA125 has not been identified for screening and monitoring EOC or for use as a prognostic indi- cator. Therefore, many studies continue to investigate the rela- tionship between CA125 and ovarian cancer prognosis.
The predictive and prognostic values of baseline CA125 con- centrations, which are measured before initiating treatment, have been previously described.24-26 However, CA125 has limit- ed applications in all stages of EOC, as 7.6% of patients with ad- vanced EOC show normal CA125 levels (< or =35 U/mL).24 An- other major limitation of this simple approach is that baseline values measured before the initiation of treatment do not in- tegrate the effect of treatment on subsequent CA125 titers.
CA125 normalization at the end of six chemotherapy cycles was reported as a predictive factor in Gynecology Oncology Group trials5 and during the third cycle in two other studies.4,27 These results are consistent with our main results. Similar conclusions have also been made regarding the value of CA125 normalization after neoadjuvant chemotherapy in patients with advanced ovarian cancer.28,29 The nadir has been used to analyse the kinetics of CA125 in ovarian cancer patients,6,12,30,31 but the reported thresholds are inconsistent. Furthermore, it should be noted that the predicted level of decrease in CA125 percentages has been reported in metastatic ovarian cancer patients.23,32-34 In 2004, the GCIC defined a CA125 response to treatment as a 50% reduction in CA125 levels maintained for at least 28 days.7 However, in the CALYPSO trial, an early de- cline in CA125 was more frequent in the detrimental arm,8 and the reproducibility of the surrogate values for the percentage
decrease remains debatable.
The aim of this study was to determine the most significant and reliable prognostic factors for OS and PFS among the known CA125-related prognostic factors and to provide cut-off values that reflect differences in prognosis when subdivided into two groups. To investigate if this trend was similar to pre- viously reported trends, univariate analysis of 10 factors was performed in the patients included in this study. Statistically significant outcomes were obtained for eight factors except for time to nadir and relative percentage change between base- line and after the second chemotherapy cycle.
Because the cut-off CA125 level after the first chemotherapy cycle was 35 U/mL and the time to normalization was the third cycle, two checkpoints should be considered when evaluating the prognosis of patients with advanced ovarian cancer after debulking surgery and POAC. First, the CA125 level after the first chemotherapy cycle (≤35 or >35 U/mL) can primarily classify good prognosis versus poor prognosis. CA125 levels in the normal range after the third chemotherapy cycle may allow clinicians to predict patient prognosis. In contrast to CA125 kinetics, such as relative percentage change, half-life, and time to nadir, the CA125-related prognostic factors confirmed in this study are convenient and can determine whether the CA125 levels after the first and third chemotherapy cycles are less than the normal reference value of 35 U/mL. Therefore, when pa- tients have a poor prognosis according to the two checkpoints, chemotherapy dose, interval, cycle number, and regimen sho- uld be reviewed.
This study had several limitations. First, the retrospective nature of the study and potential selection bias might have af- fected our results. Second, due to a high percentage of patients without a confirmed pre-chemotherapy CA125 level, pre-che- motherapy CA125 was not included as a variable in this study.
However, through multivariate analysis in a multicentre retro- Fig. 2. Kaplan-Meier survival plot for overall survival and progression free survival according to the timing of normalization of CA125. CA125, cancer antigen 125.
1.0
0.8
0.6
0.4
0.2
0.0
1.0
0.8
0.6
0.4
0.2
0.0
Overall survival (months) Progression free survival (months)
Time to normal ≤3rd cycle Time to normal ≤3rd cycle
Time to normal >3rd cycle Time to normal >3rd cycle
0 50 100 150 0 20 40 60 80 100 120 140
Estimated survival function Estimated survival function
spective study with 494 subjects, Riedinger, et al.23 determined that patients with normal baseline CA125 levels or patients who showed a >50% decrease to <35 U/mL before the second chemotherapy cycle had a favourable prognosis. The above authors observed, statistically significant differences in prog- nosis, confirming that this was the most significant prognostic factor; consistent with our present results.
In conclusion, absolute CA125 levels measured after the first chemotherapy cycle (cut-off value: 35 U/mL) and normaliza- tion of CA125 levels up to the third chemotherapy cycle were the most significant prognostic factors for predicting OS and PFS in patients with advanced serous ovarian cancer. There- fore, during first-line chemotherapy, subsets of patients can be predicted to have poor prognosis by routinely measuring CA125 levels. Based on these analyses, treatment plans can be changed to improve patient prognosis. Finally, a reasonable study might randomize patients with EOC whose serum CA125 levels fail to normalize after the initial three chemotherapy cy- cles to either continued platinum or taxane chemotherapy or to a ‘novel’ antineoplastic regimen whose composition re- mains to be determined.
ACKNOWLEDGEMENTS
We thank Jae Hyon Park (Undergraduate student, Yonsei Uni- versity College of Medicine, Seoul, Korea) for proofreading the English in this manuscript.
REFERENCES
1. Krivak TC, Tian C, Rose GS, Armstrong DK, Maxwell GL. A Gyne- cologic Oncology Group study of serum CA-125 levels in patients with stage III optimally debulked ovarian cancer treated with in- traperitoneal compared to intravenous chemotherapy: an analy- sis of patients enrolled in GOG 172. Gynecol Oncol 2009;115:81-5.
2. Micha JP, Goldstein BH, Rettenmaier MA, Brown JV 3rd, John CR, Markman M. Clinical utility of CA-125 for maintenance therapy in the treatment of advanced stage ovarian carcinoma. Int J Gyne- col Cancer 2009;19:239-41.
3. Richardson DL, Seamon LG, Carlson MJ, O’Malley DM, Fowler JM, Copeland LJ, et al. CA125 decline in ovarian cancer patients treated with intravenous versus intraperitoneal platinum-based chemotherapy. Gynecol Oncol 2008;111:233-6.
4. Rocconi RP, Matthews KS, Kemper MK, Hoskins KE, Huh WK, Straughn JM Jr. The timing of normalization of CA-125 levels dur- ing primary chemotherapy is predictive of survival in patients with epithelial ovarian cancer. Gynecol Oncol 2009;114:242-5.
5. Tian C, Markman M, Zaino R, Ozols RF, McGuire WP, Muggia FM, et al. CA-125 change after chemotherapy in prediction of treat- ment outcome among advanced mucinous and clear cell epitheli- al ovarian cancers: a Gynecologic Oncology Group study. Cancer 2009;115:1395-403.
6. Prat A, Parera M, Peralta S, Perez-Benavente MA, Garcia A, Gil- Moreno A, et al. Nadir CA-125 concentration in the normal range as an independent prognostic factor for optimally treated ad- vanced epithelial ovarian cancer. Ann Oncol 2008;19:327-31.
7. Rustin GJ. Can we now agree to use the same definition to mea-
sure response according to CA-125? J Clin Oncol 2004;22:4035-6.
8. Lee CK, Friedlander M, Brown C, Gebski VJ, Georgoulopoulos A, Vergote I, et al. Early decline in cancer antigen 125 as a surrogate for progression-free survival in recurrent ovarian cancer. J Natl Cancer Inst 2011;103:1338-42.
9. Colakovic´ S, Lukiç V, Mitroviç L, Jeliç S, Susnjar S, Marinkoviç J.
Prognostic value of CA125 kinetics and half-life in advanced ovar- ian cancer. Int J Biol Markers 2000;15:147-52.
10. Gadducci A, Cosio S, Fanucchi A, Negri S, Cristofani R, Genazzani AR. The predictive and prognostic value of serum CA 125 half-life during paclitaxel/platinum-based chemotherapy in patients with advanced ovarian carcinoma. Gynecol Oncol 2004;93:131-6.
11. Riedinger JM, Eche N, Basuyau JP, Dalifard I, Hacene K, Pichon MF. Prognostic value of serum CA 125 bi-exponential decrease during first line paclitaxel/platinum chemotherapy: a French multicentric study. Gynecol Oncol 2008;109:194-8.
12. Riedinger JM, Wafflart J, Ricolleau G, Eche N, Larbre H, Basuyau JP, et al. CA 125 half-life and CA 125 nadir during induction che- motherapy are independent predictors of epithelial ovarian can- cer outcome: results of a French multicentric study. Ann Oncol 2006;17:1234-8.
13. Mano A, Falcão A, Godinho I, Santos J, Leitão F, Oliveira C, et al.
CA-125 AUC as a new prognostic factor for patients with ovarian cancer. Gynecol Oncol 2005;97:529-34.
14. Rustin GJ, Quinn M, Thigpen T, du Bois A, Pujade-Lauraine E, Jako- bsen A, et al. Re: new guidelines to evaluate the response to treat- ment in solid tumors (ovarian cancer). J Natl Cancer Inst 2004;96:
487-8.
15. Pujade-Lauraine E, Wagner U, Aavall-Lundqvist E, Gebski V, Hey- wood M, Vasey PA, et al. Pegylated liposomal doxorubicin and car- boplatin compared with paclitaxel and carboplatin for patients with platinum-sensitive ovarian cancer in late relapse. J Clin Oncol 2010;28:3323-9.
16. Nustad K, Bast RC Jr, Brien TJ, Nilsson O, Seguin P, Suresh MR, et al.
Specificity and affinity of 26 monoclonal antibodies against the CA 125 antigen: first report from the ISOBM TD-1 workshop. Interna- tional Society for Oncodevelopmental Biology and Medicine. Tu- mour Biol 1996;17:196-219.
17. Høgdall EV, Christensen L, Kjaer SK, Blaakaer J, Kjaerbye-Thygesen A, Gayther S, et al. CA125 expression pattern, prognosis and correla- tion with serum CA125 in ovarian tumor patients. From the danish
“MALOVA” ovarian cancer study. Gynecol Oncol 2007;104:508-15.
18. Changes in definitions of clinical staging for carcinoma of the cer- vix and ovary: International Federation of Gynecology and Obstet- rics. Am J Obstet Gynecol 1987;156:263-4.
19. Böcker W. [WHO classification of breast tumors and tumors of the female genital organs: pathology and genetics]. Verh Dtsch Ges Pathol 2002;86:116-9.
20. Gadducci A, Zola P, Landoni F, Maggino T, Sartori E, Bergamino T, et al. Serum half-life of CA 125 during early chemotherapy as an in- dependent prognostic variable for patients with advanced epitheli- al ovarian cancer: results of a multicentric Italian study. Gynecol Oncol 1995;58:42-7.
21. Buller RE, Berman ML, Bloss JD, Manetta A, DiSaia PJ. CA 125 re- gression: a model for epithelial ovarian cancer response. Am J Ob- stet Gynecol 1991;165:360-7.
22. Buller RE, Berman ML, Bloss JD, Manetta A, DiSaia PJ. Serum CA125 regression in epithelial ovarian cancer: correlation with re- assessment findings and survival. Gynecol Oncol 1992;47:87-92.
23. Riedinger JM, Bonnetain F, Basuyau JP, Eche N, Larbre H, Dalifard I, et al. Change in CA 125 levels after the first cycle of induction chemotherapy is an independent predictor of epithelial ovarian tumour outcome. Ann Oncol 2007;18:881-5.
24. Paramasivam S, Tripcony L, Crandon A, Quinn M, Hammond I, Marsden D, et al. Prognostic importance of preoperative CA-125 in International Federation of Gynecology and Obstetrics stage I epi- thelial ovarian cancer: an Australian multicenter study. J Clin On- col 2005;23:5938-42.
25. Vorgias G, Iavazzo C, Savvopoulos P, Myriokefalitaki E, Katsoulis M, Kalinoglou N, et al. Can the preoperative Ca-125 level predict opti- mal cytoreduction in patients with advanced ovarian carcinoma? A single institution cohort study. Gynecol Oncol 2009;112:11-5.
26. Zorn KK, Tian C, McGuire WP, Hoskins WJ, Markman M, Muggia FM, et al. The prognostic value of pretreatment CA 125 in patients with advanced ovarian carcinoma: a Gynecologic Oncology Group study. Cancer 2009;115:1028-35.
27. Wong C, Dai ZM, Lele SB, Natarajan N. Comparison of CA 125 after three courses of chemotherapy and results of second-look surgery.
Eur J Gynaecol Oncol 2000;21:70-3.
28. Le T, Faught W, Hopkins L, Fung-Kee-Fung M. Importance of CA125 normalization during neoadjuvant chemotherapy followed by planned delayed surgical debulking in patients with epithelial ovarian cancer. J Obstet Gynaecol Can 2008;30:665-70.
29. Tate S, Hirai Y, Takeshima N, Hasumi K. CA125 regression during
neoadjuvant chemotherapy as an independent prognostic factor for survival in patients with advanced ovarian serous adenocarci- noma. Gynecol Oncol 2005;96:143-9.
30. Kang S, Seo SS, Park SY. Nadir CA-125 level is an independent prognostic factor in advanced epithelial ovarian cancer. J Surg Oncol 2009;100:244-7.
31. Liu PY, Alberts DS, Monk BJ, Brady M, Moon J, Markman M. An early signal of CA-125 progression for ovarian cancer patients re- ceiving maintenance treatment after complete clinical response to primary therapy. J Clin Oncol 2007;25:3615-20.
32. Rustin GJ, Nelstrop AE, McClean P, Brady MF, McGuire WP, Hoskins WJ, et al. Defining response of ovarian carcinoma to initial chemotherapy according to serum CA 125. J Clin Oncol 1996;14:
1545-51.
33. Bhoola SM, Coleman RL, Herzog T, Morris R, Bryant C, Estes JM, et al. Retrospective analysis of weekly topotecan as salvage thera- py in relapsed ovarian cancer. Gynecol Oncol 2004;95:564-9.
34. Bodnar L, Wcislo G, Nasilowska A, Szarlej-Wcislo K, Gasowska- Bodnar A, Smoter M, et al. Salvage therapy with topotecan in heav- ily pretreated ovarian cancer patients. J Cancer Res Clin Oncol 2009;135:815-21.