Vol.20, No.3, (2018), pp.28~33 https://doi.org/10.9714/psac.2018.20.3.028
1. INTRODUCTION
As electric power demands increase rapidly in urban areas, it is necessary to reduce transmission loss and increase grid stability. Thus, a HTS power cable is considered as a feasible option for future electric power transmission. Over the past 10 years, several cable companies have completed technical development through various demonstration projects on the HTS power cables and recently they are trying to commercialize the HTS power cables over several kilometers in a real grids [1–7].
HTS power cables are usually cooled below operating temperature using circulation of subcooled liquid nitrogen [5–7]. Thus, a cooling system for the HTS power cable is composed of a cryogenic refrigerator, a heat exchanger, a cryogenic pump, etc.
For the demonstration of a HTS power cable, the length was usually less than 1 km, and a cryogenic pump with small differential pressure and mass flow rate could be used [8–12]. Yet, for the commercialization of the HTS power cable over several kilometers, a larger cryogenic pump is required.
In case of the cryogenic pumps for HTS power cables, most of them are imported at high price from abroad and there is a lack of domestic research efforts on the pump for HTS power cables [8], [13–15]. In addition, the cryogenic pump usually requires a cold bearing. The conventional contact-type bearing has lubrication problem and it decreases the maintenance period. To avoid the problem, a
non-contact type bearing such as magnetic and air bearings are considered with high price [16–19].
Thus, it is necessary to develop a high-efficient and reliable domestic cryogenic pump for HTS power cables over several kilometers removing the lubrication problems at the cold bearing. As the cable length increases, the pressure loss and required mass flow rate also increase. In addition, it is necessary to minimize heat ingress from ambient and increase the efficiency of the pump to reduce the cooling cost of the HTS power cable system.
In this paper, we designed, constructed, and tested a cryogenic pump without a cold bearing to generate nominal flow rate of 1.2 kg/s and pressure difference of 5 bar, which is applicable for HTS power cables of several kilometers or more. To satisfy the pump performance, the impeller and volute were designed and the hydraulic performance was investigated using CFD (Computational Fluid Dynamics) analysis. After fabricating the pump, its performance such as pressure heads, mass flow rates and efficiencies were assessed using a laboratory’s cryogenic pumps test facility.
2. DESIGN AND PERFORMANCE ANALYSIS OF CRYOGENIC PUMP
2.1. Design of Centrifugal Pump
In the design of a single stage pump, the shape and size of the impeller are determined using specific speed (ns) - specific diameter (ds) graph [20–22]. The target design specifications are mass flow rate of 1.2 kg/s and pressure difference of 5 bar at 9,000 rpm. In order to determine the
Development and performance test of a liquid nitrogen circulation pump for HTS power cable
Jihoon Seoka, Dongmin Kima, Changhyeong Leea, Manryeol Kimb, Jeongdong Choic, and Seokho Kima,*
a Changwon National University, Changwon, Korea
b OZ INDUSTRY, Changwon, Korea
c Hi-tech, Changwon, Korea
(Received 17August 2018; revised or reviewed 20 September 2018; accepted 21 September 2018)
Abstract
With the continuous performance improvement and commercialization of HTS wires, there have been many efforts to commercialize HTS power cables recently. Unlike conventional power cables, a cryogenic cooling system is required for a HTS power cable and a cryogenic pump is one of the essential components to circulate subcooled liquid nitrogen and cool the HTS power cable. Especially, the development of a reliable and high-efficiency cryogenic pump is an important issue for the commercialization of HTS power cables of several kilometers or more. In this study, we designed and fabricated a cryogenic pump for subcooled liquid nitrogen with a mass flow rate of 1.2 kg/s, a differential pressure of 5 bar, and evaluated the hydraulic performance of the pump. Impeller design was conducted to meet the target design performance with 1 D analysis model and CFD analysis. The pump performance parameters such as pressure heads, mass flow rates, and efficiencies in accordance with rotating speeds were assessed using a laboratory's performance evaluation system.
Keywords: cryogenic, HTS power cable, subcooled liquid nitrogen, circulation pump, impeller, efficiency
* Corresponding author: [email protected]
Fig. 1. ns - ds diagram for single stage pumps [13].
type and shape of the impeller, ns of the impeller is calculated from the equation
ad34
s gH
n V (1)
where ω, V, g and Had are the rotational speed of the impeller in rad/s, the volumetric flow rate of the working fluid, the gravitational acceleration and the pressure head of pump, respectively.
Once ns is determined, the type and optimum ds is obtained using ns-ds graph in Fig. 1 to have the maximum efficiency η. The rotating speed was determined at 9,000 rpm, taking into account the operating range of commonly used induction motors, and the resultant ns is 0.258. In this case, it is expected that ds of 9.43 will give the maximum efficiency of about 70 % with a radial type.
The impeller diameter D is related with ds as in (2) and ds
of 9.43 corresponds to D of 65 mm.
V gH d
sD
ad4 1
(2)In case of radial pumps, the vane end angle of 20 to 25°
is usually used and it determines the height of the impeller
Fig. 2. Velocity diagram of centrifugal pump [13–15].
TABLE 1
DESIGN SPECIFICATIONS AND DESIGN RESULTS OF IMPELLER.
Parameter Value
Differential pressure [bar] 5
Mass flow rate [kg/s] 1.2
Had [m] 72.96
V [m3/s] 0.00143
ω [rpm] 9,000
ns 0.258
ds 9.43
Design D [mm] 69
Number of Vane 6
Vane end angle [°] 22.5
Vane height [mm] 5.6
exit end to meet the prescribed pressure head and flow rate.
In this study, the impeller vane end-angle was selected as 22.5 ° and six vanes were considered.
Fig. 2 shows the speed vector diagram of the centrifugal pump used to determine the height of the impeller. Each velocity component is as follows: U is the tangential speed of impeller given by ωD/2; W is the relative speed of fluid with respect to the rotating frame; Wx is a tangential component of W; C is the absolute velocity of fluid; Cx is tangential component C; Cr is radial component of C; β is the vane end angle; T is the torque of impeller.
First, assuming that the inlet velocity is perpendicular to rotating direction, the simplified Euler head Had can be expressed by Euler pump equation [20]
/ /
ad x
H E mgUC g ( 3 ) where E is the work done on the fluid and
m
is the mass flow rate. Wx is determined by using β and Cr from the velocity diagram in Fig. 2 and by subtracting Wx from U, we obtaintan
r
x x
C U W U C
(4) Cr and vane height b are related to the volume flow rate Q as in (5)
b rC
Q2 r (5) Rearranging the (3) ~ (5), Euler head in (3) can be expressed by
tan 2 tan
r ad
C
U U Q
H U U
g g rb
(6)
Then, the vane height is can be obtained using (7) to meet the design specifications and it was found to be 5.4 mm.
2
1
2 tan ad
b UQ
r U gH
(7)
Table 1 summarizes the design specifications and design results of the impeller.
TABLE 2
FLOW ANALYSIS PARAMETERS OF IMPELLER AND VOLUTE.
Parameter Value
Flow rate [kg/s] 1.0~1.6
Rotating speed [rpm] 9,000
Working fluid Liquid nitrogen
Density [kg/m3] 838
Mesh nodes (impeller) 2,154,984 Mesh elements (impeller) 1,966,224
Mesh nodes (volute) 338,034
Mesh elements (volute) 308,130
Shroud clearance [mm] 0.1
Surface condition Smooth surface
Turbulence model k-
Inlet
Inlet temperature 70 K Inlet total pressure 5 bar Outlet mass flow rate 1.2 kg/s Rotating speed 9,000 rpm
Fig. 3. 3D CFD model for flow analysis.
2.2. Flow analysis of cryogenic pump
The theoretical design results provide the shape of the impeller, but in actual pumps, the differential pressure and flow rate are reduced by mechanical loss, casing loss and impeller loss. Therefore, the actual pump diameter was increased to be 74 mm, which was about 15 % higher than the theoretical design result to meet the target performance.
To investigate the pump performance including various loss components, 3-D CFD (Computational Fluid Dynamics) analysis was conducted. Modeling of the impeller was generated using Vista CPD and Bladegen of ANSYS WORKBENCH v.15.0. Table 2 summarizes the analysis parameters and CFX within ANSYS WORKBENCH v.15.0 was used with k- turbulence model for calculations.
The flow boundary conditions and model are shown in Fig. 3. Fig. 4 shows the representative calculation results in the impeller at 9,000 rpm and 1.2 kg/s. Fig. 4 (a) represent
(a) (b)
Fig. 4. CFD analysis results of (a) total pressure and (b) velocity distribution and vectors at 50 % span of impeller vane (9,000 rpm, 1.2 kg/s).
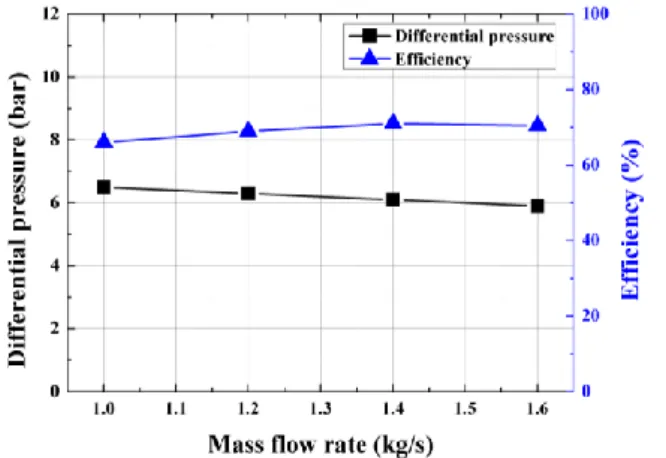
Fig. 5. Analysis results of differential pressures and efficiencies for mass flow rates from 1.0 to 1.6 kg/s at 9,000 rpm.
is the increase of the total pressure while fig. 4 (b) shows the velocity distribution and its vector at 50 % span of impeller vane. Fig. 5 summarizes the differential pressure-mass flow rate relation and efficiencies across the inlet and outlet in analysis model in Fig. 3 for the mass flow rate range from 1.0 to 1.6 kg/s at 9,000 rpm. According to the calculation results, the pump can produce differential pressure of 6.3 bar with the mass flow rate of 1.2 kg/s. In this case, the hydraulic efficiency is expected to be 69 %.
Since the diameter of the impeller was increased from 69 mm to 74 mm to consider the losses, it was confirmed that the pump performance met the target performance.
Fig. 6. Shaft modal analysis result – 1st bending mode at 238.9 Hz, 2nd bending model at 2214.4 Hz.
Fig. 7. Variation of maximum displacement by harmonic analysis.
(a) (b)
Fig. 8. (a) 3D drawing of cryogenic pump and main components, (b) fabricated pump installed the performance test facility.
2.3. Vibration analysis of pump shaft
A cryogenic pump should be designed to minimize conduction heat loss through the shaft by using a material with low thermal conductivity or thin tube, but this may cause low natural frequency problems of the high-speed pump. Since the pump in this study does not use a bearing at impeller side to eliminate lubrication problem at cryogenic temperature, the rotor shaft design was carried out so that the natural frequency for the pump shaft to be larger than the rotating speed.
In the vibration analysis, the stiffness of the motor side bearing, which is at room temperature, was set as 70,000 N/mm considering a regular specification of a ball bearing The maximum rotating speed of 12,000 rpm was considered including operational margin.
The hollow rotor shaft design was conducted by adjusting the thickness, the diameter, and the length of the stainless steel shaft to make the natural frequencies be larger than 200 Hz (12,000 rpm). Fig. 6 shows the modal analysis results of the designed pump shaft, where the 1st mode natural frequency appears at 238.9 Hz (14,335 rpm)
In addition, a harmonic analysis was performed with the shaft having mass unbalance of G6.3 grade balance and eccentric force of 4.2 N by flow discharge to verify if the maximum displacement of the shaft is within the designed shroud clearance. According to the harmonic analysis in Fig. 7, the maximum displacement was less than 0.06 mm up to the operating speed of 200 Hz, which is less than the target shroud clearance of 0.1 mm.
2.4. Fabrication of cryogenic pump
As a driving motor, a 1.2 kW induction motor was used (GEM, model: A4P - S83 L80 V12 - /LD) with maximum rotating speed of 12,000 rpm. O-ring seals were applied at room temperature to prevent the leakage of nitrogen. Fig. 8 (a) shows the major components of the pump composed of a room temperature bearing, a motor casing, a motor, a motor shaft, a thermal barrier, a shaft, an impeller, a housing, and other pump components.
For the precise assembly of the pump, the clearance between the impeller and its housing is an important factor to avoid the mechanical interference by vibration at the high speed. Although the analysis results shows a maximum
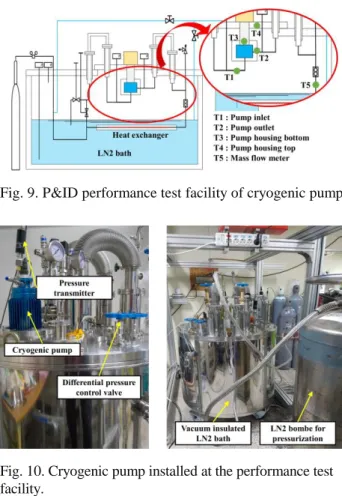
Fig. 9. P&ID performance test facility of cryogenic pump.
Fig. 10. Cryogenic pump installed at the performance test facility.
displacement of 0.06 mm at 12,000 rpm, the clearance of the fabricated pump was adjusted to 0.3 mm considering the misalignment of the pump shaft, the bearing and the impeller during the assembly process. Fig. 8(b) shows a photo of the fabricated cryogenic pump.
3. PERFORMANCE TEST OF CRYOGENIC PUMP
3.1. Performance test facility test procedure
For the performance test of the cryogenic pump, a cryogenic pump test facility was developed by authors using a heat exchanger in a liquid nitrogen bath instead of a cryogenic refrigerator to generate and circulate the subcooled liquid nitrogen as shown in Fig. 9. Since the test facility uses the closed loop circulation of the subcooled liquid nitrogen, the heat ingress through the pump is removed by the heat exchanger. The subcooled state is kept by pressurizing the line pressure over the saturation pressure using pressurized liquid nitrogen bombe. The liquid nitrogen level is kept above the heat exchangers during the tests.
To measure the mass flow rate, a flow meter (Honeywell, model: STD 700 / DAEHAN Instrument model:
DHOV-MW-20A- 4S-1/4) was installed between the exit of the pump and the heat exchanger. Two pressure gauges (SENSYS, model: PSHH0015KCIG) were installed to measure the pressures at inlet and exit of the pump. The assembled pump was installed on the test facility, and the mass flow rates and the differential pressures were measured
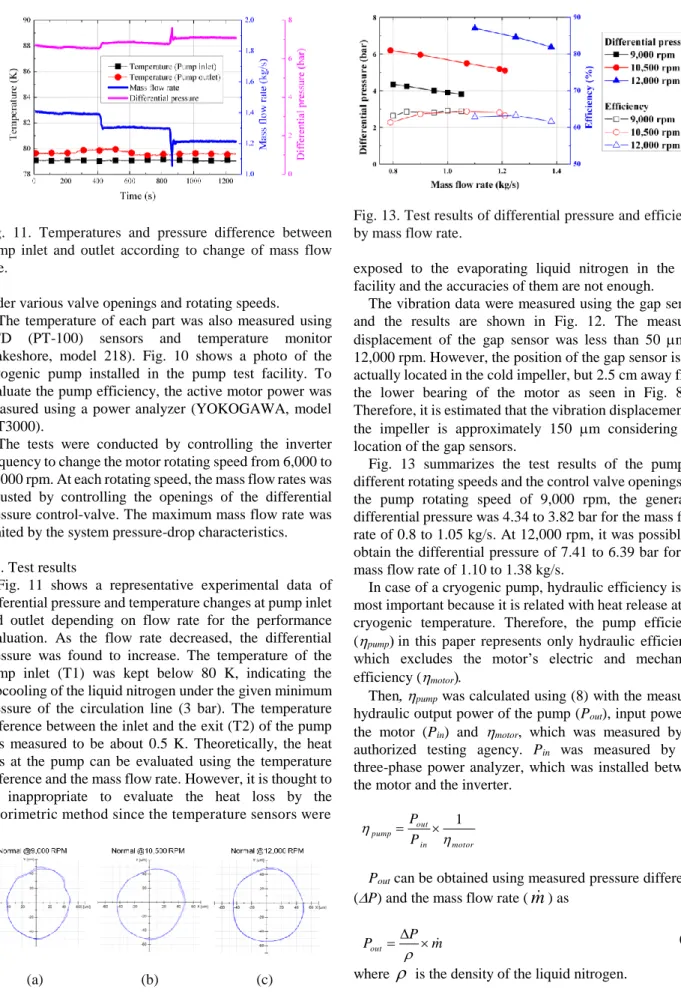
Fig. 11. Temperatures and pressure difference between pump inlet and outlet according to change of mass flow rate.
under various valve openings and rotating speeds.
The temperature of each part was also measured using RTD (PT-100) sensors and temperature monitor (Lakeshore, model 218). Fig. 10 shows a photo of the cryogenic pump installed in the pump test facility. To evaluate the pump efficiency, the active motor power was measured using a power analyzer (YOKOGAWA, model WT3000).
The tests were conducted by controlling the inverter frequency to change the motor rotating speed from 6,000 to 12,000 rpm. At each rotating speed, the mass flow rates was adjusted by controlling the openings of the differential pressure control-valve. The maximum mass flow rate was limited by the system pressure-drop characteristics.
3.3. Test results
Fig. 11 shows a representative experimental data of differential pressure and temperature changes at pump inlet and outlet depending on flow rate for the performance evaluation. As the flow rate decreased, the differential pressure was found to increase. The temperature of the pump inlet (T1) was kept below 80 K, indicating the subcooling of the liquid nitrogen under the given minimum pressure of the circulation line (3 bar). The temperature difference between the inlet and the exit (T2) of the pump was measured to be about 0.5 K. Theoretically, the heat loss at the pump can be evaluated using the temperature difference and the mass flow rate. However, it is thought to be inappropriate to evaluate the heat loss by the calorimetric method since the temperature sensors were
(a) (b) (c)
Fig. 12. Experimental results on the rotational vibration characteristics of the axis (a) 9,000 rpm, (b) 10,500 rpm, (c) 12,000 rpm.
Fig. 13. Test results of differential pressure and efficiency by mass flow rate.
exposed to the evaporating liquid nitrogen in the test facility and the accuracies of them are not enough.
The vibration data were measured using the gap sensor and the results are shown in Fig. 12. The measured displacement of the gap sensor was less than 50 m at 12,000 rpm. However, the position of the gap sensor is not actually located in the cold impeller, but 2.5 cm away from the lower bearing of the motor as seen in Fig. 8(a).
Therefore, it is estimated that the vibration displacement of the impeller is approximately 150 m considering the location of the gap sensors.
Fig. 13 summarizes the test results of the pump at different rotating speeds and the control valve openings. At the pump rotating speed of 9,000 rpm, the generated differential pressure was 4.34 to 3.82 bar for the mass flow rate of 0.8 to 1.05 kg/s. At 12,000 rpm, it was possible to obtain the differential pressure of 7.41 to 6.39 bar for the mass flow rate of 1.10 to 1.38 kg/s.
In case of a cryogenic pump, hydraulic efficiency is the most important because it is related with heat release at the cryogenic temperature. Therefore, the pump efficiency (pumpin this paper represents only hydraulic efficiency, which excludes the motor’s electric and mechanical efficiency (motor
Thenpump was calculated using (8) with the measured hydraulic output power of the pump (Pout), input power to the motor (Pin) and motor, which was measured by an authorized testing agency. Pin was measured by the three-phase power analyzer, which was installed between the motor and the inverter.
motor in out
pump P
P
1 ( 8 )
Pout can be obtained using measured pressure difference (P) and the mass flow rate (
m
) asP m Pout
( 9 ) where
is the density of the liquid nitrogen.The hydraulic efficiencies were measured as 61 to 65 %, which is lower than the expected values by the CFD analysis in Fig. 5.
4. DISCUSSION
Although the design target of the pump was 5 bar, 1.2 kg/s at 9,000 rpm, the test result showed approximately 60% of hydraulic performance of the design value. This implies that the shaft power is not fully transferred to the fluid or there exist large re-circulating fluid inside the impeller and the housing.
The CFD analysis was carried out with a shroud clearance of 0.1mm and the analysis surface was assumed as a smooth surface without sharp edges at the end of the vane. The actual shroud clearance was 0.3 mm and the re-circulation fluid may increase through the large clearance. This may be a main cause that degrades the hydraulic performance and hydraulic efficiency. In addition, a rough impeller surface and shaft vibration also have a negative influence on the hydraulic performance.
However, it was possible to obtain a mass flow rate of 1.25 kg/s with a differential pressure of 6.93 bar and a hydraulic pressure of 63.3% by increasing the rotating speed to 12,000 rpm.
3. CONCLUSIONS
In this paper, we designed and fabricated a cryogenic pump, which is applicable to a long HTS power cable over several kilometers. To remove the lubrication problem at the cold bearing, the pumps shaft was designed not to use the cold bearing. The hydraulic performance of the fabricated pump was tested using a laboratory cryogenic pump test facility. Although the test results did not meet the design target at 9,000 rpm, it was possible to meet the design target by increasing the pump speed to 12,000 rpm without a vibration problem.
Based on the test results, it was found that the shroud clearance have a strong influence on the hydraulic performance on the pumps and it is necessary to pay close attention to the pump assembly process to minimize the clearance between the impeller and shaft.
Since the pump was designed not to have a cryogenic bearing, there is no need for the maintenance of it. However, it is thought that long-term operation tests are necessary to verify the reliability for the commercial use. After adjusting the clearance and modifying minor design details, long-term operation tests will be followed in near future.
ACKNOWLEDGEMENT
This research was supported by Changwon National University in 2017~2018.
REFERENCES
[1] S. R. Lee, J. J. Lee, J. Yoon, Y. W. Kang, and J. Hur, “Impact of 154-kV HTS Cable to Protection Systems of the Power Grid in South Korea,” IEEE Trans. Appl. Supercond., vol. 26, no. 4, 2016.
[2] C. S. Weber, C. T. Reis, A. Dada, T. Masuda, and J. Moscovic,
“Overview of the underground 34.5 kV HTS power cable program in Albany, NY,” IEEE Trans. Appl. Supercond., vol. 15, no. 2 PART II, pp. 1793–1797, 2005.
[3] A. P. Malozemoff, J. Yuan, and C. M. Rey, “High-temperature superconducting (HTS) AC cables for power grid applications,”
Superconductors in the Power Grid: Materials and Applications, pp. 133–188, 2015.
[4] S. Mukoyama, M. Yagi, T. Okuma, and O. Maruyama, “Status of 275 kV REBCO HTS Cable Development in the NEDO Project,”
Phys. Procedia, vol. 58, pp. 310–313, 2014.
[5] E. P. Volkov, V. S. Vysotsky, and V. P. Firsov, “First Russian long length HTS power cable,” Phys. C Supercond. its Appl., vol. 482, pp. 87-91, 2012.
[6] Y. S. Choi, D. L. Kim, H. S. Yang, S. H. Sohn, J. H. Lim, and S. D.
Hwang, “Progress on the performance test of KEPCO HTS power cable,” IEEE Trans. Appl. Supercond., vol. 21, no. 3 PART 2, pp.
1034–1037, 2011.
[7] J. F. Maguire, et al., “Progress and status of a 2G HTS power cable to be installed in the Long Island Power Authority (LIPA) grid,”
IEEE Trans. Appl. Supercond., vol. 21, no. 3 PART 2, pp. 961–966, 2011.
[8] Barber-Nichols Inc., “Liquid Nitrogen Pumps,” 2015. https://
www.barber-nichols.com/products/pumps/cryogenic-pumps/liquid -nitrogen-pumps.
[9] S. Mukoyama, et al., “Experimental results of a 500 m HTS power cable field test,” IEEE Trans. Appl. Supercond., vol. 17, no. 2, pp.
1680-1683, 2007.
[10] S. H. Sohn, et al., “The results of installation and preliminary test of 22.9 kV, 50 MVA, 100 m class HTS power cable system at KEPCO,” IEEE Trans. Appl. Supercond., vol. 17, no. 2, pp.
2043-2046, 2007.
[11] Y. F. Fan, L. H. Gong, X. D. Xu, L. F. Li, L. Zhang, and L. Y. Xiao,
“Cryogenic system with the sub-cooled liquid nitrogen for cooling HTS power cable,” Cryogenics (Guildf), vol. 45, pp. 272-276, 2005.
[12] T. Nakano, et al., “Long-term operating characteristics of Japan’s first in-grid HTS power cable,” Phys. C Supercond. its Appl., vol.
518, pp. 126–129, 2015.
[13] D. W. Kim, “A Study on Cooling System Basic Design for HTS Power Cable,” Proc. KIEE Conf., pp. 81–82, 2008.
[14] G. Hwang and T. Bae, “The Development of Convergent Technique for Localization of the Cryogenic Submerged Pump,” J.
Korea Converg. Soc., vol. 9, no. 7, pp. 199–203, 2018.
[15] J. Lee, Y. Kwon, C. Lee, J. Choi, and S. Kim, “Design of partial emission type liquid nitrogen pump,” Prog. Supercond. Cryog., vol. 18, no. 1, pp. 64–68, 2016.
[16] J. H. Jo, S. Lee, and C. H. Kim, “Development of Cryogenic Test Rig for Ball-Bearing and Evaluation of the Performance of the Prototype Ball-Bearing of Turbo pump,” J. Korean Soc. Tribol.
Lubr. Eng., vol. 28, no. 4, pp. 167–172, 2012.
[17] H. J. Yang, S. Y. Kim, H. S. Chin, and K. J. Woo, “Development of Cryogenic Bearing&Seal&Material Test Facility for High Pressure Turbopump,” Korean Soc. Fluid Mach., pp. 347–351, 2004.
[18] L. Ai, et al., “Research on a Superconducting Magnetic Bearing System for Submerged Cryogenic Disk Motor-Pump,” IEEE Trans. Appl. Supercond., vol. 28, no. 4, pp. 1-5, 2018.
[19] H. D. Kwak, S. M. Jeon, J. Kim, G. R. Cho, S. Y. Kim, and K. J.
Woo, “Feasibility Verification of Cryogenic Ball Bearings for a Turbopump,” J. Korean Soc. Tribol. Lubr. Eng., vol. 20, no. 4, pp.
177–182, 2004.
[20] A. T. Sayer, Hydrulic and compressible flow turbo machines International editions. Mcgraw Hill, 1992.
[21] O. E. Balje, Turbomachines. JOHN WILEY & SONS, 1981.
[22] Y. J. Woo, Design of radial pumps. Sejin-sa, 1987.
![Fig. 2. Velocity diagram of centrifugal pump [1 3–15].](https://thumb-ap.123doks.com/thumbv2/123dokinfo/5237106.623865/2.892.100.801.124.1161/fig-velocity-diagram-centrifugal-pump.webp)