◈ 원 저 ◈
DCE 3D Breast MRI 검사 시 30 sec 이내에 혈류 역학적 정보에 대한 연구 : Experienced Reports
구은회
청주대학교 방사선학과
A study on Hemo-Dynamic information Within 30 seconds in DCE 3D Breast MRI : Experienced Reports
Eun-Hoe Goo
Department of Radiological Science, Cheongju University
5)
Abstract
The purpose of this study evaluated the hemo-dynamic information within 30 seconds clinically in 3D breast MRI. From January to March 2014, A total of 40 people were examined at 1.5 Tesla(Philips, Medical System, Achieva, The Netherlands) MRI equipments using 16 channel SENSE breast coil. The imaging parameters on vibrant are fellow as: TR/TE/FA°/Matrix size/Slice thickness/Slab(5 ms/2 ms/10°/180x139x2 mm/80). This study used a Gadovist and injected it with injection speed of 4 ml /sec by auto injector with 15 ml saline flushing. Firstly, for the delay time study, it divided three different delay time from immediately, 20 seconds, and 30 seconds. In quantitative analysis, the ROI signal intensities of tumor and surrounding tissues were measured retrospectively. In qualitative analysis, the image quality was scored from 1 to 5 point by one experienced radiological technologists as a visual test. The significance level of each delay time was evaluated with a one-way ANOVA(p<0.05). In the visual test, score levels on 30 seconds delay time was a little bit higher than others(p<0.05). The signal intensity of the tumor were 1445
± 360, 1410 ± 320, 1510 ± 415 on immediately, 20 seconds, and 30 seconds and score levels were 4.18 ± 0.85, 3.54 ± 0.94, 4.45 ± 0.74(p<0.05). The data on immediate images showed better results than that others(p<0.05).
Received: Jan, 6. 2014./Accepted for Publication: Jun. 30. 2014.
Corresponding Author: 구은회 298, Daeseong-ro, Sangdang-gu, Cheongju-si, Chungcheongbuk-do, Korea Tel: 043-229-7994
E-mail: [email protected]
Conclusively, Although it has been high scored in 30sec delay time for visual test in order to avoid failure in 20second, 30seconds delay time after contrast media administration, we recommend that the DCE 3D breast MRI commence immediately
Key words : Vibrant, Dynamic Contrast Enhancement, Breast MRI
Ⅰ. 서 론
생활양식의 서구화로 인하여 유방암은 매년 증가 추 세를 보이고 있다. 이러한 유방암의 조기발견 및 진단 에 가장 기본적이면서 예민한 검사 방법으로 알려진 검 사는 유방촬영술(mammo graphy)이다.1 그러나 유방촬 영술은 방사선 조사가 많으며 특히 35세 이하의 젊은 여성이나, 치밀 유방 혹은 수술 후 변형된 유방의 유방 암 발견에 있어서 민감도와 특이도가 떨어진다. 이러한 점을 극복하기위해 유방 촬영술의 발전과 새로운 검사 방법이 많이 연구되었다. 이 중 유방 초음파 검사가 가 장 널리 유용하게 유방 촬영술의 보조적인 또는 독자적 인 검사로서 특히 젊은 여성이나 우리나라의 많은 수를 차지하는 치밀 유방 검사에 많이 이용된다.2 또한, 1980년대에서부터 연구되어 적용된 유방 자기공명영상 (Breast MRI)은 영상 대조도가 뛰어나며 해부학적 평 가가 용이하고 방사선 노출의 위험이 없으며, 양측 유 방을 동시에 검사할 수 있는 장점이 있어 유방 촬영술 의 보조적인 검사법으로 알려졌다.3 일반적으로 유방 자기공명영상은 유방 촬영술이나 초음파 촬영술에서 소 견이 애매한 경우, 수술 후 혹은 방사선 치료 후 유방 의 진단에 많이 이용된다. 특히 조영증강 자기공명영상 은 유방암을 진단하는데 있어 여러 검사들 중 가장 민 감도(sensitivity)가 높은 것으로 연구 보고되었으며, 3 차원 자기공명영상 및 다양한 기법의 개발로 영상의 질 적인 면이 많이 발전되었다. 일반적으로 유방의 양성질 환의 자기공명영상 소견은 악성질환과 달리 형태학적으 로 경계가 매끄럽거나 분업화 되어있으며 조영증강 후 조영증강이 되지 않거나 조기에 약하게 조영 증강되며 점차 신호 강도가 증가되는 양상으로 시간-신호 강도 곡 선(time-signal intensity curve)에서 보면 Kuhl type I (Increase)형 or II (plateau)형을 보인다. 그러나 유방 은 호르몬 반응 기관 (hormone-reactive organ)으로 내적(endogenous) 그리고 외적(exogenous) 호르몬의 영향을 받는다. 이러한 호르몬은 유방실질에 히스타민
같은 효과를 일으켜 명확한 구조적 변화 없이 부분적인 충혈(hyperemia)을 유발하여 특히 젊은 여성의 유방 혈류 증가를 일으켜 조영증강이 강하게 나타나는 국소 병소가 유발된다. 유방실질도 정상적으로 서서히 조영 증강되며 주로 유방의 주변부나 피하지방과 인접한 부 위에 보인다. 또한 유방암으로 오인되는 위양성 병소들 (섬유선종, 소엽성내암, 비정형 관상 증식, 섬유낭성 변 화, 증식성 변화, 유두종, 경화성 샘증 또는 관 과다증 식)은 유방암과유사한 조영증강 소견을 나타내는 경우 가 있어 감별이 용이하지 않으나 임상증상, 유방 촬영 술 및 초음파 소견을 같이 분석하는 것이 진단에 도움 이 된다.4
유방암의 자기공명영상(MRI) 소견은 유방암의 조직학 적 타입, 형태학적 차이, 그리고 암의 주된 전파 경로에 따라서다양하게 관찰된다. 본 실험에서 사용된 펄스시퀀 스는 VIBRANT(Volume Imaged BReast Assessment)이 다. VIBRANT는 형태학적 영상과 혈류 역학적 정보를 제공해주기 때문에 양성종양과 악성종양의 구분을 도와 준다.5~7 현재까지 1분 이내의 early phase에 대한 정 확한 보고가 없었고 1 분 이상일 경우에는 longtime resolution 때문에 몇몇의 실패사례가 보고되었습니다.
따라서 저자는 DCE 3D Breast MRI 검사의 실패를 피 하기 위하여 1분 이하로 scant time을 설정하였다.8 이 에 본 실험의 목적은 1분이내의 delay time중 3가지 시 간을 설정하여 가장 효율적인 delay time을 찾아보고자 한다.
Ⅱ. 대상 및 방법
1. 대상
2014년 1월부터 3월까지 Breast Cancer 진단을 받은 40명(연령분포: 45~58세, 평균 50 ± 4.54세)의 여성 환자를 대상으로 실시하였다. 모든 환자는 검사를 받기 전 본 실험의 안정성에 관한 동의서를 작성 후 검사를 하였다.
2. 방법
본 실험에서는 정량적 평가를 위해 선택한 장비는 1.5Tesla 자기공명영상장치(Philips, Medical System, Achieva)를 선정하여 실험하였고, 데이터수신을 위한 16 Ch. SENSE Breast Coil을 사용하였다. Imaging parameter는 다음과 같다. TR/TE/FA°/Matrix/Thicke- ners/Slab(5 ms/2 ms/10°/180x139x2 mm/80). 본 실 험은 0.1 mmol/kg의 Gadovist를 사용하였으며, 15 ml 식염수 세척과 auto injector로 4 cc/sec를 주입 속도로 주입했다. 본 실험에서 사용된 펄스시퀀스는 VIBRANT (Volume Imaged BReast Assessment)이다. VIBRANT 는 형태학적 영상과 혈류 역학적 정보를 제공해주기 때 문에 양성종양과 악성종양의 구분을 도와준다. 실험의 조건 즉, Early phase에 대한 delay time 설정은 조영 제 주입 후 immediately, 20 sec, 30 sec로 구분하였 고, 각 Delay time 당 신호의 increase, plateau, wash out의 단계를 그래프로 표현 하였다.
1) 영상분석(Image analysis) (1) 정량적분석
정량분석(Quantitative)은 종양과 주변연부조직의 신 호강도와 Background 신호를 ROI(Region of interest) 로 설정하여 (식 1)에 따라 분석하였다.
(2) 정성적분석
정성분석(Qualitative)은 MRI기법으로 얻은 영상들은 각각 독립적으로 국제 MRI 전문방사선사가 delay time 이 immediately, 20sec, 30sec 일 때의 병변의 묘출도 를 1~5단계의 점수를 주어 육안평가(Visual test)를 실 시하였다.
평가의 단계는 병변의 묘출에 따라 매우불량(very poor, 1), 불량(poor, 2), 보통(fair, 3), 양호(good del- ineation, 4), 매우양호(Very good delineation, 5) 이 었고, 각 영상에 대하여 얻어진 점수를 평균화 하여 비 교하였다.
(3) 통계분석
두 가지 영상기법에서 정략적 분석으로 대조도비에 대 한 통계적 유의성은 ANOVA 검정으로 구하였으며, 병변 의 묘출도의 차이에 대한 통계적 유의성은 Wilcoxon
Rank test를 적용하였고, 통계에 사용된 프로그램은 SPSS 14.0을 이용하여 p 값이 0.05 이하일 때 유의성 을 두었다.
Ⅲ. 결과
1. 제작기구 전후의 시간 비교
자체적으로 제작한 하악거상 기구의 사용전후 검사소 요시간을 비교한 결과, 기구적용 이전의 평균 검사 소 요시간은 103.83초이었으며, 기구적용 후의 소요시간은 67.27초로 평균 35.2%(36.6초) 단축되었으며, 통계적으 로 유의한 차이를 보였다(p<.05)(Table 2)(Fig. 3).
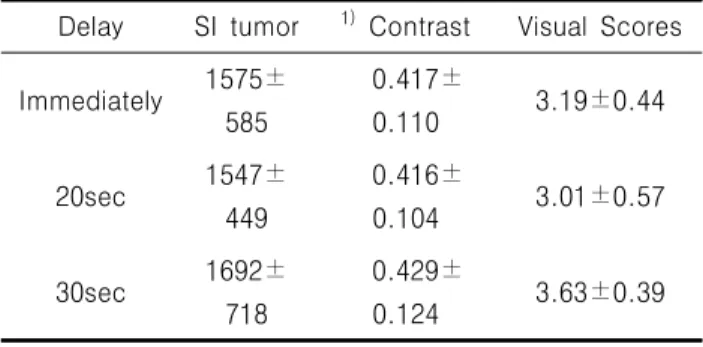
Delay SI tumor
1)Contrast Visual Scores
Immediately 1575±
585
0.417±
0.110 3.19±0.44
20sec 1547±
449
0.416±
0.104 3.01±0.57
30sec 1692±
718
0.429±
0.124 3.63±0.39 Table 1. The delay time in an early phase(n = 85).
Note - Data are given as mean ± standard.
1)
Contrast = SI (tumor) - SI (surrounded tissue) / SI(tumor) + SI (surrounded tissue).
본 실험에서는 조영제 delay time을 immediately, 20sec, 30sec 일 때 auto injection을 사용하였으며, 그 에 대한 SI tumor의 값은 1525 ± 449, visual scores 는 3.01 ± 0.57의 값을 보였다.
Injection
Methods SI tumor Visual Scores
Auto 1525±449 3.01±0.57
Table 2. Injection methods in 20sec delay.
Note - Data are given as mean ± standard.
* Scoring 1 to 5 by five well - experienced radiological tech- nologists.
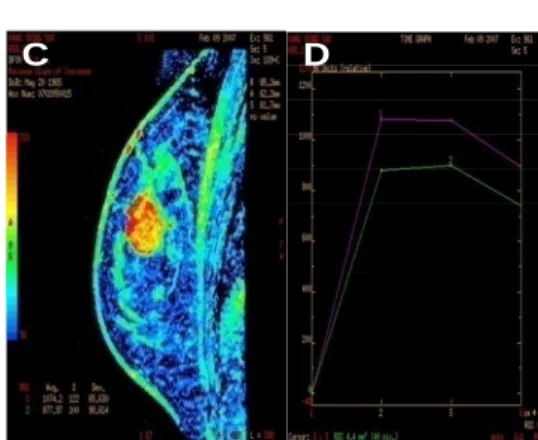
Immediate delay time 일 때 post-processing image 에서 post-contrast image 에서 보는 것과 마찬가지로 tumor의 묘출이 잘 나타났다(Fig. 1-A, B). post-
processing image는 post-contrast image에서 pre- contrast image를 처리한 뒤 병변의 묘출을 돕기 위해 색 처리를 한 영상이다(Fig. 2-C). Tumor와 tissue의 신호강도를 나타낸 그래프에서 보라색 선으로 이루어진 그래프는 tumor에 관한 signal intensity graph이고, 초록색 선은 tissue에 관한 signal intensity graph이 다(Fig. 2-D).
Signal intensity는 increase-plateau-washout의 3 단계로 되어 있다.
A B
A B
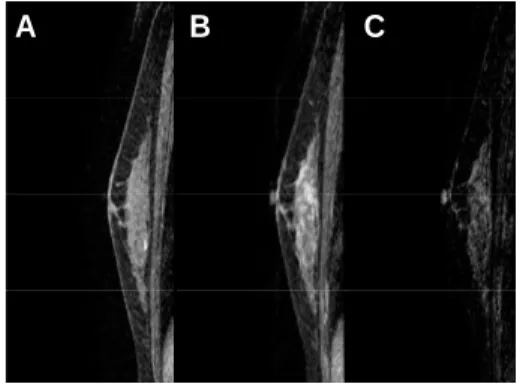
Fig. 1. The immediately image. Tumor appeared well in the post-contrast image (A) mask image.
(B) post-contrast image.
C D
C D
Fig. 2. The immediately image.
(C) post-processing image. (D) tumor - tissue signal intensity graph.
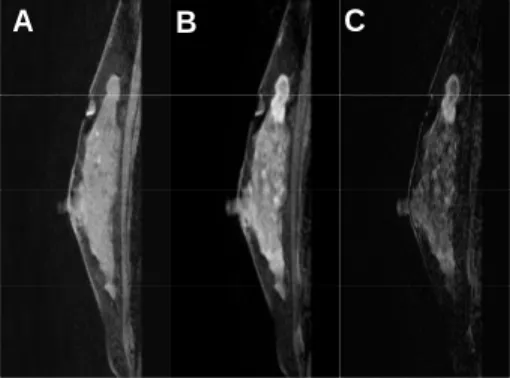
20sec delay 일 경우 immediately 일 때 보다 signal intensity 가 더 높았다. post-contrast image 와 sub- traction image의 tumor의 위치가 동일하였다(Fig. 3-A, B, C, D).
A B
A B
Fig. 3. The 20 second images. Tumor appeared well in the post-contrast image.
(A) mask image. (B) post-contrast image.
C D
C D
Fig. 4. The 20 second images. post-contrast image and the subtraction image was the same as the location of the tumor. (C) post-processing image.
(D) tumor -tissue Signal intensity graph.
30 sec delay time 일 때 tumor와 tissue의 signal intensity 가 최대였을 뿐 아니라 small tumor 또한 묘출이 잘 된 모습을 볼 수 있다(Fig. 5-A, B, C, D).
A B
A B
Fig. 5. The 30 second images.
(A) mask image. (B) post-contrast image.
A B
A B
Fig. 5. The 30 second images.
(A) mask image. (B) post-contrast image.
C D
C D
Fig. 6. The 30 second images.
(C) post-processing image. (D) tumor-tissue signal intensity graphy.
Delay time을 30초로 설정한 후 조영제를 사용했는데 early phase miss가 발생하여 legion이 잘 나타나지 않 았다(Fig. 7, 8). 이튿날 delay time을 immediately 로 설정하여 재검사를 시행하였더니 30초 일 때보다 병변 부위의 묘출이 잘 되었다(Fig. 9, 10).
B
A B C
A C
Fig. 7. 45-year-old(female) volunteer. (A) mask image.
(B) post-contrast image. (C) subtraction image.
D E
D E
Fig. 8. 45-year-old(female) volunteer.
(D) post-processing image. (E) tumor – tissue Signal intensity graph.
B
A B C
A C
Fig. 9. 45-year-old(female) volunteer.
Re-examination images in immediately.
(A) mask image. (B) post-contrast image.
(C) subtraction image.
D E
D E
D E
Fig. 10. 45-year-old(female) volunteer.
Re-examination images in immediately. (D) post-processing image. (E) tumor - tissue signal
intensity graph.
Delay time을 20 sec 로 검사했을 때 병변이 잘 나 타나지 않아 다음날 immediately로 검사를 시행하였을 때 병변의 묘출이 잘 되었다(Fig. 11, 12).
B
A B C
A C
Fig. 11. 45-year-old(female) volunteer.
Re-examination images in immediately.
(A) mask image. (B) post-contrast image.
(C) subtraction image.
Fig. 12. 45-year-old(female) volunteer.
Re-examination images in immediately. (D) post-processing image. (E) tumor - tissue signal
intensity graph.
Ⅳ. 고찰
유방암의 수술방법은 유방의 크기 혹은 종양의 크기, 주위조직으로의 침윤, 림프절 전이 같은 여러 인자에 의해 달라질 수 있어 수술 전 종양의 크기나 범위, 다 발성 여부의 정확한 진단은 수술방법의 결정과 국소재 발의 위험성을 낮추는데 있어 매우 중요 하다.9~13 최근 유방암의 관심도가 높아지고 유방암에 대한 선별검사가 증가하면서 유방암의 조기 진단율이 높아지고 유방보존 술의 적응증이 되는 환자가 많아지고 있다. 유방암의 수술 전 검사로 유방X선 촬영X술 유방초음파 등이 널 리 사용되어 왔으나 최근에는 민감도가 높은 유방 MRI 가 많이 이용되고 있다.
유방 MRI는 영상 대조도가 뛰어나고 해부학적평가가
용이하고 방사선 노출의 위험이 없으며 양측 유방을 동 시에 검사할 수 있는 장점이 있어 최근 널리 이용되고 있다.14 유방 MRI의 민감도 특이 도 및 정확도는 각각 93%, 65%, 85% 로 유방X선 촬영술의 86%, 32%, 72%와 유방초음파의75%, 80%, 76%에 비해 우수한 성적을 보여 주고 있다.15,16 유방 MRI 검사는 다발성 병변의 진단의 정확도가 96% 인 반면 유방X선 촬영술은 28.6%, 유방초 음파는 26.5% 정도로 보고되고 있으며 유방 MRI에서 만 새롭게 발견되는 병변이 37% 나된다는 보고도 있 다.17,18 이처럼 유방 MRI 검사는 수술 전 병소의 정 확한 크기와 범위를 파악하고 유방암의 수술방법의 결 정에 있어 매우 중요한 역할을 한다. 수술방법의 결정 에 중요한 인자인 병변크기의 정확성은 유방 MRI에서 더 정확하게 진단되어 수술범위를 결정하는데 도움이 되었다 유방 MRI 검사는 수술 전 병소의 정확한 범위 나 크기 다발성병소 등을 진단하여 환자에게 적절한 수 술방법을 결정하는데 있어 도움이 되고 재발 및 전이의 위험성을 감소시킬 수 있을 것으로 생각 된다. 본 연구 에서는 delay time을 immediately, 20sec, 30sec에서 연구 결과 정량적, 정성적 분석결과 값이 크게 차이나 지 않는 것을 알 수 있다. 하지만 20 sec, 30 sec 일 때, failed case 가 생겨 immediately 때 쓰는 것이 바람직하다고 볼 수 있지만, delay time에 대한 충분한 자료가 축적되어 있지 않아 앞으로 장기적인 추적관찰 이 필요할 것이다.
Ⅴ. 결론
먼저, 자동주입이 손 주입에 비해 높은 신호강도와 시각적 평가를 받아서 임상에서 자동주입을 권장하며, 우리는 DCE 3D 유방 MRI 지연시간에 따른 신호강도 는 유의성 있는 값을 얻었다. 결론적으로, 30 초에서 신호가 가장 강하게 나타났고 visual test에서도 높은 점수를 받았지만, 조영제 injection후 20초, 30초의 delay time의 실패를 피하기 위하여 우리는 DCE 3D Breast MRI 검사 시 immediately 검사를 권장하는 바 이다.
참고문헌
1. Min HH, Hae KL, Wan NK, Chan SY, Seung SK, Lee YJ, Lee KS, Cho BJ, Kang SS. Breast Cancer Screening: A Medical Audit of the Screening Mammography Performed at One Institution for 10 Years. J Breast Cancer 2008; 4:180-6.
2. Cho NR, Moon WK. Clinical Role of Breast Ultrasound. J Korean Med Assoc 2008; 6 : 545-552.
3. Cha ES. Magnetic Resonance Findings of Breast Diseases. Journal of Korean Breast Cancer Society 2003; 6 :247-254.
4. Kim TY, Kim SH, Baik JE, Kim YJ, Kang BJ.
Background Parenchymal Enhancement on Breast MRI in Breast Cancer Patients : Impact on Biopsy Rate and Cancer. JKSMRM 2013; 3 : 224-231.
5. Berg WA, Gutierrez L, Aiver MSN, Carter WB, Bhargavan M, Lewis RS, MPH, and , Ioffe OB.
Diagnostic Accuracy of Mammography, Clinical Examination, US, and MR Imaging in Preope- rative Assessment of Breast Cancer. Radiology 2004; 233 :830–49.
6. Kuhl CK, Schrading S, Leutner CC, Nuschin MS, Wardelmann E, Fimmers R, Kuhn W, Schild HH.
Mammography, Breast Ultrasound, and Magnetic Resonance Imaging for Surveillance of Women at High Familial Risk for Breast Cancer. JCO 2005;
223 : 8469-8476.
7. Piccoli CW. Contrast-enhanced breast MRI: factors affecting sensitivity and specificity European, Radiology 7; 1997 : 281-288.
8. Han MS, Daniel BL, Hargreaves BA. Accelera- ted Bilateral Dynamic Contrast-Enhanced 3D Spiral Breast MRI Using TSENSE. JOURNAL OF MAGNETIC RESONANCE IMAGING 2008; 28 :1425–434.
9. Fischer U, Kopka L, Grabbe E. Breast carcin- oma: effect of preoperative contrast-enhanced MR Imaging on the therapeutic approach. Ra- diology 1999;213:881-8.
10. Bedrosian I, Mick R, Orel SG, Schnall M, Reynolds C, Spitz F, et al. Changes in the sur- gical management of patients with breast car- cinoma based on preoperative magnetic reso- nance imaging. Cancer 2003; 98:468-73.
11. Faverly DR, Hendiriks JH, Holland R. Breast carcinomas of limited extent: frequency, radio- logic-pathologic characteristics, and surgical margin requirements. Cancer 2001;91:647- 59.
12. Esserman L, Nola H, Yassa L, Barclay J, Fra- nkel S, Sickles E. Utility of magnetic resonance imaging in the management of breast cancer:
evidence for improved preoperative staging. J Clin Oncol 1999;17: 110-9.
13. Gatzemeier W, Liersch T, Stylianou A, Buttler A, Becker H, Fischer U. Preoperative MR mam- mography in breast carcinoma. Effect on oper- ative treatment from the surgical viewpoint.
Chirurg 1999;70: 1460-8.
14. Cha ES. Magnetic resonance findings of breast diseases. J Korean Breast Cancer Soc 2003;6:
247-54.
15. Schelfout K, Vangoethem M, Kersschot E, Colpaert C, Schelfout AM, Leyman P, et al.
Contrast-enhanced MR imaging of breast le- sions and effect on treatment. Eur J Surg Oncol 2004;30:501-7.
16. Hollingsworth AB, Stough RG. Preoperative breast MRI for locoregional staging. J Okia State Med Assoc 2006;99:505-15.
17. Pavic D, Koomen MA, Kuzmiak CM, Lee YH, Pisano ED. The role of magnetic resonance imaging in diagnosis and management of breast cancer. Technol Cancer Res Treat 2004;
3:527-41.
18. Bilimoria KY, Cambic A, Hansen NM, Bethke KP.
Evaluating the impact of preoperative breast magnetic resonance imaging on the surgical man- agement of newly diagnosed breast cancers. Arch Surg 2007;142:441-7.