Vol. 31, No. 6 (2021)
325
Preparation of Nanoflake Bi
2MoO
6Photocatalyst Using CO(NH
2)
2as Structure Orientation and
Its Visible Light Degradation of Tetracycline Hydrochloride
Pengwei Hu
1, Dewen Zheng
3, Yuxi Xian
2†, Xianhai Hu
1†, Qian Zhang
3, Shanyu Wang
3, Mingjun Li
1, Congliang Cheng
1, Jin Liu
1, and Ping Wang
11Anhui Key Laboratory of Advanced Building Materials, School of Materials Science and Chemical Engineering, Anhui Jianzhu University, Hefei 230601, China
2CAS Key Laboratory for Mechanical Behavior and Design of Materials, University of Science and Technology of China, Hefei 230026, China
3New Energy Research Center Research Institute of Petroleum Exploration and Development (RIPED), BeiJing 10083, China
(Received April 25, 2021 : Revised April 25, 2021 : Accepted May 17, 2021)
Abstract
Bi2MoO6 (BMO) via the structure-directing role of CO(NH2)2 is successfully prepared via a facile solvothermal route. The structure, morphology, and photocatalytic performance of the nanoflake BMO are characterized by X-ray diffraction (XRD), scanning electron microscopy (SEM), fluorescence spectrum analysis (PL), UV-vis spectroscopy (UV- vis) and electrochemical test. SEM images show that the size of nanoflake BMO is about 50 ~ 200 nm. PL and electrochemical analysis show that the nanoflake BMO has a lower recombination rate of photogenerated carriers than particle BMO. The photocatalytic degradation of tetracycline hydrochloride (TC) by nanoflake BMO under visible light is investigated. The results show that the nanoflake BMO-3 has the highest degradation efficiency under visible light, and the degradation efficiency reached 75 % within 120 min, attributed to the unique hierarchical structure, efficient carrier separation and sufficient free radicals to generate active center synergies. The photocatalytic reaction mechanism of TC degradation on the nanoflake BMO is proposed.Key words
Bi2MoO6, CO(NH2)2, photocatalyst, degradation, tetracycline hydrochloride.1. Introduction
Tetracycline hydrochloride
1)is widely used in the medical and aquaculture industries. It is characterized by high biological toxicity and non-degradability, which can damage the environment and endanger biological health.
2)In recent years, photocatalytic technology has attracted much attention in the degradation of organic pollutants (TC).
3)Researchers have developed a number of photo- catalysts that can respond to visible light, such as moly- bdenum disulfide (MoS
2),
4)titanium dioxide (TiO
2),
5)graphite-like carbon nitride (g-C
3N
4).
6)The band gap widths of these catalysts are not in the appropriate range, which can not achieve better catalytic effect. Bismuth-based
photocatalysts (BiOCl,
7)Bi
2O
3,
8)BiVO
4,
9)Bi
2MoO
610)) have the advantages of stable crystal structure, suitable band gap range
11)and easy preparation.As an excellent photo- catalyst, Bi
2MoO
612)exhibits high photocatalytic activity in waste water purification and pollutant degradation due to its unique electronic structure and appropriate band gap width.
13)In the early stage, the structure of Bi
2MoO
6was modified through compound,
14)self-doping,
15)morphology regulation
16)and structure optimization,
17)so as to improve the catalytic performance and achieve certain results.Due to the rapid recombination of photogenerated carriers, the quantum yield of Bi
2MoO
6is low. It can only be used in a certain wavelength range, which is far from practical application.
†Corresponding author
E-Mail : [email protected] (X.H. Hu, Anhui Jianzhu Univ.) E-Mail : [email protected] (X.Y. Xi, Univ. Sci. Technol. China)
© Materials Research Society of Korea, All rights reserved.
This is an Open-Access article distributed under the terms of the Creative Commons Attribution Non-Commercial License (http://creative- commons.org/licenses/by-nc/3.0) which permits unrestricted non-commercial use, distribution, and reproduction in any medium, provided the original work is properly cited.
326 Pengwei Hu et al.
Herein, Bi
2MoO
6with abundant active sites and lower band gap width was prepared by alcohol-thermal method using CO (NH
2)
2as the structure-directing agent to adjust its morphology. The crystal structure, microstructure and optical properties of the materials were investigated. The ability of the catalysts to hydrolyze tetracycline hydrochloride (TC) under visible light degradation was also characterized.
2. Experimental 2.1 Materials
Bismuth nitrate pentahydrate, sodium molybdate di- hydrate, CO(NH
2)
2, ethylene glycol were purchased from Sinopharm Chemical Reagent Co. Ltd. All the above reagents are analytical reagent and were used as received.
2.2 Preparation of bismuth molybdate
Nanoflake Bi
2MoO
6was synthesized by solvothermal method using CO(NH
2)
2as the structure-directing agent.
Bi(NO
3)
3·5H
2O was dissolved in glycol solution and dispersed for 30 min. Na
2MoO
4·2H
2O was added to the glycol solution and stirred for 30 min. CO(NH
2)
2was added to the solution, stirred at 25
oC for 30 min, and then transferred to a PTFE reactor, heated to 160
oC and kept for 6 h, and then cooled to room temperature. The precipitate was centrifuged and washed with anhydrous ethanol and deionized water for 3 ~ 5 times respectively.
Finally, it was dried at 60
oC for 12 h to obtain light yellow powder. A series of BMO were prepared by this method, as shown for specific mass ratios in Table 1.
2.3 Characterization
The samples were characterized by X-ray diffraction (Bruker D8) from Germany Bruker Optics and scanning electron microscopy (Regulus 8100) from Hitachi (China) Co. Ltd. The UV-vis diffusion absorption spectra were recorded on a UV-vis spectrophotometer (SolidSpec- 3700, Shimadzu Corporation) by using BaSO
4as a reference. Photoluminescence (PL) spectra were recorded on an F-4600 model fluorescence spectrometer from Hitachi (China) Co. Ltd. Photoelectrochemical measure- ment was performed on an electrochemical workstation
(CHI660E, Shanghai Chenhua Instrument Co. Ltd.) using a three-electrode configuration. The Pt foil was used as the counter electrode, and the AgCl electrode was used as the reference electrode. The electrolyte is 0.05 M Na
2SO
4aqueous solution.
2.4 Photocatalytic experiments
The photocatalytic performance was tested using 300 W xenon lamp as the light source and Tc as the target degradable substance. The absorbance was measured by UV-vis spectrophotometer and the catalytic activity was studied by calculating the reaction rate. 20 mg samples were dispersed in 100 mL TC solution with a concentration of 10 mg/L for dark adsorption for 30 min to achieve adsorption equilibrium. Then, a 300 W xenon lamp with a 420 nm cutoff filter was irradiated, and 4 mL solution was taken everyinterval 20 min. After centrifugation, the supernatant was taken to test its absorbance. The degradation rate of TC was calculated by the following formula.
18)(A
0: absorbance of TC solution at 357 nm) 3. Results and Discussion
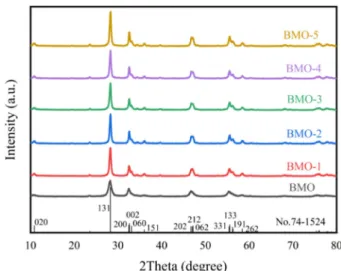
Fig. 1 shows the XRD pattern of a series of BMOs, which exhibit several diffraction peaks at 10.9
o, 28.3
o, 32.5
o, 32.6
o, 33.1
o, 36.0
o, 46.7
o, 47.1
o, 47.2
o, 55.4
o, 55.6
o, 56.2
oand 58.4
o, indexed to (020), (131), (200), (002), (060), (151), (202), (212), (062), (331), (133), (191) and (262) crystal planes of Bi
2MoO
6(PDF 72-1524).
19)Compared with BMO, the characteristic peaks of other samples were completely corresponding to Bi
2MoO
6, and the peak shape was more sharp, among which BMO-3 showed the strongest peak. The results show that with
% 100
×
=
= Ao
A Co D C
Fig. 1. XRD pattern of the photocatalyst samples.
Table 1. Specific ratio of main reagents.
Sample CO(NH2)2 (g) Bi(NO3)3·5H2 O (g)
Na2MoO4·2H2 O (g)
BMO 0
0.97 0.242
BMO-1 0.27
BMO-2 0.54
BMO-3 0.81
BMO-4 1.08
BMO-5 1.62
the increase of the amount of CO(NH
2)
2, the peak strength increases, which indicates that the addition of CO(NH
2)
2makes the crystal better crystallinity, higher purity and anisotropic growth performance.
In order to understand the influence of CO(NH
2)
2, the CO(NH
2)
2dose-dependent experiment was conducted to reveal the formation process of the nanoflake BMO. Fig.
2(a) and (b) are the SEM images of BMO at 2.0 × 10
4times magnification and 1.0 × 10
5times magnification, respectively. Fig. 2(c) and (d) are the SEM images of BMO-3 at 6.0 × 10
4times magnification and 1.0 × 10
5times magnification, respectively. It can be clearly observed that Bi
2MoO
6is nanoflake shape. By comparing the area obtained by the integral of the strongest diffraction peak with the integral of the standard substance, it can be seen that BMO-3 has the largest area and the best crystallinity.
It is generally believed that the crystal nucleus of Bi
2MoO
6is formed gradually by (Bi
2O
2)
2+, MoO
42−and ethylene glycol, driven by thermodynamics.
20)In order to reduce the Gibbs of the whole, the addition of CO (NH
2)
2makes the nanoparticles spontaneously agglomerate into spheres, and in the subsequent maturation process, the nanoparticles gradually grow into a grove-like two- dimensional nanosheet structure as crystal nuclei, as
shown in Fig. 3. Compared with particles BMO, nanoflake BMO has more active reaction sites, and the degradation rate of TC is faster.
The UV-vis DRS of a series of BMOs were measured in Fig. 4(a). It can be clearly observed that all samples exhibit spectral responses in the visible range. BMO shows an absorption edge of ~500 nm. The band gap width of BMO is calculated as 2.78 eV by Tauc plot formula.
Compared with BMO, BMO-3 has a narrower band gap width of 2.72 eV. The addition of CO(NH
2)
2enhances the alkalinity of the solvent and the interaction between molecules, and its light absorption capacity also becomes stronger, so the absorption range of BMO is extended from ultraviolet to visible light. It indicates that proper CO(NH
2)
2addition can effectively enhance the light absorption range of BMO.
(αhv)
1/n= A(hv − Eg) —Tauc plot
(α: Absorption index, h: Planck's constant, v: frequency, A: constant, Eg: semiconductor band gap width, index n:
[direct band gap semiconductor] n = 1/2, [indirect band gap semiconductor] n = 2)
Fig. 5 shows the fluorescence intensity of BMO with
Fig. 2. SEM image of (a,b) BMO and (c,d) BMO-3.328 Pengwei Hu et al.
different CO(NH
2)
2additions. BMO with CO(NH
2)
2added has higher emission intensity than BMO without CO(NH
2)
2added. The addition of CO(NH
2)
2increases the photo- generated carriers of samples, and the recombination rate of photogenerated carriers is faster between CB and VB of samples, which promotes the effective separation of photogenerated carriers between CB and VB. The emission intensity of BMO-3 at 469 nm is higher than that of other samples. In other words, more electrons left CB and recombined with holes in the BMO-3, resulting in more photon energy and faster recombination efficiency.
Fig. 6(a) shows the instantaneous photocurrent response of BMO and BMO-3. It can be seen that the instantaneous photocurrent response of BMO-3 is much higher than that of BMO. Fig. 6(b) depicts the EIS spectra of BMO and BMO-3. The radius of the Nyquist curve of BMO-3 is smaller than that of BMO, which confirms that BMO-
Fig. 5. PL spectra of the photocatalyst samples (λex = 375 nm, d= 10 nm)
Fig. 3. The schematic diagram of the nanoflake BMO-3.
Fig. 4. (a) UV-vis DRS spectra of the photocatalyst samples; (b) Band gap image of the photocatalyst samples.
3 has a small charge transfer resistance. In the process of BMO preparation, proper addition of CO (NH
2)
2can increase the separation of photogenerated carriers and inhibit the recombination of carriers.
Fig. 7 shows the photocatalytic degradation efficiency of photocatalyst samples under visible light. During the photocatalytic degradation process, the normalized time concentration change of TC (C/C
0) is proportional to the normalized maximum absorbance (A/A
0), which can be derived from the shift of TC absorption polyline within a given time interval.
It is observed that the degradation rates of TC for BMO, BMO-1, BMO-2, BMO-4, and BMO-5 are 54 %, 55 %, 64 %, 66 %, and 30 %. The degradation rate of BMO-3 is 75 %, much higher than those of others.
BMO-3 photocatalyst shows a higher adsorption capacity due to more active sites are provided.
The morphology of nanosheet BMO-3 inhibits the recombination of electron-hole pairs and provides more
active sites. The unique hierarchical structure, efficient carrier separation, and sufficient free radicals to generate active center synergies are reasons for the better perfor- mance of BMO-3. The addition of a lower amount of CO(NH
2)
2has little effect. The addition of an excessive amount of CO(NH
2)
2will reduce the accessibility of the active center, resulting in a lower rate of photocatalytic degradation of TC. BMO-3 exhibits higher photocatalytic performance than others.
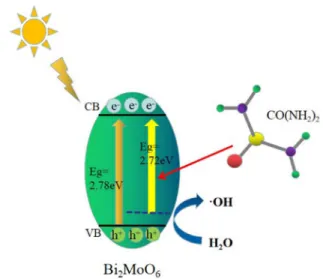
The mechanism model of visible light catalytic degrada- tion of TC is shown in Fig. 8. The abundant oxidizing holes left on the VB can directly oxidize pollutants.
Moreover, the accumulated holes in VB of the nanoflake BMO react with OH
-to form •OH. •OH can promotes oxidative degradation of TC. The excited electrons in VB of the nanoflake BMO under visible light can migrate to CB faster to achieve effective electron-hole separation.
The nanoflake BMO also reduces the forbidden band width to 2.72 eV.
Fig. 8. Schematic diagram of BMO charge transfer, separation and interface reaction under visible light irradiation.
Fig. 6. (a) Current density transient with light on/off for BMO and BMO-3 under visible light; (b) EIS spectra of BMO and BMO-3.
Fig. 7. Photocatalytic degradation rate diagram of TC under visible light of photocatalyst samples.
330 Pengwei Hu et al.
4. Conclusions
In conclusion, nanoflake BMO was successfully prepared by a simple solvothermal method using CO(NH
2)
2as structure-directing agent, which showed excellent photo- catalytic degradation activity in tetracycline hydrochloride.
CO(NH
2)
2was used as structure-directing agent to modify the morphology and interface properties of Bi
2MoO
6, so as to improve the transfer efficiency of photogenerated charge carriers, the recombination efficiency is faster, and the degradation efficiency is greatly improved.The photo- catalyst BMO-3 shows the highest degradation efficiency under visible light, and the degradation efficiency reached 75 % within 120 min. CO(NH
2)
2addition can adjust the width of BMO band gap, expand the utilization efficiency of visible light, and improve the degradation efficiency of TC under visible light.
Acknowledgments
This study was financially supported by Hefei Key Technology Major R &D Projects (No. J2019G19), the Natural Science Foundation of Anhui Education De- partment (No. KJ2020A0473) and the Natural Science Foundation of Anhui Province (No. 1908085MB55) are acknowledged.
References
1. Y. Luo, L X, M. Rysz, Y. Wang, H. Zhang and P. J. J.
Alvarez, Environ. Sci. Technol., 45, 1827 (2011).
2. Q. Q. Zhang, G. G. Ying, C. G. Pan, Y. S. Liu and J. L.
Zhao, Environ. Sci. Technol., 49, 6772 (2015).
3. W. Y. Li and L. J. Xu, Acta Chim. Sinica, 77, 705 (2019).
4. F. J. Zhang, X Li, X. Y. Sun, C. Kong, W. J. Xie, Z. Li and J. Liu, Appl. Surf. Sci., 487, 734 (2019).
5. Y. Wang, Y. Zhang, T. C. Zhang, G. Xiang, X. L. Wang and S.J. Yuan, ACS Appl. Nano Mater, 3, 8495 (2020).
6. D. Tu, H. W. Liao and Q. L. Deng, Chemistry Select, 3, 7170 (2018).
7. J. F. Ma, J. F. Ding, L. M. Yu, L. Y. Li, Y. Kong and S.
Komarneni, Appl. Clay Sci., 109, 76, (2015).
8. N. Pugazhenthirana, P. Sathishkuma, S. Murugesanb and S. Anandan, Chem. Eng. J., 168, 1227 (2011).
9. Q. L. Wang, H. Jiang, S. T. Ding, H. M. Noh, B. K.
Moon, B. C. Choi, J. S. Shi and J. H. Jeong, Synth.
React. Inorg., Met.-Org., Nano-Met. Chem., 46, 483 (2016).
10. H. B. Yu, L B J, H. Wang, B.B. Huang, X.Z. Yuan, J.H.
Huang, J. Zhang, and G. M. Zeng, Small, 15, 1901008 (2019).
11. N. Subhaa, M. Mahalakshmi, M. Myilsamy, B. Neppolian and V. Murugesan, J. Photochem. Photobiol., A, 379, 150 (2019).
12. Y. H. Peng, Y. Zhang, F. H. Tian, J. Q. Zhang and J. Q.
Yu, Crit. Rev. Solid. State., 42, 347 (2017).
13. Z. Liu, X. Q. Liu, C. L. Yua, L. F. Wei and H. B. Jia, Sep. Purif. Technol., 247, 116951 (2020).
14. T. T. Feng, H. Yin, H. Jiang, X. Chai, X. L. Li, D. Y. Li, J. Wu, X. H. Liu and B. Sun, New. J. Chem, 43, 9606 (2019).
15. X. Ding, W. K. Ho, J. Shang and L. Z. Zhang, Appl.
Catal., B, 182, 316 (2016).
16. J. L. Li, X. J. Liu, Z. Sun and L. K. Pan, Ceram. Int., 41, 8592 (2015).
17. Y. N. Zhu, J. J. Mu, G. H. Zhen, Z. X. Dai, L. Y. Zhang, Y. Q. Ma, D. W. Zhang, Ceram. Int., 42, 17347 (2016).
18. L. Xu, H. Y. Xu, S. B. Wu and X.Y. Zhang, Appl. Surf.
Sci., 258, 4934 (2012).
19. J. L. Wang, M. R. Dong, Q. C. Zhang ,W. S. Lin, Y. Xing, Chinese J. Inorg. Chem., 36, 827 (2020).
20. H. H. Li, K. W. Li, H. Wang, Mater. Chem. Phys., 116, 134 (2009).
Author Information Pengwei Hu
Students, Anhui Jianzhu University
Dewen Zheng
Researcher, New Energy Research Center Research Institute of Petroleum Exploration and Development(RIPED)
Yuxi Xian
Researcher, University of Science and Technology of China
Xianhai Hu
Professors, Anhui Jianzhu University
Qian Zhang
Researcher, New Energy Research Center Research Institute of Petroleum Exploration and Development(RIPED)
Shanyu Wang
Researcher, New Energy Research Center Research Institute of Petroleum Exploration and Development(RIPED)
Mingjun Li
Students, Anhui Jianzhu University
Congliang Cheng
Students, Anhui Jianzhu University
Jin Liu
Professors, Anhui Jianzhu University
Ping Wang
Researcher, Anhui Jianzhu University