Vol. 22, No. 3 pp. 30-35, 2021
Effect of Guide Fin Structures and Boundary Parameters on Thermal Performances of Heat Exchanger for Waste Heat Recovery
Thermoelectric Generator
Kunal Sandip Garud, Jae-Hyeong Seo, Moo-Yeon Lee
*Department of Mechanical Engineering, Dong-A University
가이드 핀 구조와 경계 파라미터가 폐열 회수용 열전발전 열교환기의 열적 성능에 미치는 영향
쿠날 산딥 가루드, 서재형, 이무연
*동아대학교 기계공학과
Abstract The present study examined the effects of various guide fin structures and boundary parameters on the thermal performance of heat exchangers used in heat recovery thermoelectric generators. The heat transfer rate and pressure drop of the heat exchangers without fins, with circular fins, with triangular fins, and with combined circular and triangular fins were simulated numerically using ANSYS 19.1 commercial code to confirm the effect of the guide fin structures. The heat transfer rate of the heat exchanger with combined fins was 27.0%, 5.2%, and 1.5% higher than those without fins, with circular fins, and with triangular fins, respectively. The pressure drop characteristic of the heat exchanger with the combined fins was 28.3% higher than that without fins but 9.2% and 10.5% lower than those with circular fins and with triangular fins, respectively. The heat exchanger with combined fins as the optimal model showed the highest heat transfer rate of 5664.9 W and pressure drop of 1454.02 Pa for highest hot gas temperature, maximum flow rates of hot gas and coolant, and lowest coolant temperature.
요 약 본 연구는 다양한 가이드 핀 구조와 경계 파라미터가 폐열 회수 열전발전용 열교환기의 열적 성능에 미치는 영향에 대하여 다룬다. 가이드 핀 구조의 영향을 확인하기 위하여 ANSYS 19.1 소프트웨어를 사용하여 핀이 없는 유형, 삼각형 핀, 원형 핀, 원형 핀과 삼각 핀 조합 열교환기의 열전달율 및 압력 강하 특성을 수치해석 하였다. 원형 핀과 삼각 핀 조합 열교환기는 핀이 없는 열교환기, 원형 핀 또는 삼각 핀이 있는 원형 핀 또는 삼각 핀 열교환기와 비교하여 각각 27.0%, 5.2% 및 1.5% 높은 열전달율을 나타내었다. 그리고 복합 핀 열교환기의 압력강하는 핀이 없는 열교환기와 비교하여 28.3% 높았지만, 복합 핀 열교환기와 비교하여 9.2% 및 10.5% 낮은 압력강하 특성을 나타내었다. 최적모델로 서 복합 핀 열교환기는 최대 고온 가스 및 냉각수 질량 유량, 최고 고온 가스 온도 그리고 최저 냉각수 온도 조건에서 최대 열전달율 5664.9 W 및 최대 압력강하 1454.02 Pa을 나타내었다.
Keywords : Guide Fins, Heat Exchanger, Heat Transfer Rate, Pressure Drop, Thermal Performance, Thermoelectric Generator
이 성과는 정부(과학기술정보통신부)의 재원으로 한국연구재단의 지원을 받아 수행된 연구임(No. 2020R1A2C1011555).
*Corresponding Author : Moo-Yeon Lee(Dong-A Univ.) email: [email protected]
Received October 6, 2020 Revised January 4, 2021
Accepted March 5, 2021 Published March 31, 2021
1. Introduction
In the recent times, to reduce the exhaust emission and to utilize the waste exhaust heat, research is trending towards the applicability and efficiency improvement of thermoelectric generators[1]. The thermoelectric generators convert the waste heat into electricity but the conversion efficiency is low[2]. Kunal et al. have proposed coupled numerical approach to suggest the optimum internal fin structure for hot exchanger based on thermal, electrical and structure performances[3]. The numerical and artificial intelligence approaches are developed to predict the thermal performances of thermoelectric generator systems[4]. The two stage, segmented and linear thermoelectric generators show better thermal and electrical performances compare with conventional thermoelectric generators[5,6].
The main objective of the present study is to suggest the optimum model of heat exchanger with guide fin structure based on thermal performances. The effect of various boundary parameters such as, hot gas and coolant mass flow rates and temperatures are investigated on the thermal performances of the optimum model.
2. Numerical method
Computational domain is shown in Fig. 1. It consisted of main heat exchanger with diffuser section at inlet and outlet, two coolant channels on the opposite side of heat exchanger and over the frame. Frame was provided with 10 equal passages within the heat exchanger to pass the hot gas. Inlet diffuser passage was provided with four different models of heat exchangers, model A (without fins), model B (circular fins), model C (triangular fins) and model D (combined circular and triangular fins), which are shown in Figs. 2 (a), (b), (c) and (d), respectively. Numerical analysis was conducted using boundary
conditions which is shown in Table 1. Mesh domain is shown in Fig. 3. Tetrahedron mesh elements with 1,199,958 elements and 797,986 nodes were generated in ANSYS meshing with the combined fins for the numerical analysis.
Fig. 1. Computational domain
(a) Model A (b) Model B
(c) Model C (d) Model D
Fig. 2. Model with various geometrical configurations
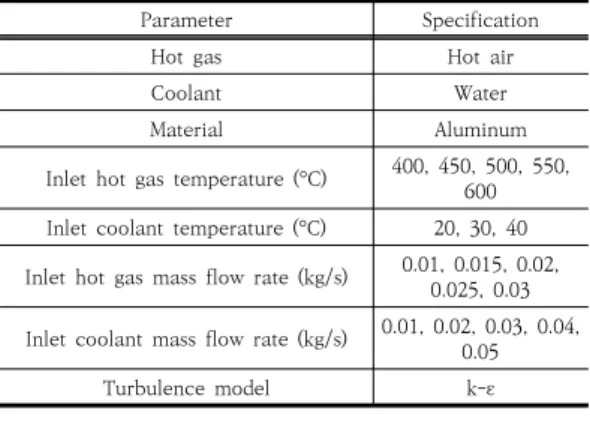
Parameter Specification
Hot gas Hot air
Coolant Water
Material Aluminum
Inlet hot gas temperature (°C) 400, 450, 500, 550, 600 Inlet coolant temperature (°C) 20, 30, 40 Inlet hot gas mass flow rate (kg/s) 0.01, 0.015, 0.02,
0.025, 0.03 Inlet coolant mass flow rate (kg/s) 0.01, 0.02, 0.03, 0.04, 0.05
Turbulence model k-ɛ
Table 1. Boundary conditions used in numerical modeling
Fig. 3. Mesh domain
Fig. 5. Comparison of heat transfer rate and pressure drop for four models
3. Results
3.1 Effect of different guide fin structures The heat transfer rate and pressure drop of heat exchanger with and without guide fins in the inlet diffuser were calculated using Eqs. (1) and (2) and compared to investigate the effect of guide fins[7,8].
(1)
(2)
is mass flow rate, is specific heat, and are inlet and outlet temperatures and and are inlet and outlet pressures.
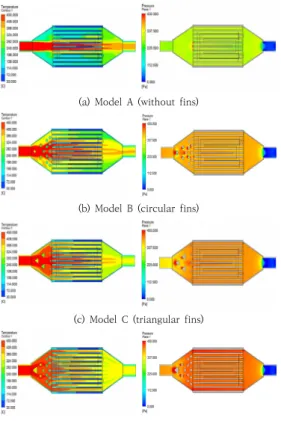
(a) Model A (without fins)
(b) Model B (circular fins)
(c) Model C (triangular fins)
(d) Model D (combined fins) Fig. 4. Temperature (left) and Pressure (right)
distribution
Fig. 4 shows temperature and pressure distributions for the models A, B, C and D. It was observed that, the addition of guide fins in inlet diffuser section gives more uniform distribution
of temperature and enhances the heat transfer rate. However, addition of guide fins in inlet diffuser section increased pressure drop due to turbulence (obstruction) for hot gas flow[9]. Fig. 5 shows the comparison of heat transfer rate and pressure drop for all four models. Model D showed heat transfer rate higher by 27.0%, 5.2%
and 1.5% compared to models A, B and C, respectively. The pressure drop for model D was higher by 28.3% than model A but lower by 9.2%
and 10.5% than models B and C, respectively.
Hence, model D was accepted as optimal model to enhance the performance of heat exchanger because it provided uniform temperature distribution and higher heat transfer rate for hot gas. However, highest pressure drop for optimal model D was lower than models B and C.
3.2 Effect of boundary parameters
Open literature about the thermoelectric generator presents that the hot gas inlet temperature and hot gas inlet mass flow rate have more effect on the performance of heat exchanger for waste heat recovery thermoelectric generator compare with coolant inlet temperature and coolant inlet mass flow rate. Therefore, more attention was given while selecting the ranges of hot gas inlet temperature and hot gas inlet mass flow rate.
The ranges of hot gas inlet temperature and hot
gas inlet mass flow rate for the numerical
analysis were selected based on experimental
results presented by D. W. Lee[10]. Based on the experimental results of the literature, the hot gas inlet temperature and hot gas inlet mass flow rate ranges of the heat exchanger were selected as 400 °C to 600 °C and 0.01 kg/s to 0.03 kg/s, respectively for the present numerical study.
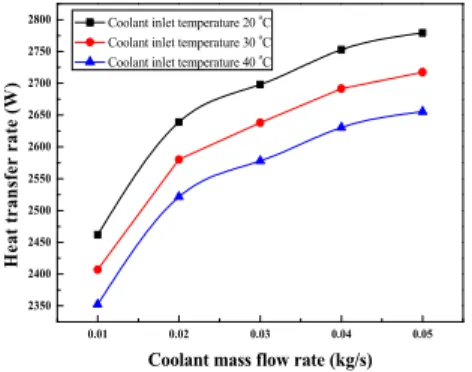
Fig. 6 shows the variation of heat transfer rate of the heat exchanger with the coolant inlet mass flow rate varied from 0.01 kg/s to 0.05 kg/s and the coolant inlet temperatures varied from 20 °C to 40 °C. Inlet mass flow rate and inlet temperature of hot gas were fixed to the values of 0.015 kg/s and 450 °C, respectively. For all coolant inlet temperatures, as the coolant inlet mass flow rate increased from 0.01 kg/s to 0.05 kg/s, the heat transfer rate from hot gas to coolant increased. This is due to increase in the heat capacity with rise in mass flow rate.
0.01 0.02 0.03 0.04 0.05
2350 2400 2450 2500 2550 2600 2650 2700 2750 2800
Heat transfer rate (W)
Coolant mass flow rate (kg/s)
Coolant inlet temperature 20 oC Coolant inlet temperature 30 oC Coolant inlet temperature 40 oC
Fig. 6. Variation of heat transfer rate with respect to coolant inlet mass flow rate for various coolant inlet temperatures
0.010 0.015 0.020 0.025 0.030
1500 2000 2500 3000 3500 4000 4500 5000 5500 6000
Heat transfer rate (W)
Hot gas mass flow rate (kg/s)
Hot gas inlet temperature 400 oC Hot gas inlet temperature 450 oC Hot gas inlet temperature 500 oC Hot gas inlet temperature 550 oC Hot gas inlet temperature 600 oC
Fig. 7. Variation of heat transfer rate with respect to hot gas inlet mass flow rate for various hot gas inlet temperatures
0.010 0.015 0.020 0.025 0.030
0 200 400 600 800 1000 1200 1400 1600
Pressure drop (Pa)
Hot gas mass flow rate (kg/s) Hot gas inlet temperature 400oC Hot gas inlet temperature 450oC Hot gas inlet temperature 500oC Hot gas inlet temperature 550oC Hot gas inlet temperature 600oC