Inhibitory Effect of the Phenolic Compounds from Apples Against Oxidative Damage and Inflammation
Jang Seop Sim
1, Jin Boo Jeong
2, Jong Hwa Lee
3, Tae-Hyung Kwon
3, Young Joon Cha
4and Hyung Jin Jeong
2*
1
Cheongsong Agriculture Technology & Extension, Andong, Republic of Korea, 763802
2
Bioresource Sciences, Andong National University, Andong, Republic of Korea, 760749
3
Food Science and Biotechnology Major, Andong National University, Andong, Republic of Korea, 760749
4
Department of Information Statistics, Andong National University, Andong, Republic of Korea, 760749
Abstract - ROS have been associated with pathogenic processes including carcinogenesis through direct effect on DNA and play an important role in the pathogenesis of inflammation. Because of many types of phenolic acid derivatives and flavonoids, apples have been one of the human diet since ancient times and are one of the most commonly consumed fruits in worldwide. In this study, catechin, chlorogenic acid and phlorizin dihydrate were purified and identified by HPLC and GC/MS. The contents of catechin, chlorogenic acid and phlorizin dihydrate were 1.01 mg, 7.01 mg and 3.67 mg/ kg wet weight, respectively. Catechin and phlorizin dihydrate were found to significantly inhibit oxidative DNA damage, while chlorogenic did not affect. Also, catechin inhibits NO and PGE
2production via suppressing iNOS and COX-2 expression.
However, chlorogenic acid and phlorizin dihydrate did not affect. Our results show that catechin may be the most active phenolic compound in anti-oxidative damage and anti-inflammatory effect.
Key words - Apple, Phenolic compounds, Reactive oxygen species (ROS), Anti-oxidative damage, Anti-inflammatory effect
*Corresponding author. E-mail : [email protected]
Introduction
Aerobic organisms constantly produce low levels of reactive oxygen species (ROS) (Halliwell, 1994). In some cases, ROS are produced specifically to serve essential biological functions, whereas in other cases, they represent by-products of metabolic processes. All ROS have the potential to cause damage to cellular components including DNA. Some oxidative DNA lesions are promutagenic and oxidative damage is proposed to play a role in the develop- ment of certain cancers (Ames, 1989). During normal cellular activities, various processes inside the cell produce ROS such as hydrogen peroxide (H
2O
2), superoxide ion (O
2-) and hydroxyl radical (OH
-). The most important target for ROS in the carcinogenesis process is DNA (Lopaczynski and Zeisel, 2001). When present in a high enough concentration, these compounds can damage cellular proteins and DNA, or form DNA adducts that may promote carcinogenic activity (Seifried
et al., 2007). Also, Excessive ROS (e.g. hydrogen peroxide) can lead to DNA oxidation, causing cell damage to all cellular constituents. Irreparable DNA damage is involved in carci- nogenesis, aging and other degenerative diseases (Cozzi et al., 1997). Therefore, the protection of oxidative DNA damage induced by ROS is very important for cancer prevention.
Also, ROS play an important role in the pathogenesis of inflammation (Amin et al., 2004). Innate immunity is an ancient form of host defense that is activated rapidly to enable, through a multiplicity of effector mechanisms, defense against bacterial or viral infections and stresses;
however, excessive innate immunity responses may cause
chronic inflammation (Brown et al., 2007). Chronic inflam-
mation represents a major pathological basis for tumor
development. Although inflammation acts as host defense
mechanism against infection or injury and is primarily a self
limiting process, inadequate resolution of inflammatory
responses lead to various chronic disorders associated with
cancers. Macrophages are key players in the immune response
to foreign invaders such as infectious microorganisms.
Macrophages are activated by IFN-γ, pro-inflammatory cytokines (Berenbaum, 2000), and bacterial lipopolysac- charide (LPS) (Zhang and Ghosh, 2000). Activated macrop- hages play an important role in inflammatory diseases via production of nitric oxide (NO) (Fujiwara and Kobayashi, 2005). Its excess production is involved in many diseases including rheumatoid arthritis, atherosclerosis, asthma and pulmonary fibrosis (Bharat Reddy and Reddanna, 2009).
Important inflammatory mediator linking chronic inflam- mation and cancer is NO, which is produced endogenously during arginine metabolism by different isoforms NOS (Moncada et al., 1991). During inflammation, induced expression of iNOS in macrophages and epithelial cells leads to production of NO. The expression of iNOS and the level of NO have been shown to be elevated in various precancerous lesions and carcinomas. Thus, pharmacological inhibition of NO and iNOS expression offers promising targets for chemoprevention in inflammation-associated carcinogenesis.
The high participation of fruits and vegetables in the human diet, because of their ability to neutralize active oxygen species, hazardous for health, is of utmost impor- tance. Plant tissue antioxidant capacity is closely associated with activity of “free radical scavenging enzymes” (super- oxide dismutase, catalase, peroxidase) and with the contents of antioxidant substances, mainly phenolic compounds, carotenoids, tocopherol and ascorbic acid (Bartosz, 1997).
Recently, antioxidant activity has been determined in many species of fruits, vegetables, herbs, cereals, sprouts and seeds.
Especial attention is paid to fruits, as rich sources of phenolic compounds. Among others, the antioxidant properties of apple polyphenols have been extensively examined. The apple phenolics, localized mainly in cortex and in skin are compounds with strong antioxidant activity (Leja et al., 2003).
Apples are one of the main sources of flavonoids in the Western diet, together with tea, wine, onions, and chocolate (Hertog et al., 1993; Art et al., 2001). Apples contain as much as 2 g of phenols per kilogram wet weight, or about 400 mg total phenols per apple (Scalbert and Williamson, 2000). The main classes of polyphenols in apples are flavonoids, such as flavonols (quercetin, as glycosides), flavanols ([−]-epic- atechin, [+]-catechin, and their oligomers, procyanidins),
anthocyanins, and certain dihydrochalcones only found in apples (phloridzin and phloretin), as well as other phenolic compounds, such as chlorogenic acid. These phenolic com- pounds are responsible for most of the antioxidant activities in apples (Wu et al., 2007).
In this study, we isolated three phenolic compounds such as catechin, chlorogenic acid and phlorizin dihydrate from apples. And we investigated whether these isolated phenolic compounds have anti-oxidative damage and anti-inflamma- tory properties in the non-cellular system and cellular system.
Materials and Methods
Chemical regents
All chemicals for the purification and identification of phenolic compounds from apples were obtained from Sigma Chemicals Co. (St. Louis, USA). φX-174 RF I plasmid was purchased from New England BioLabs (County Road Ipswich, MA). LPS (Escherichia coli 055:B5) was purchased from Sigma-Aldrich (St. Louis, MO, USA). Antibodies recognizing iNOS and COX-2 were purchased from Santa Cruze Biothechnology (Santa Cruz, CA, USA). And phospho- H2AX antibody was purchased from Cell Signaling Tech- nology (Danvers, MA, USA). The secondary antibody, goat anti-rabbit IgG-HRP conjugated, for lunasin peptide was purchased from Santa Cruz Biotechnology (Santa Cruz, CA).
Alexa 488, the secondary antibody for immuno-staining was purchased from Invitrogen (Carlsbad, CA, USA). Prosta- glandin E2 ELISA monoclonal Kit and Nuclear Extraction Kit were purchased from Cayman Chemical (Ann Arbor, MI, USA). Dulbeco’s modified Eagle’s medium (DMEM), penicillin and fetal bovine serum (FBS) were purchased from Gibco Inc. (NY, USA). All electrophoresis chemicals were purchased from Bio-Rad Labs (Hercules, CA, USA).
Isolation and identification of catechin, chlorogenic acid and phlorizin dihydrate from apples
Apples (cv. Fugi) were kindly obtained from Cheongsong
Agriculture Technology & Extension, Andong, Korea. Two
kilogram of apples was extracted with 3L of 80% methanol
with shaking for 24 h. After 24 h, extract with 80% methanol
was filtered, concentrated to approximately 600 ml volume using by a vacuum evaporator, and fractioned with n-hexane, chloroform and ethyl acetate in consecutive order in a separating funnel. Ethyl acetate fraction was collected, evaporated by a vacuum evaporator, and kept at -80
oC for the purification of catechin, chlorogenic acid and phlorizin dihydrate.
Twenty micro liter of ethyl acetate fraction (4 mg/ml methanol) was injected into HPLC equipped with C18 column (DELTA PAK, 15 μm, 300 A, 300 × 7.8 mm) equilibrated at ambient temperature and stabilized with the mobile phase (ratio of 1.6 to 8.4=methanol:water) at a flow rate of 1 ml/min for 40 min at the UV detector set at 280 nm.
Catechin, chlorogenic acid and phlorizin dihydrate were identified by being compared with the retention time of the standards, respectively. And the recoveries were calculated by being compared to the peak areas of the standards sub- jected to the same treatments. Purified catechin, chlorogenic acid and phlorizin dihydrate was collected with a fraction collector and then stocked in -20
oC for the identification.
Also we measured the amount of catechin, chlorogenic acid and phlorizin dihydrate from apples through comparing the peak area of standards. The quantitative analysis was carried out three times.
For identification, purified catechin, chlorogenic acid and phlorizin dihydrate were analyzed by GC–MSD, equipped with a Supelcowax 10 fused silica capillary (30 m length × 0.25 mm i.d. supelco, USA). The carrier gas used was helium, at a constant flow rate of 1.0 ml/min. Two microliter of purified catechin, chlorogenic acid and phlorizin dihydrate was injected into the column using 10:1 of the split ratio injection mode. The oven temperature was initially held at 100°C for 3 min, then raised to 300°C for 5 min, and finally held at 300°C for 48 min. The temperatures of injector and detector were 200°C and 240°C, respectively. The mass detector was operated in electron impact mode with an ionization energy of 70 eV, a scanning range of 33–550 a.m.u.
and a scan rate of 1.4 scans/s. Purified catechin, chlorogenic acid and phlorizin dihydrate were positively identified by comparing the mass spectra and RIs in the Wiley 275 Imass spectral database (Hewlett-Packard, 1995).
φ X-174 RF I plasmid DNA damage assay
Conversion of the supercoiled form of plasmid DNA to the open-circular and further linear forms has been used as an index of DNA damage (Jung and Surh, 2001). Reaction mixtures (25 μl) contained 5 μl of φX-174 RF I plasmid DNA, 10 μl of varying concentrations of purified catechin, chlorogenic acid and phlorizin dihydrate, 5 μl of 1 mM FeSO
4and 5 μl of 1 mM H
2O
2and were incubated at 37
oC for 30 min. After 30 min, 5 μl of a solution containing 50% glycerol (v/v), 40 mM EDTA and 0.05% bromophenol blue was added to stop the reaction and the reaction mixtures were electrophoresed on 1% agarose gel, and the DNA in the gel was visualized and photographed under ultraviolet light after ethidium bromide staining.
Western blot of phosphorylated H2A.X in hydroxyl radical-treated NIH 3T3 cells
NIH 3T3 cells (2 × 10
6) were cultured in 6-well plates with or without a cover glass for 24 h at 37
oC. After 24 h, purified catechin was treated and then incubated for 1 h at 37
oC. After 1 h, total concentration of 1 mM FeSO
4and H
2O
2was treated and then the cells were incubated for 24 h at 37
oC. For Western blot analysis, after 24 h, each cells were lysed with lysis buffer (50 mM Tris-HCl pH 7.4, 150 mM NaCl, 1 mM EDTA, 1 mM EGTA, 10 µg/ml aprotinin, 10 µg/ml leupeptin, 5 mM phenylmethylsulfonyl fluoride [PMSF], and 1 mM DTT) containing 1 % Triton X-100. Insoluble debris was removed by centrifugation at 15,000 g for 15 min three times.
The protein extracted from the cells was separated on 15 %
Tris-HCl ready gel (Bio-rad, Hercules, CA) following the
manufacturer’s instruction. Gels were transblotted on to PVDF
membranes. The membranes were blocked for non-specific
binding for 90 min in block buffer (5 % non-fat milk and
0.1 % Tween 20 in 1×Tris-buffered saline[TBS]) and then
washed with 1×TBS solution (0.1% Tween 20 in 1×TBS). After
washing with 1×TBS solution, the membrane was incubated
with phospho-H2A.X primary antibody at 1:500 dilutions in
antibody dilution buffer (5% BSA, 1×TBS, 0.1% Tween 20)
with gentle shaking at 4
oC for 16 h and then washed with
1×TBS solution. After washing, the membranes were incu-
bated with Phototope-HRP Western Blot Detection System,
Anti-rabbit IgG, HRP-linked Antibody as the secondary
antibody at 1:500 dilutions in antibody dilution buffer (5%
non-fat milk and 0.1% Tween 20 in 1×TBS) for 1 h and then washed again. After washing, the membranes were treated with the detection agent (Amersham Biosciences) and imme- diately developed in Polaroid film. For immuno-staining analysis, the cells were fixed with 2% formaldehyde for 1 h and then washed with 1×PBS for 5 min three times. PBS with 10% fetal bovine serum (PBS/FBS) was then added to block non-specific binding for an hour. After washing, anti phospho-H2A.X polyclonal anti-body was diluted in 0.1%
saponin/PBS/FBS solution at 1:250 dilutions for 18 h at 4
oC with gently shaking, and then washed with 1×PBS for 5 min three times. Subsequent antibody, Alexa-Flour 488 goat anti- rabbit IgG, and DAPI were used against phospho-H2A.X antibody and nuclei, respectively and the cells were incu- bated in the dark for an hour. Then, the cells were washed with 1×PBS and mounted with antifade mounting medium.
Mounted slides were viewed under a fluorescence micros- cope using a 60×oil immersion objective. The excitation wavelengths for DAPI and phospho-H2A.X were 359 nm and 494 nm, respectively.
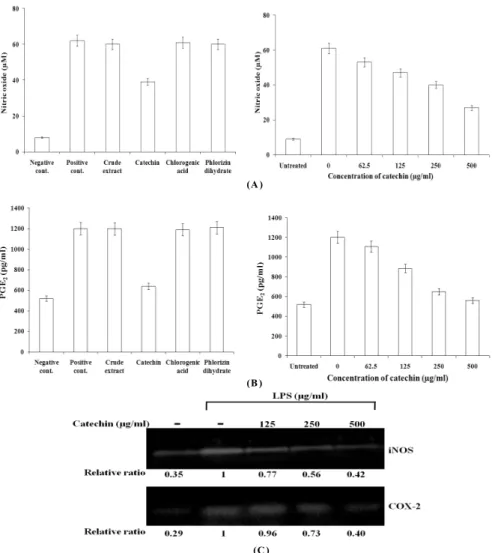
Determination of NO and PGE
2production in LPS- stimulated RAW264.7 cells
Inhibitory effects of purified catechin, chlorogenic acid and phlorizin dihydrate on the production of nitric oxide (NO) in RAW 264.7 cells was evaluated using a method modified from that previously reported (Banskota et al., 2003). RAW 264.7 cells (2×10
5cells/well) in 10% FBS- DMEM without phenol red were seeded in a 6-well plate for 24 h at 37
oC. Cells were washed with 1 X PBS, replaced with fresh media, and then treated with the varying concentrations of purified catechin, chlorogenic acid and phlorizin dihydrate for 1 hour. LPS (1 μg/ml) was treated for 24 h at 37
oC. After 24 h, 200 μl of the medium were placed in a 96-well plate and an equal amount of Griess reagent (1% sulfanilamide and 0.1% N-1-(naphthyl) ethylenediamine-diHCl in 2.5% H
3PO
4) was added. The plate was incubated for additional 5 min at the room temperature and then the absorbance was measured at 540 nm with a SepectraMax 340 microplate reader. The amount of nitric oxide was calculated using sodium nitrite standard curve. For the measurement of Prostaglandin E
2(PGE
2) production, 50 μl of the supernatant of cultured medium was collected, and PGE
2production was determined using prostaglandin E2 ELISA monoclonal Kit with manu- facturer’s instructions.
Western blot for iNOS and COX-2 in LPS-stimulated RAW264.7 cells
RAW 264.7 cells (2×10
5cells/well) were seeded in a 6-well plate for 24 h at 37
oC. Cells were washed with 1×PBS, replaced with fresh media, and then treated with the varying concentrations of purified catechin, chlorogenic acid and phlorizin dihydrate for 1h. After 1 h, LPS (1 μg/ml) was treated for 24 h at 37
oC. Each cell was harvested and lysed with lysis buffer (50 mM Tris-HCl pH 7.4, 150 mM NaCl, 1 mM EDTA, 1 mM EGTA, 10 μg/ml aprotinin, 10 μg/ml leupeptin, 5 mM phenylmethylsulfonyl fluoride [PMSF], and 1 mM DTT) containing 1 % Triton X-100. Insoluble debris was removed by centrifugation at 12,000 g for 15 min three times. Fifty microgram of each protein from the cells was separated on 8% Tris-HCl ready gel (Bio-rad, Hercules, CA) following the manufacturer’s instruction. Gels were trans- blotted on to PVDF membranes. The membranes were blocked for non-specific binding for 90 min in block buffer (5% non-fat milk in 1×TBS solution containing 0.1% Tween- 20) and then washed with 1×TBS solution (0.1% Tween-20 in 1×TBS). The membranes were incubated with iNOS and COX-2 antibody at 1:1000 dilutions in antibody dilution buffer (3% non-fat milk in 1×TBS containing 0.1% Tween- 20) with gentle shaking at 4
oC for 18 h and then washed with 1×TBS. After washing, the membranes were incubated with Phototope-HRP Western Blot Detection System, Anti-rabbit IgG, HRP-linked Antibody as the secondary antibody at 1:1000 dilutions in antibody dilution buffer (3% non-fat milk in in 1×TBS solution containing 0.1% Tween-20) for 1 h at the room temperature and then washed again. After washing, the membranes were treated with the detection agent (Amersham Biosciences) and immediately developed in Polaroid film.
Statistical analysis
All results were expressed as the mean ± the standard
deviation of triplicate analysis. Statistical comparisons were
Fig. 1. Purification and identification of catechin, chlorogenic acid and phlorizin dihydrate from apples. HPLC chromatogram of standards (upper panel) and crude extracts from apples (lower panel).
Fig. 2. Chemical structures and GC/MS spectrums of purified catechin (upper panel), chlorogenic acid (middle panel) and phlorizin dihydrate (lower panel). In identification by GC/MS, phenolic compounds were identified with the aid of the Wiley 275 Imass spectral database (Hewlett-Packard, 1995).
performed using the Student’s t-test. Differences were considered significant at p < 0.05.
Results
Purification and identification of catechin, chlorogenic acid and phlorizin dihydrate from apples
Purification and identification of catechin, chlorogenic acid and phlorizin dihydrate from apples were carried out by HPLC and GC/MS analysis. Fig.1 and 2 show the HPLC chromatogram and GC/MS spectrums of catechin, chlo- rogenic acid and phlorizin dihydrate from apples. The retention time of the HPLC chromatogram of purified catechin, chlorogenic acid and phlorizin dihydrate from apples was in accord with that of its standards. Also in GC/MS analysis, purified catechin, chlorogenic acid and phlorizin dihydrate from apples were identified as authentic catechin, chlorogenic acid and phlorizin dihydrate in the Wiley 275 Imass spectral database (Hewlett-Packard, 1995) by being in accord with the GC/MS spectrum of catechin,
chlorogenic acid and phlorizin dihydrate from apples. Also we measured the amount of catechin, chlorogenic acid and phlorizin dihydrate from apples through comparing the peak area of standards. The total amount of catechin, chlorogenic acid and phlorizin dihydrate from apples was approximately 1.01 ± 0.45, 7.01 ± 0.36 and 3.67 ± 0.42, respectively (Table 1).
Catechin, chlorogenic acid and phlorizin dihydrate from apples prevent DNA from oxidative damage in the non- cellular system and cellular system
The plasmid DNA cleavage assay using phi X-174 RF I
plasmid DNA was used as an initial approach toward
Table 1. Contents of catechin, chlorogenic acid and phlorizin dihydrate from apples.
Phenolic compounds Contents (mg / kg wet weight)
Catechin 1.01 ± 0.45
Chlorogenic acid 7.01 ± 0.36
Phlorizin dihydrate 3.67 ± 0.42
(A)
(B)
Fig. 3. Anti-oxidative DNA damage of catechin, chlorogenic acid and phlorizin dihydrate from apples in the non-cellular system using phi-X 174 RF I plasmid DNA (A) and in the cellular system using NIH 3T3 cells (B). In Fig. A., SC, OC and LC mean supercoiled form, open-circular form and linear form, respectively. Relative ratio of remaining SC was measured using the software Un-SCAN-IT gel Version 5.1 (Silk Scientific, Inc.). In Fig. B., upper and lower images show Western blot and immuno-staining for the expression level of phospho-H2AX. In SDS-PAGE, 50 µg protein was separated with 15 % Tris-HCl gel. Relative ratio was measured using the software Un-SCAN-IT gel Version 5.1 (Silk Scientific, Inc.).
determining whether catechin, chlorogenic acid and phlorizin dihydrate from apples could protect DNA from oxidative damage induced by hydroxyl radical. In this assay, induction of single strand breaks to supercoiled double stranded plasmid DNA leads to formation of open circular DNA, while the formation of a linear form of DNA is indicative of double strand breaks (Li and Trush, 1993). Fig. 3A shows gel electrophoretogram of the protective effect of catechin, chlorogenic acid and phlorizin dihydrate from apples on the cleavage of the plasmid DNA by hydroxyl radical. As observed in Fig. 3A, the plasmid DNA was mainly super- coiled form (SC) in the absence of hydroxyl radical. In the treatment of hydroxyl radical without catechin, chlorogenic acid and phlorizin dihydrate from apples, SC was completely converted into open-circular form (OC). However, in presence of hydroxyl radical, addition of catechin, chlorogenic acid and phlorizin dihydrate from apples inhibited the conversion of SC into OC and linear form (LC). At 250 µg/ml, catechin and phlorizin dihydrate significantly inhibited oxidative DNA damage by 82% and 68%, respectively, while chloro- genic acid did not inhibits oxidative DNA damage. In the dose-dependent assay of catechin with the strongest activity on oxidative damage, catechin inhibited oxidative DNA damage by 46% at 62.5 µg/ml, 61% at 125 µg/ml, 79% at 250 µg/ml, and 91% at 500 µg/ml.
Also, protective effect of catechin against intracellular DNA damage induced by hydroxyl radical was evaluated by the expression level of phospho-H2AX by Western blot and immuno-staining in the cellular system using NIH 3T3 cells.
The phosphorylation of H2AX, a sensitive marker for breaks of double stranded DNA (Rogakou et al., 1998). In Western blot analysis of phospho-H2AX (Fig. 3B), hydroxyl radical induced hyper-phosphorylation of H2AX compared with the cells without hydroxyl radical and catechin, which means the induction of oxidative DNA damage. However, the treatment
of catechin dose-dependently inhibits the phosphorylation
of H2AX by 21% at 62.5 µg/ml, 41% at 125 µg/ml, 64% at
250 µg/ml, and 81% at 500 µg/ml. This result was confirmed
by changes of phospho-H2A.X foci into the nucleus in
immuno-staining. From these results, it is thought that
catechin inhibits oxidative DNA damage.
(A )
(B )
(C )