Comparison of Measured and Calculated Carboxylation Rate, Electron Transfer Rate and Photosynthesis Rate Response to Different Light Intensity and Leaf Temperature in Semi-closed Greenhouse with Carbon
Dioxide Fertilization for Tomato Cultivation
Eun-Young Choi1, Young-Ae Jeong2, Seung-Hyun An3, Dong-Cheol Jang4, Dae-Hyun Kim5, Dong-Soo Lee6, Jin-Kyung Kwon7, and Young-Hoe Woo8*
1Professor, Department of Agricultural Science, Korea National Open University, Seoul 03087, Korea
2Graduate Student, Department of Agriculture and Life Science, Korea National Open University, Seoul 03087, Korea
3Undergraduate Student, Department of Agricultural Science, Korea National Open University, Seoul 03087, Korea
4Postdoctoral Researcher, Department of Horticulture, College of Agriculture and Life Science, Kangwon National University, Chuncheon 24341, Korea
5Professor, Department of Biosystems Engineering, College of Agriculture and Life Science, Kangwon National University, Chuncheon 24341, Korea
6Postdoctoral Researcher, Department of Agricultural Engineering, Energy and Environmental Engineering Division, Jeonju 54875, Korea
7Researcher, Department of Agricultural Engineering, Energy and Environmental Engineering Division, Jeonju 54875, Korea
8Professor, Department of Horticulture Environment System, Korea National College of Agriculture and Fisheries, Jeonju 54874, Korea
Abstract. This study aimed to estimate the photosynthetic capacity of tomato plants grown in a semi-closed greenhouse using temperature response models of plant photosynthesis by calculating the ribulose 1,5-bisphosphate carboxylase/
oxygenase maximum carboxylation rate (Vcmax), maximum electron transport rate (Jmax), thermal breakdown (high- temperature inhibition), and leaf respiration to predict the optimal conditions of the CO2-controlled greenhouse, for maximizing the photosynthetic rate. Gas exchange measurements for the A-Ci curve response to CO2 level with different light intensities {PAR (Photosynthetically Active Radiation) 200µmol·m-2·s-1 to 1500µmol·m-2·s-1} and leaf temperatures (20°C to 35°C) were conducted with a portable infrared gas analyzer system. Arrhenius function, net CO2 assimilation (An), thermal breakdown, and daylight leaf respiration (Rd) were also calculated using the modeling equation. Estimated Jmax, An, Arrhenius function value, and thermal breakdown decreased in response to increased leaf temperature (> 30°C), and the optimum leaf temperature for the estimated Jmax was 30°C. The CO2 saturation point of the fifth leaf from the apical region was reached at 600ppm for 200 and 400µmol·m-2·s-1 of PAR, at 800ppm for 600 and 800µmol·m-2·s-1 of PAR, at 1000ppm for 1000µmol of PAR, and at 1500ppm for 1200 and 1500µmol·m-2·s-1 of PAR levels. The results suggest that the optimal conditions of CO2 concentration can be determined, using the photosynthetic model equation, to improve the photosynthetic rates of fruit vegetables grown in greenhouses.
Additional key words : Arrhenius function, net CO2 assimilation, rubisco, saturation point, thermal breakdown
*Corresponding author: [email protected]
Received September 24, 2021; Revised October 16, 2021;
Accepted October 25, 2021
Introduction
The cultivation areas of vegetables were 171,429ha for the open field and 54,443ha for the greenhouse. Most of the fruit vegetables (85.6%) were grown in the greenhouse.
Vegetable production in greenhouses has been continuously declining since reaching 3.13 million tons in 2009 (MAFRA,
2019). It is well known that increasing CO2 concentration positively improves leaf photosynthesis and thus productivity.
The concentration of CO2 in the greenhouse can be lower than the concentration in the atmosphere when the greenhouse is not ventilated during winter, resulting in a considerable yield decrease. Therefore, a proper CO2 control system that reflects the variation of growth environments depending on greenhouse types and crop growth stages needs to be developed. A previous study suggested optimal setpoints for indoor CO2 concentration (Peet and Willits, 1987); however,
the estimated optimal CO2 concentration varies depending on ventilation, wind speed, or window aperture (Nederhoff, 1987; Sanchez-Guerrero et al., 2005). Also, cost-efficient control of CO2 supplies is necessary since pure CO2 is expensive. A proper CO2 control system may need to replenish CO2 concentration to maintain leaf photosynthesis effectively under different temperatures and radiation.
There is a model that describes leaf photosynthesis efficiency enhanced by the increased CO2 concentration (Farquhar et al., 1980). The rate of CO2 assimilation in plants depends on biochemical processes, light intensity, temperature, and CO2 concentration in the cytoplasm, thylakoid membrane, stroma, mitochondria. The most common methods used to understand C3 photosynthesis reactions are models of pho- tosynthesis developed by Farquhar et al. (1980). In this model, the rate of photosynthesis may vary depending on the state of ribulose 1,5-bisphosphate carboxylase/oxygenase (Rubisco) that supplies sufficient ribulose 1,5-bisphosphate (RuBP), known as the Rubisco-limited photosynthesis rate, and occurs in low CO2 concentrations. The photosynthesis rate can also depend on the regeneration rate of RuBP, which occurs under high CO2 conditions. Rubisco and RuBP restrictions typically occur at <20Pa (-200ppm) CO2 and at
>30Pa CO2, respectively. The triose phosphate use (TPU) limiting factor can set the maximum photosynthesis rate (Amax) by increasing the CO2 rate or oxygen concentration (Sharkey, 1985). Plant photosynthetic capacity is, therefore, determined by the maximum rate of Rubisco carboxylation (Vcmax) and the maximum rate of electron transport (Jmax) at a reference temperature (generally 25°C) using the response of An to intercellular CO2 concentration (A-Ci response curves). The parameters estimated from the analysis of an A-Ci curve respond to measurement temperature; thus, comparisons between two treatments are often made at a single temperature. Representative temperature responses of the fitted parameters are used to adjust these values to a single temperature, in this case, at 25°C (Sharkey et al., 2007). The C3 photosynthesis model proposed by Farquhar et al. (1980) has been applied to estimate leaf photosynthesis- dependent temperature (Medlyn et al., 2002a; Kattge and Knorr, 2007) since the biochemical processes are temperature- dependent (Harley et al., 1992; Leuning, 2002; Medlyn et al., 2002b). Net CO2 uptake for photosynthesis depends on
growth temperature (Hikosaka et al., 2006; Sage and Kubien, 2007). Recently, Kim et al. (2020) estimate heat stress reduction of cucumber plants by solar shading in a green- house by measuring and analyzing physiological conditions, such as leaf temperature, leaf-air temperature, Vcmax, Jmax, thermal breakdown, and leaf respiration.
This study aimed to estimate photosynthetic capacity for tomato plants grown in a semi-closed greenhouse using temperature response models of plant photosynthesis by calculating Vcmax, Jmax, thermal breakdown, and leaf respiration to predict optimal conditions of the CO2-controlled green- house to maximize photosynthetic rate.
Materials and Methods
1. Plant Growth Environments
This study was conducted by growing tomatoes in a semi-closed greenhouse with hydroponics under integrated solar radiation (ISR)-automated irrigation. The tomatoes (Solanum lycopericum L. 'Dafnis') were transplanted onto coconut coir substrates ((Chip:Dust, 7:3), DY GS, Korea) on March 23, 2021. One dripper per plant was installed to supply a uniform feeding amount for each crop, and the tomato nutrient solution developed by RDA was provided to the automatic feeding system ((Macro-nutrients (me L-1):
NO3-N (8.2), NH4-N (1.4), P (2.0), K (5.0), Ca (4.0), Mg (2.0), SO4-S (2.0), Micro-nutrients (ppm): Fe (3.0), Cu (0.02), B (0.5), Mn (0.5), Zn (0.05), Mn (0.01)). The electrical conductivity and pH were controlled at 2.0–2.5dS·m-1 and 5.3–6.8, respectively. The tomatoes were trained into a one-stem vine. The shading screen was closed between 11 a.m. and 2 p.m. when the light intensity reached 700W·m-2 in the greenhouse and the air temperature was more than 30°C. During the experimental period, the minimum night temperature was set to 18°C, and the day temperature was set to 23°C. The internal and external environments of the greenhouse (e.g., temperature, humidity, solar radiation, and CO2) were measured beginning May 7, 2021 using a greenhouse environmental control system (Magma 3.0, GreenCS, Jeonnam, Korea). The ISR was set to 100J·cm-2 from the first irrigation to the end, and the water volume per plant in a day was 1.5–2.0L. Tomato harvesting was carried out beginning May 23, two months after the transplant, and a 12
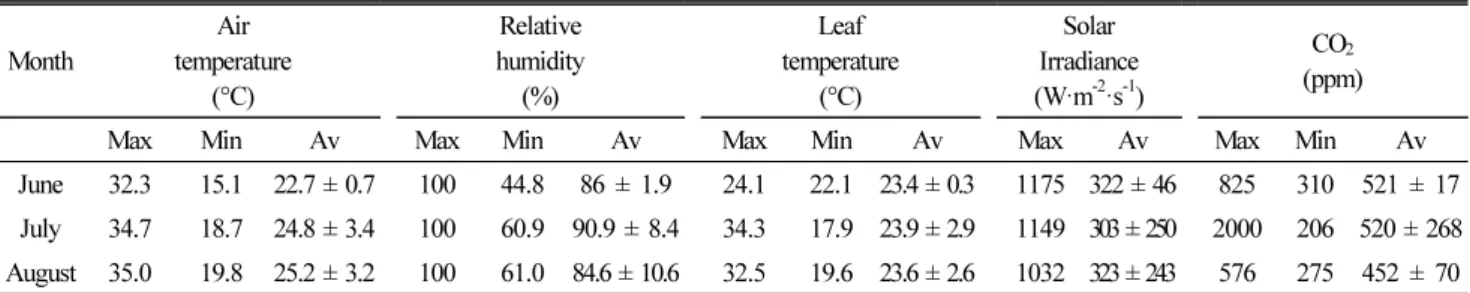
Table 1. Maximum (Max), minimum (Min), and average (Av) of air temperature, relative humidity, leaf temperature, solar radiation, and CO2
concentration in a semi-closed greenhouse for tomato cultivation from June 22 to August 9, 2021.
Month Air
temperature (°C)
Relative humidity
(%)
Leaf temperature
(°C)
Solar Irradiance (W·m-2·s-1)
CO2
(ppm)
Max Min Av Max Min Av Max Min Av Max Av Max Min Av
June 32.3 15.1 22.7 ± 0.7 100 44.8 86 ± 1.9 24.1 22.1 23.4 ± 0.3 1175 322 ± 46 825 310 521 ± 17 July 34.7 18.7 24.8 ± 3.4 100 60.9 90.9 ± 8.4 34.3 17.9 23.9 ± 2.9 1149 303 ± 250 2000 206 520 ± 268 August 35.0 19.8 25.2 ± 3.2 100 61.0 84.6 ± 10.6 32.5 19.6 23.6 ± 2.6 1032 323 ± 243 576 275 452 ± 70
Table 2. Photosynthetic parameter values for equations for the mean Vcmax and Jmax.
Outputs Vcmax Jmax Unit
ΔHa 58,520 37,000 J·mol-1
ΔHd 149,250 152,040 J·mol-1
ΔS 485 495 J·mol-1·K-1
ΔHa : activation energy Δ : energy of deactivation Δ : entropy
to 18 leaf number was maintained by removing the old leaves once a week. The apical shoot was placed approximately 2.5 to 3.0 meters above the gutter.
In this experiment, all the measurements were conducted with the plants that its plant height was 271 (±8.20)cm, 343 (±6.51)cm and 416 (±5.74)cm at June 22, July 14, and August 3, 2021, respectively with the 7.8 (±0.37), 10.8 (±0.20) and 13.4 (±0.40) of cluster number, the 39.0 (±1.05), 43.9 (±1.51) and 42.0 (±2.30) of leaf length and 33.2 (±5.06), 39.3 (±2.42) and 36.9 (±5.12) of leaf width of fifth leaves from the apical region at June 22, July 14, and August 3, 2021, respectively.
2. Measurements
Total 16 replications of gas exchange measurements were conducted with a portable infrared gas analyzer system (LI-6400XT; Li-Cor, Inc., Lincoln, NE, USA) during the June 22 to August 9, 2021. One of the youngest fully expanded leaflets on the fifth leaf of the apical shoot was placed in the leaf chamber of gas analyzer. For the A-Ci
curve response to CO2 level, the reference CO2 for the A-Ci
curves was changed in the following order: 50, 100, 200, 300, 600, 800, 1000, 1500, and 1800µmol·mol-1 at the PAR values of 200, 400, 600, 800, 1000, 1200, and 1500µmol·m-2·s-1
with the 34.54℃ average air temperature. For the A-Ci
curve response to different leaf temperatures, the leaf tem- perature was increased from 20°C to 35°C with 5°C increments, and A-Ci response curves were recorded at each temperature and the reference CO2 levels and a 700µmol·m-2·s-1 PAR value. The significance between environmental factors was analyzed with variable selection stepwise using the SAS 9.2 software package (SAS Institute, Cary, NC, USA).
3. Comparison of Observed and Estimated Responses to Different Light Intensity and Temperature
We used the Arrhenius equation to describe the kinetic temperature responses of Vcmax and Jmax. Arrhenius function, Vcmax, Jmax, thermal breakdown, Rd were calculated using the selected model. The program was developed using SAS (SAS Institute Inc 9.1, Cary, NC, USA). Relationships among Vcmax, Jmax, and other environmental factors were analyzed stepwise.
The Arrhenius function is as follows:
exp
∆
where 匍匞 is leaf temperature, R is the universal gas
Table 3. Comparison of Rubisco maximum carboxylation rate (Vcmax), maximum electron transport rate (Jmax), leaf respiration under daylight (Rd) from gas exchange measurements and calculations and calculated Arrhenius function [f(Tl)], and thermal breakdown [fH(Tl)] in a semi-closed greenhouse for tomato cultivation at the June 22 and July 14, 2021.
Outputs At leaf temperature (n=5) Normalized to 25°C (n=5) Calculated at 25°C (n=51) Vcmaxz
(µmol·m−2·s−1) 102 (±14)x 87.51 (±7.485) 84.29 (±0.864)
Jy (µmol·m−2·s−1) 126 (±10) 115 (±6.178) 133 (±0.423)
TPU (µmol·m−2·s−1) 9.163 (±0.722) 8.423 (±0.488)
Rd (µmolCO2·m−2·s−1) 4.658 (±0.563) 4.228 (±0.448) 1.338 (±0.021)
f (Tl) (relative value) 1.090 (±0.012)
fH (Tl) (relative value) 0.940 (±0.008)
zy: Rubisco maximum carboxylation rate (Vcmax) and electrical transport rate (J) from the A-Ci curve response to CO2 levels of 50, 100, 200, 300, 600, 800, 1000, 1500, and 1800µmol·mol-1.
x: Each value is the mean of five plants of five measurements at both June 22 and July 14, 2021.
constant (8.314J·K-1·mol-1), and ΔHa is the activation energy (J·mol-1). Parameter values for Vcmax and Jmax are presented in Table 2 (Farquhar et al., 1980; Leuning, 2002; Caemmerer, 2000).
The Vcmax is calculated as follows:
exp
exp
where, is the carboxylation rate at 25°C (µmol·m-2·s-1), 0.088 is temperature coefficient for that parameter at 25°C and 0.29 is temperature coefficient for that parameter at 41°C (Campbell and Norman, 1998).
The Jmax is calculated as follows:
max max
max
where, is the deactivation energy[J·mol-1]
max
where Medlyn et al. (2002b) derived this equation at 25°C using Bernacchi et al. (2001).
The thermal breakdown is calculated as follows:
exp
∆ ∆
exp
∆ ∆
where,ΔS is the entropy (JK-1·mol-1) and Δ is the energy of deactivation (J·mol-1).
The leaf Rd is calculated as follows:
exp
exp
where, is the leaf respiration at 25°C (µmol·m-2·s-1), and leaf respiration is typically 1%-2% of Vcmax
(Caemmerer, 2000).
An is calculated as follows;
where is considered as the Vcmax, at 25°C (frequently used for C3 plants (Collatz et al., 1991)), Vcmax,25 = 78.2µmol·m-2·s-1 for C3 plant, herbaceous Ci = 245µmol·mol-1 for C3 plant, and × ×
× , ×.
Results and Discussion
The average air temperature was 22.7°C, 24.8°C, and 25.2°C for June, July, and August, respectively, and the average leaf temperature was slightly lower than the air temperature in July and August. The maximum and average levels of solar irradiance were 1,175 and 323W·m-2·s-1,
Table 4. Comparison of Rubisco maximum carboxylation rate (Vcmax), maximum electron transport rate (Jmax), leaf respiration under daylight (Rd) from gas exchange measurements and calculations and calculated Arrhenius function [f(Tl)], and thermal breakdown [fH(Tl)] with light intensity in a semi-closed greenhouse for tomato cultivation.
Outputs At leaf temperature Normalized to 25°C Calculated at 25°C
30.78 PAR 600
Vcmaxz 128 77.39 95 (±0.113)
Jy 131 93.59 132 (±0.304)
TPU 9.53 7.23 -
Rd 5.44 3.80 1.76 (±0.013)
f (TL) - - 1.33 (±0.007)
fH (TL) - - 0.760 (±0.005)
30.82 PAR 800
Vcmax 127 77 95 (±0.030)
J 139 99 132 (±0.057)
TPU 9.70 7.4 -
Rd 4.30 3.00 1.75 (±0.003)
f (Tl) - - 1.32 (±0.001)
fH (Tl) - - 0.770 (±0.001)
30.75 PAR 1000
Vcmax 148 89.43 95 (±0.112)
J 159 114 133 (±0.196)
TPU 11.21 8.50 -
Rd 5.15 3.60 1.74 (±0.009)
f (Tl) - - 1.32 (±0.005)
fH (Tl) - - 0.770 (±0.004)
32.87 PAR 1200
Vcmax 180.3 108.9 96 (±0.058)
J 179.6 128.0 126 (±1.014)
TPU 12.5 9.5 -
Rd 5.9 4.1 1.99 (±0.031)
f (Tl) - - 1.44 (±0.016)
fH (Tl) - - 0.670 (±0.013)
34.18 PAR 1500
Vcmax 216 98 95 (±0.049)
J 176 104 118 (±0.205)
TPU 12.1 8.9 -
Rd 5.49 3.14 2.20 (±0.005)
f (Tl) - - 1.55 (±0.003)
fH (Tl) - - 0.584 (±0.002)
zy: Rubisco maximum carboxylation rate (Vcmax) and electrical transport rate (J) from the A-Ci curve response to CO2 level, 50, 100, 200, 300, 600, 800, 1000, 1500, and 1800µmol·mol-1 at PAR values of 200, 400, 600, 800, 1000, 1200, and 1500µmol·m-2·s-1 with with the 34.54° average air temperature.
respectively. The maximum level of CO2 ranged between 576 and 825ppm, and the extremely higher concentration, 2,000ppm, was found only on a single day (Table 1).
Vcmax and Jmax normalized to 25°C of the gas exchange measurement for the A-Ci curve response to CO2 level from June to July was 87.51 and 115µmol·m-2·s-1, respectively with a similar value for the calculated Vcmax at 84.29µmol·m-2·s-1, and a higher calculated Jmax at 133µmol·m-2·s-1 (Table 3).
The thermal breakdown was 0.940 (relative value; R.V.), and the Rd was 1.338, which was 3-fold lower than that normalized at 25°C from the gas exchange measurements, 4.228. The Arrhenius function [f(Tl)] value was 1.09.
While 25°C-normalized Vcmax, J and Rd from gas exchange measurements and calculation increased according to the PAR values of 600, 800, 1000, and 1200µmol·m-2·s-1, both values declined at the PAR 1500 level, which may be due to the increased leaf temperature (34.18°C) during the measu- rement, of which the estimated thermal breakdown [fH(Tl)]
value was the lowest at 0.584 (Table 4). The estimated Arrhenius function f(Tl) value was 1.33 at PAR 600 (30.78°C), 1.32 at PAR 800 (30.82°C), 1.32 at PAR 1000 (30.75°C), 1.44 at PAR 1200 (32.87°C), and 1.55 at PAR 1500 (34.18°C).
The Arrhenius function value indicates the growth response according to temperature, meaning there is a positive cor- relation between the values and sensitivity to temperature.
The estimated Jmax declined from the PAR 1200 level, where the leaf temperature was measured at 32.87°C.
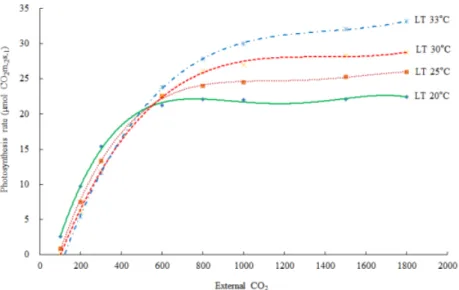
The photosynthetic rates of the fifth leaves from the apical region were saturated at a light intensity of 1200µmol·m-2·s-1 and reached the saturation point at a CO2 concentration of 1500ppm (Fig. 1). The CO2 saturation point was reached at CO2 600ppm for 200 and 400µmol·m-2·s-1 PAR, CO2 800ppm for 600 and 800µmol·m-2·s-1 PAR, CO2 1,000ppm for 1000µmol·m-2·s-1 PAR, and CO2 1500ppm for 1200 and 1500µmol·m-2·s-1 PAR levels (Fig. 1). In the semi-closed greenhouse, average PAR level ranged about 400 and maximized 1060µmol·m-2·s-1 during the day of August, indicating that supplementatal level for CO2 can be raised by the range between 600 and 1000ppm to maximize photo- synthesis rate in the light intensity of semi-closed green- house.
Table 5. shows the leaf temperature dependence of Vcmax
and Jmax. While 25°C-normalized Vcmax increased with leaf
Fig. 1. Photosynthesis rate response to different light intensity. The reference CO2 was changed in the following order: 50, 100, 200, 300, 600, 800, 1000, 1500, and 1800µmol·m-2·s-1 at the PAR value from 200 to 1500µmol·m-2·s-1 with the air ambient temperature.
Fig. 2. Photosynthesis rate response to different the leaf temperature increased from 20°C to 35°C with 5°C increment and A-Ci response curves were recorded at each temperature after at least 10 min of steady state at the reference CO2 levels and at a 700µmol·m-2·s-1 PAR value.
temperature from 20 to 33°C, the J declined at the 33°C leaf temperature. Our estimates of Vcmax and Jmax were close to the measurements with the declined Jmax at the leaf tem- perature higher than 30°C, and a leaf temperature optimum for the estimated Jmax was 30°C (Table 5). Leuning (2002) examined the temperature-dependent Vcmax and Jmax using published datasets and showed a high variability of Jmax/Vcmax
between and within species at leaf temperature > 30°C with Jmax0/Vcmax0 = 2·00±0·60 (SD, n=43), at leaf temperature = 25°C with a temperature optimum near 40°C for Vcmax, and
35°C for Jmax of cotton plant (Harley et al., 1992). The Arrhenius function [f(Tl)] value was in the order of 0.772 at 20°C, < 0.984 at 25°C, < 1.219 at 30°C, and < 1.466 at 33°C of leaf temperature. The thermal breakdown [fH(Tl)] value was in the order of 1.102 at 20°C > 1.008 at 25°C > 0.847 at 30°C > 0.651 at 33°C of leaf temperature. The calculated Rd
increased according to the leaf temperature. In this experiment, the leaf temperature was increased from 20°C to 35°C with 5°C increment and A-Ci response curves were recorded at each temperature; however, at least 10 min of steady state at
Table 5. Comparison of Rubisco maximum carboxylation rate (Vcmax), maximum electron transport rate (Jmax), leaf respiration under daylight (Rd) from gas exchange measurements and calculations and calculated Arrhenius function [f(Tl)], and thermal breakdown [fH(Tl)] with different leaf temperatures in a semi-closed green- house for tomato cultivation.
Outputs At Leaf Temperature Normalized to 25°C Calculated at 25°C 20°C
Vcmaxz 72 113 56.86 (±0.061)
Jy 128 174 111 (±0.067)
TPU 9.3 13.0
Rd 5.6 7.7 0.836 (±0.001)
f (Tl) 0.772 (±0.001)
fH (Tl) 1.102 (±0.000)
25°C
Vcmax 124 126 76.80 (±1.210)
J 159 160 129 (±0.971)
TPU 11.1 11.3
Rd 8.1 8.2 1.16 (±0.021)
f (Tl) 0.984 (±0.014)
fH (Tl) 1.008 (±0.007)
30°C
Vcmax 213 149 91.39 (±1.489)
J 195 153 134 (±0.320)
TPU 13.0 10.5
Rd 11.1 8.6 1.565 (±0.052)
f (Tl) 1.219 (±0.029)
fH (Tl) 0.847 (±0.022)
33°C
Vcmax 318 161 95.76 (±0.202)
J 231 146 124 (±1.847)
TPU 15.8 11.6
Rd 15.6 9.6 2.03 (±0.058)
f (Tl) 1.466 (±0.029)
fH (Tl) 0.651 (±0.024)
zy: Rubisco maximum carboxylation rate (Vcmax) and electrical transport rate (J) from the A-Ci curve response to different leaf temperatures, the leaf temperature was increased from 20°C to 35°C with 5°C increment and A-Ci response curves were recorded at each tem- perature with 700µmol·m-2·s-1 PAR value.
Table 6. Partial R-Square and multiple regression analysis stepwise between calculated Vcmax and Jmax, leaf and air temperatures, air CO2, and relative humidity in a semi-closed greenhouse from June 22 to August 9, 2021.
Dependent
variable Variable entered Partial
R-square Model
R-square Pr > F
Vcmax
Leaf temperature 0.9860 0.9860 <.0001
Jmax 0.0123 0.9983 <.0001
Air temperature 0.0001 0.9984 <.0001
Air CO2 0 0.9984 <.0001
Relative humidity 0 0.9984 <.0001
Table 7. Partial R-Square and multiple regression analysis by stepwise between calculated An (net photosynthesis rate), leaf and air temperatures, CO2 and relative humidity, and calculated leaf respiration in the semi-closed greenhouse during the June 22 to August 9, 2021.
Dependent
Variable Variable Entered Partial
R-Square Model
R-Square Pr > F
An
Leaf temperature 0.986 0.986 <.0001 Calculated leaf respiration 0.011 0.997 <.0001
Air CO2 0.000 0.997 <.0001
Relative humidity 0.000 0.997 <.0001 Air temperature 0.000 0.997 <.0001 the reference CO2 levels should not have, resulting to
maximum 33°C of leaf temperature (Fig. 2). The estimated An decreased at the high leaf temperature. The extimated photosynthetic rates were saturated at al leaf temperature of 32.4°C (Fig. 3)
According to the multiple regression analysis by the stepwise variable selection method, the partial R-square for the Vcmax, a dependent variable, was larger with the leaf temperature (0.9860) than the other factors, Jmax (0.0123) or air temperature (0.0001) (Table 6). When the An, net photosynthesis rate, was set as a dependent variable, the partial R-square was also larger with the leaf temperature (0.9860), followed by calculated leaf respiration (0.011) (Table 7). The dependence of Vcmax on temperature has been described by an Arrhenius function since it increases over a wide range of temperatures and does not deactivate until very high, near-lethal temperatures (> 50°C) (Leuning, 2002). Medlyn et al. (2002a) showed apparent species differences in comparing the responses of Jmax to temperature from different studies. Further study is necessary to determine whether Jmax temperature responses differ by elevated growth CO2 levels. Estimated Jmax, An, and thermal breakdown decreased due to increased leaf temperature (>
30°C). The photosynthetic rates of the fifth leaves from the
Fig. 3. Estimated net photosynthesis rate (An) response to leaf temperature in a semi-closed greenhouse from June 22 to August 7, 2021.
apical region were saturated at a light intensity of 1200 µmol·m-2·s-1 and reached the saturation point at a CO2
concentration of 1000 µmol from June to August. Jung et al.
(2015) developed two-variable leaf photosynthetic models of Irwin mango to determine adequate light intensity levels and CO2 concentrations for mango grown in greenhouses. In that study, results showed that photosynthetic rates of top leaves were saturated at a light intensity of 400µmol·m-2·s-1, while those of middle and bottom leaves saturated at 200µmol·m-2·s-1, indicating photosynthetic rates can be estimated differently for validation of the model. Scarascia- Mugnozza et al. (1996) suggest that the long-term acclimation to high CO2 could result a down-regulation of photosynthesis by reducing rubisco activity, stomatal aperture and density.
The present study suggests that optimal conditions of CO2
concentration could be determined for improving photosynthetic rates of fruit vegetables grown in greenhouses by using the photosynthetic model equation.
Acknowledgement
This study was conducted with the support of the Korea Smart Farm R&D Foundation (Project no. 421040-04) of Korea Institute of Planning and Evaluation for Technology in Food, Agriculture and Forestry.
Literature Cited
Bernacchi C.J., E.L. Singsaas, C. Pimentel, A.R. Portis, Jr and S.P. Long 2001, Improved temperature response functions
for models of Rubisco-limited photosynthesis. Plant Cell Environ 24:253-259. doi:10.1111/j.1365-3040.2001.00668.x Caemmerer S.V. 2000, Biochemical Models of Leaf Photo-
synthesis. CSIRO Publishing, Collingwood, Victoria, Australia.
pp 1-165.
Campbell G.S., and JM. Norman 1998, Plants and plant communities. In GS Campbell and JM Norman, ed, Intro- duction to Environmental Biophysics. Springer, New York, pp 239-241.
Collatz G.J., J.T. Ball, C. Grivet, and J.A. Berry 1991, Physiological and environmental regulation of stomatal conductance, photosynthesis and transpiration-a model that includes a laminar boundary-layer. Agric For Meteorol 54:107-136. doi:10.1016/0168-1923(91)90002-8
Farquhar G.D., S. von Caemmerer, and J.A. Berry 1980, A biochemical model of photosynthetic CO2 assimilation in leaves of C3 species. Planta 149:78-90. doi:10.1007/BF00386231 Harley P.C., R.B. Thomas, J.F. Reynolds, and B.R. Strain
1992, Modelling photosynthesis of cotton grown in elevated CO2. Plant Cell Environ 15:271-282. doi:10.1111/j.1365- 3040.1992.tb00974.x
Hikosaka K., K. Ishikawa, A. Borjigidai, O. Muller, and Y.
Onoda 2006, Temperature acclimation of photosynthesis:
mechanisms involved in the changes in temperature depen- dence of photosynthetic rate. J Exp Bot 57:291-302. doi:10.
1093/jxb/erj049
Jung D.H., J.H. Shin, Y.Y. Cho, and J.E. Son 2015, Deve- lopment of a two-variable spatial leaf photosynthetic model of irwin mango grown in greenhouse. Protected Hort Plant Fac 24:161-166. (in Korean) doi:10.12791/KSBEC.2015.
24.3.161
Kattge J., and W. Knorr W 2007, Temperature acclimation in a biochemical model of photosynthesis: a reanalysis of data from 36 species. Plant Cell Environ 30:1176-1190. doi:10.
1111/j.1365-3040.2007.01690.x
Kim D.E., J.K. Kwon, S.J. Hong, J.W. Lee, and Y.H. Woo
반밀폐형 온실 내에서 탄산가스 시비에 따른 광강도와 엽온에 반응한 토마토 잎의 최대 카복실화율, 전자전달율 및 광합성율 실측값과 모델링 방정식에
의한 예측값의 비교
최은영1ㆍ정영애2ㆍ안승현3ㆍ장동철4ㆍ김대현5ㆍ이동수6ㆍ권진경7ㆍ우영회8*
1한국방송통신대학교 농학과 교수, 2한국방송통신대학교 대학원 농생명과학과 대학원생, 3한국방송통신대학교 농학과 학부생,
4강원대학교 원예학과 박사후연구원, 5강원대학교 에너지공학과 교수, 6농촌진흥청 농업과학원 박사후연구원,
7농촌진흥청 농업과학원 연구사, 8한국농수산대학 원예환경시스템학과 교수
적 요. 본 연구는 반밀폐형 토마토 재배 온실에서 광합성율 극대화를 위한 적정 탄산가스 시비 농도를 구명하고자 광합성 모델을 이용하여 잎의 최대 카복실화율(Vcmax), 최대 전자전달속도(Jmax), 열파괴, 잎 호흡 등을 계산하고 실 제 측정값과 비교하였다. 다양한 광도(PAR 200µmol·m-2·s-1 to 1500µmol·m-2·s-1)와 온도(20°C to 35°C) 조건에서
CO2 농도에 대한 A-Ci curve는 광합성 측정 기기를 사용하여 측정하였고, 모델링 방정식으로 아레니우스 함수값
(Arrhenius function), 순광합성율(net CO2 assimilation, An), 열파괴(thermal breakdown), Rd(주간의 잎호흡)를 계산 하였다. 엽온이 30°C 이상으로 상승하였을 때 Jmax, An 및 thermal breakdown 예측치가 모두 감소하였고, 예측 Jmax의 가장 최고점은 엽온 30°C였으며 그 이상의 온도에서는 감소하였다. 생장점 아래 5번째 잎의 광합성율은 PAR 200-
400µmol·m-2·s-1 수준에서는 CO2 600ppm, PAR 600-800µmol·m-2·s-1 수준에서는 CO2 800ppm, PAR 1000µmol·m-2·s-1 수 준에서는 CO2 1000ppm, PAR 1200-1500µmol·m-2·s-1 수준에서는 CO2 1500ppm을 공급했을 때 포화점에 도달하 였다. 앞으로 광합성 모델식을 활용하여 과채류 온실 재배 시 광합성을 높일 수 있는 탄산시비 농도를 추정할 수 있 을 것으로 판단된다.
추가 주제어: 아레니우스 방정식, 순광합성, 루비스코, 포화점, 열파괴 2020, The effect of greenhouse climate change by temporary
shading at summer on photo respiration, leaf temperature and growth of cucumber. Protected Hort Plant Fac 29:306-312.
(in Korean) doi:10.12791/KSBEC.2020.29.3.306
Leuning R. 2002, Temperature dependence of two parameters in a photosynthesis model. Plant Cell Environ 25:1205-1210.
doi:10.1046/j.1365-3040.2002.00898.x
Medlyn B.E., D. Loustau, and S. Delzon 2002a, Temperature response of parameters of a biochemically based model of photosynthesis. I. Seasonal changes in mature maritime pine (Pinus pinaster Ait.). Plant Cell Environ 25:1155-1165.
doi:10.1046/j.1365-3040.2002.00890.x
Medlyn B.E., E. Dreyer, D. Ellsworth, M. Forstreuter, P.C.
Harley, M.U.F. Kirschbaum, X. Le Roux, P. Montpied, J.
Strassemeyer, A. Walcroft, K. Wang, and D. Loustau 2002b, Temperature response of parameters of a biochemically based model of photosynthesis. II. A review of experimental data. Plant Cell Environ 25:1167-1179. doi:10.1046/j.1365- 3040.2002.00891.x
Nederhoff E.M. 1987, Dynamic optimization of the CO2
concentration in greenhouses: an experiment with cucumber (Cucumis sativus L.). Acta Hortic 229:341-348. doi:10.
17660/ActaHortic.1988.229.37
Peet M.M., and D.H. Willits 1987, Greenhouse CO2 enrichment
alternatives—effects of increasing concentration or duration of enrichment on cucumber yields. J Amer Soc Hort Sci 112:236-241.
Sage R.F., and D.S. Kubien 2007, The temperature response of C3 and C4 photosynthesis. Plant Cell Environ 30:1086-1106.
doi:10.1111/j.1365-3040.2007.01682.x
Sanchez-Guerrero M.C., P. Lorenzo, E. Medrano, N. Castilla, T. Soriano, and A. Baille 2005, Effect of variable CO2
enrichment on greenhouse production in mild winter climates.
Agric For Meteorol 132:244-252. doi:10.1016/j.agrformet.
2005.07.014
Scarascia-Mugnozza G., P.D. Angelis, G. Matteucci, R. Valentini 1996, Long-term exposure to elevated [CO2] in a natural Quercus ilex L. community: Net photosynthesis and pho- tochemical efficiency of PSII at different levels of water stress. Plant Cell Environ 19:643-654. doi:10.1111/j.1365- 3040.1996.tb00399.x
Sharkey T.D. 1985, Photosynthesis in intact leaves of C3 plants:
physics, physiology and rate limitations. Bot Rev 51:53-105.
doi:10.1007/BF02861058
Sharkey T.D., C.J. Bernacchi, G.D. Farquhar, and E.L. Singsaas 2007, Fitting photosynthetic carbon dioxide response curves for C3 leaves. Plant Cell Environ 30:1035-1040. doi:10.111 1/j.1365-3040.2007.01710.x
![Table 3. Comparison of Rubisco maximum carboxylation rate (V cmax ), maximum electron transport rate (J max ), leaf respiration under daylight (R d ) from gas exchange measurements and calculations and calculated Arrhenius function [f(T l )], and thermal](https://thumb-ap.123doks.com/thumbv2/123dokinfo/5179272.595889/4.892.76.817.876.1031/comparison-carboxylation-transport-respiration-measurements-calculations-calculated-arrhenius.webp)
![Table 4. Comparison of Rubisco maximum carboxylation rate (V cmax ), maximum electron transport rate (J max ), leaf respiration under daylight (R d ) from gas exchange measurements and calculations and calculated Arrhenius function [f(T l )],](https://thumb-ap.123doks.com/thumbv2/123dokinfo/5179272.595889/5.892.458.820.259.1004/comparison-carboxylation-transport-respiration-measurements-calculations-calculated-arrhenius.webp)
![Table 5. Comparison of Rubisco maximum carboxylation rate (V cmax ), maximum electron transport rate (J max ), leaf respiration under daylight (R d ) from gas exchange measurements and calculations and calculated Arrhenius function [f(T l )],](https://thumb-ap.123doks.com/thumbv2/123dokinfo/5179272.595889/7.892.74.439.400.1012/comparison-carboxylation-transport-respiration-measurements-calculations-calculated-arrhenius.webp)

