- 태안화력발전소 사례분석 -
전상기*·이성철**
한국전력공사 울산화력발전처*, 한양대학교 화학공학과**
The Study on the Improvement of Environmental Assessment Method through Analysis of Environmental Investigation Results of
Taean Thermal Power Plant
Chun, Sang-Ki*··Lee, Sung-Chul**
Ulsan Thermal Power Plant, Korea Electric Power Corporation*
Department of Chemical Engineering, Hanyang University**
Abstract
This study compares the results of environmental impact assessment with the results of post- environmental investigation, using the case of Taean thermal power plant construction.
The atmospheric and water qualities were not greatly changed before and after the construction of the power plant. However, the site of the highest concentration predicted by the atmospheric quality modeling in environmental impact assessment was different from that after operation of 4 power plants. There was also a difference in the diffusion range of thermal discharge water between the measured result(1km) and the predicted value(1.5km) with the model.
Thus, environmental impact evaluation should be based on long-term (more than a year) environmental monitoring data. For the modeling of atmospheric quality and numerical thermal discharge water diffusion, appropriate models for each plant should be selected and the numerical modeling should be accompanied by computer simulation, wind tunnel test, etc.
Moreover, environmental evaluation should focus more on the degree of impact on surroundings than the prediction of changes in surroundings caused by operation of plants.
Keyword: Environmental impact assessment, Post-environmental investigation
I. 서 론 1. 연구의 개요
우리 나라에 1981년 환경영향평가제도가 도 입·시행된 이후 환경영향평가는 본래의 의미의 개발사업에 대한 사전평가라는 측면보다는 사업 시행에 대한 면죄부라는 비난 속에 많은 시행착 오와 발전을 거듭하여 어느 정도 정착되기에 이 르렀다.
발전소 건설사업에 대한 환경영향평가도 92년 9월 강릉수력발전소건설사업을 시작으로 환경영 향평가를 시행하여 약 40여개 수화력 및 원자력 발전소 건설사업에 대한 환경영향평가를 시행하 였고 또한, 사후환경영향조사도 시행하였다.
사후환경영향조사는 환경영향평가법 제26조에 따라 시행하는 것으로서 건설착공 이후부터 준공 후 5년까지 환경영향평가시 조사한 동일 지점에 서 대기질, 수질 등 각종 환경항목에 대하여 주기 적으로 측정하여 사업시행으로 인하여 발생될 수 잇는 환경피해를 방지하기 위하여 시행하는 조사 분석 및 평가행위를 말한다.
따라서 사후환경조사는 각 사업단위별로 매년 또는 격년마다 시행하여 관계기관에 제출하고 있 지만 환경영향평가시와 가동후의 환경영향조사결 과를 종합적으로 연구 분석한 논문은 찾아보기 힘들고 대기질이나 온배수 환경영향평가에 대한 검증 차원에서의 결과 비교연구는 시행되고 있다.
대기질 환경영향평가서에 대한 검증은 전 (1997)이 보령화력주변 9개 지점의 TMS 측정자 료와 대기확산 Modeling 결과를 비교 연구1)한 바 있으며 대전대 산기연(1997)이 울산 제2복합화력 의 환경영향평가시 평가내용을 전반적으로 재평 가한 사례2)가 있으나 김 등(1999)이 밝힌 바3)와 같이 상세한 지형특성을 고려, 기상자료 적용 등 의 문제로 평가방법에 많은 개선이 필요한 것으 로 보고되고 있다.
또한, 온배수 환경영향평가에 대한 검증조사는 日本福島縣溫排水調査委員會(1996)가 福島原電團 地 주변에서 수질, 수온 등 해양환경영향조사를 20년간 실시하였는데 환경영향평가시의 온배수 확산으로 인한 수온상승은 파악되었으나 수질 및 저질 등 환경에의 영향여부는 전부 해명할 수 없 었다고 보고4)하고 있다.
본 연구에서는 지금까지 에너지 개발사업에서 시행한 환경영향평가 중 태안화력건설사업에 대 한 사례를 중심으로 발전소 건설전의 환경영향평 가 내용과 가동후의 사후환경영향조사내용을 상 호 비교·분석함으로써 환경영향평가 결과가 가 동후 실제상황과 어느 정도 부합하는지를 비교 검토하고 그 대안을 제시하고자 하였다.
II. 연구방법
본 연구에서는 발전소 건설전과 가동후의 환경 변화를 비교 연구하였는데 발전소 건설전의 환경 조사결과는 1986. 12∼1987. 12에 걸쳐 실시한 서 산(태안)화력발전소 건설사업 환경영향평가서5)를 참고하였으며, 그 당시의 환경현황조사결과와 발 전소 가동시를 전제로 하여 환경영향예측·평가 를 실시한 결과를 기준으로 하여 가동후의 사후 환경조사시 도출된 조사결과와 상호 비교 검토함 으로써 환경영향평가시에 예측하였던 평가 결과 의 정확도 및 신뢰성을 검증하고자 하였다.
III. 결과 및 고찰 1. 대상사업 개요
본 연구의 대상사업은 에너지 개발사업 중 발 전소 건설사업으로 환경영향평가를 실시하고 현 재 가동 중에 있는 충남 태안군의 태안화력발전 소로 하였다.
태안화력발전소는 우리 나라 서해안의 태안반 도 북단에 위치해 있으며 충남 태안군 태안읍으 로부터 북서쪽으로 20km 떨어진 원북면 방갈리 831번지 일대의 낮은 구릉성 야산이 반도형으로 돌출된 지반상태가 양호한 곳에 입지해 있다.
태안화력발전소는 군내 유일한 대기 1종배출업 소로서 주변에 타오염원이 없어 그 영향여부가 쉽게 관찰될 수 있는 특성을 갖고 있으며 태안해 상국립공원과 바로 인접하여 있는 아주 청정한 지역에 위치하고 있으며, 95년 6월과 12월 1, 2호 기가, 97년 3월과 8월 3, 4호기가 준공되어 현재 200만 kW의 설비용량으로 가동 중에 있다.
2. 대기환경의 변화와 영향예측결과의 고찰
대기환경의 변화는 발전소 가동전의 대기환경 조사자료(1985. 6.∼1987. 12)와 발전소 가동후인
1996. 5∼1998. 3의 사후조사결과를 비교하여 그 추이를 살펴보았다.
다행히 조사지점은 발전소 가동전·후 모두 동 일지점에서 측정하였고, 측정기관도 동일기관인 한전 전력연구원에서 수행하였으므로 수치의 비 교가 용이하였다.
1) 대기질 측정지점
대기질은 최초 환경영향평가시의 측정지점으로 서 발전소를 중심으로 반경 30km이내의 8개 지 점이며 지점위치는 Table 1 및 Figure 2와 같다.
Fig. 1. The location map of Tae-an Thermal power plant Fig. 2. The survey sites of atmospheric quality Table 1. The survey sites of atmospheric quality No. Sites Distance from plant
1 Hagampo WSW 2.3km
2 Kwandong E 5.7km
3 Wonmug SSE 9.0km
4 Mohang SSW 16.9km
5 Daesan ENE 18.2km
6 Former Taean S/S SSE 18.3km
7 Buchun SE 23.3km
8 Nammyon SSE 26.3km
No. Sites Distance from plant
No. Sites 1 Hagampo 2 Kwandong 3 Wonmug 4 Mohang 5 Daesan 6 Former taean S/S 7 Buchun 8 Nammyon
- Notes-
➜
2) 대기질의 변화 추이
대기질은 황산화물(SO2), 질소산화물(NO2), 먼 지(TSP), 옥시턴트(O3) , 일산화탄소(CO)에 대해 측정하였는데, 여기서는 발전소 가동과 관련하여 배출규제가 되고 있는 SOx, NOx, TSP에 대하여 만 환경영향평가시부터 현재까지의 변화추이를 살펴보고자 한다.
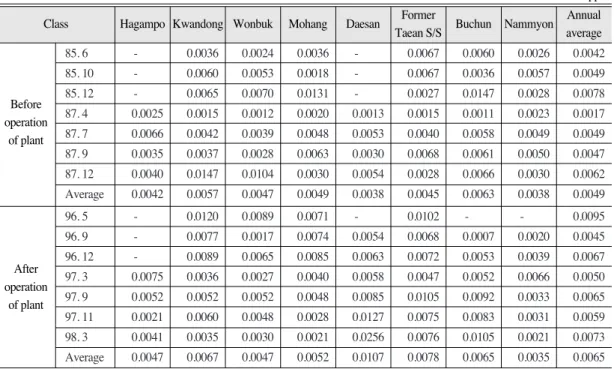
(1) 황산화물
발전소 가동전의 SO2 농도측정결과에 대한 분 석결과를 보면 총 7회 측정하였는데 1.1∼14.7ppb 의 분포를 보이며 위치별, 연도별, 계절별로 큰 차이를 보이고 있다.
측정치가 가장 높은 것은 85년 12월 부춘초교 의 14.7ppb와 87년 12월 관동초교의 14.7ppb로서 모두 겨울철인데 이는 난방용 연료의 사용증가에 따른 일시적인 현상이라고 환경영향평가서에 기 술되어 있다.
발전소 가동후인 96년 이후는 총 7회를 측정하 였는데 0.7∼25.6ppb로서 발전소 가동전보다 최저 치는 오히려 낮아지고 최고치는 증가하는 경향을 보였으며 최고농도 출현지점도 대산초교의 25.6ppb로 변화하였다. 그러나 발전소 인근지역인 원북면의 학암포, 원북초교와 이원면의 관동초교 는 크게 증가하지 않고 약간 증가하는 경향을 보 였다.
이상의 결과를 종합해 볼 때 발전소 가동으로 인한 SO2의 증가는 극히 미미한 것으로 판단되 며, 오히려 대산 석유화학공단의 가동(1989∼
1991)에 따른 영향으로 대산초교 등에서 농도가 크게 증가한 것으로 판단된다.
(2) 질소산화물
가동전 측정치는 87년 11월 4개 지점에서 측정 한 자료밖에 없어 일정한 기준으로 판단하는 데 어려움이 있으나 대체적으로 환경기준을 밑도는
Table 2. The annual measuring results of SO2concentration
Class HagampoKwandongWonbuk Mohang Daesan Former Buchun Nammyon Annual
Taean S/S average
85. 6 - 0.0036 0.0024 0.0036 - 0.0067 0.0060 0.0026 0.0042
85. 10 - 0.0060 0.0053 0.0018 - 0.0067 0.0036 0.0057 0.0049 85. 12 - 0.0065 0.0070 0.0131 - 0.0027 0.0147 0.0028 0.0078 87. 4 0.0025 0.0015 0.0012 0.0020 0.0013 0.0015 0.0011 0.0023 0.0017 87. 7 0.0066 0.0042 0.0039 0.0048 0.0053 0.0040 0.0058 0.0049 0.0049 87. 9 0.0035 0.0037 0.0028 0.0063 0.0030 0.0068 0.0061 0.0050 0.0047 87. 12 0.0040 0.0147 0.0104 0.0030 0.0054 0.0028 0.0066 0.0030 0.0062 Average 0.0042 0.0057 0.0047 0.0049 0.0038 0.0045 0.0063 0.0038 0.0049
96. 5 - 0.0120 0.0089 0.0071 - 0.0102 - - 0.0095
96. 9 - 0.0077 0.0017 0.0074 0.0054 0.0068 0.0007 0.0020 0.0045 96. 12 - 0.0089 0.0065 0.0085 0.0063 0.0072 0.0053 0.0039 0.0067 97. 3 0.0075 0.0036 0.0027 0.0040 0.0058 0.0047 0.0052 0.0066 0.0050 97. 9 0.0052 0.0052 0.0052 0.0048 0.0085 0.0105 0.0092 0.0033 0.0065 97. 11 0.0021 0.0060 0.0048 0.0028 0.0127 0.0075 0.0083 0.0031 0.0059 98. 3 0.0041 0.0035 0.0030 0.0021 0.0256 0.0076 0.0105 0.0021 0.0073 Average 0.0047 0.0067 0.0047 0.0052 0.0107 0.0078 0.0065 0.0035 0.0065
※ Environmental standard of SO2: 0.25ppm/hr, 0.3ppm/day, below 0.003ppm/year
Class Hagampo Kwandong Wonbuk Mohang Daesan Former
Buchun Nammyon Annual
Taean S/S average
unit : ppm
Before operation
of plant
After operation
of plant
양호한 수준이다. 황산화물과 마찬가지로 구태안 변전소와 대산 초교 등에서 높은 수치를 보여 발 전소 이외의 타오염원의 영향이 있는 것으로 보 인다.
또한 발전소 인접지역인 학암포와 관동초교의 발전소 가동후 평균농도가 가동 전에 비해 증가 된 경향을 나타내고 있는데 발전소 가동의 영향 을 다소 받고 있는 것으로 추측된다. 계절별로는 겨울철보다 봄철과 여름철에 증가된 경향을 보이 며 이는 봄철 대기의 안정과 여름철 피서차량의 증가에 원인이 있는 것으로 보인다.
(3) 총먼지(TSP) 및 PM10
총먼지는 전 지점에 걸쳐 발전소 가동 전에 비
해 가동후 그 양이 2배 이상 늘어났는데 이는 발 전소 가동도 영향이 있기는 하지만 서산, 태안지 역의 간척사업과 공단조성 등에 따라 나대지가 증가한 것이 그 원인으로 판단된다.
지점별로 살펴보면 구태안변전소, 부춘초교, 모 항초교 등이 다른 곳에 비하여 농도가 높게 나타 난 것으로 볼 때 발전소에 인접한 농업지역보다 인구가 밀집하며 자동차와 산업체가 많은 주거지 역인 때문인 것으로 보인다.
PM10의 경우 가동전의 측정 자료가 없어 가동 후의 추이만을 살펴보면 원북초교와 구태안변전 소 등이 높게 나타났다. 특히 구태안변전소의 경 우 총먼지의 양과 함께 이에 포함된 PM10의 농 도도 가장 높은 것으로 나타났다.
Table 3. The annual measuring results of NO2concentration
Class HagampoKwandongWonbuk Mohang Daesan Former Buchun Nammyon Annual
Taean S/S average
Before 87. 11 0.0030 0.0050 0.0080 - - 0.0140 - - 0.0075
96. 5 - 0.0113 0.0315 0.0030 - 0.0079 - - 0.0134
96. 9 - 0.0108 0.0079 0.0102 0.0110 0.0090 0.0061 0.0089 0.0091
96. 12 - 0.0097 0.0085 0.0115 0.0013 0.0082 0.0083 0.0131 0.0086
97. 3 0.0266 0.0161 0.0065 0.0200 0.0175 0.0225 0.0150 0.0097 0.0167 97. 9 0.0043 0.0047 0.0051 0.0058 0.0011 0.0142 0.0133 0.0050 0.0067 97. 11 0.0024 0.0054 0.0056 0.0038 0.0153 0.0064 0.0122 0.0042 0.0069 98. 3 0.0026 0.0013 0.0015 0.0014 0.0103 0.0050 0.0058 0.0011 0.0036 Average 0.0076 0.0075 0.0086 0.0071 0.0091 0.0100 0.0090 0.0070 0.0086
※ Environmental standard of NO2: 0.15ppm/hr, below 9ppm/8 hours
Class Hagampo Kwandong Wonbuk Mohang Daesan Former
Buchun Nammyon Annual
Taean S/S average
unit : ppm
After operation
of plant
Fig. 3. The trend of annual SO2concentration variation concentration(ppm)
period 0.0300
0.0250 0.0200 0.0150 0.0100 0.0050 0.0000
85.6 85.10 85.12 87.4 87.7 87.9 87.12 96.5 96.9 96.12 97.3 97.9 97.11 98.3
Hagampo Kwandong Wonbuk Mohang Daesan Former Taean S/S Buchun Nammyon
Fig. 4. The trend of annual NO2concentration variation concentration(ppm)
period 0.035
0.03 0.025 0.02 0.015 0.01 0.005 0
87.11 96.1 96.5 96.9 96.12 97.3 97.9 97.11 98.3
Hagampo Kwandong Wonbuk Mohang Daesan Former Taean S/S Buchun Nammyon
Fig. 5. The trend of annual TSP concentration variation concentration(mmg/m3)
period 350
300 250 200 150 100 50 0
85.6 85.10 85.12 87.4 87.7 87.9 87.12 96.1 96.5 96.9 96.12 97.3 97.9 97.11 98.3
Hagampo Kwandong Wonbuk Mohang Daesan Former Taean S/S Buchun Nammyon Table 4. The annual measuring results of TSP
Class HagampoKwandongWonbuk Mohang Daesan Former Buchun Nammyon Annual
Taean S/S average
85. 6 - 23.000 24.000 56.000 - 27.000 39.000 26.000 32.500 85. 10 - 25.000 35.000 28.000 - 22.000 18.000 24.000 25.333 85. 12 - 22.000 29.000 49.000 - 33.000 52.000 26.000 35.167 87. 4 28.000 32.000 20.000 32.000 20.000 34.000 24.000 38.000 28.500 87. 7 27.000 17.000 20.000 37.000 40.000 50.000 60.000 36.000 35.875 87. 9 2.000 43.000 20.000 23.000 26.000 35.000 38.000 25.000 26.500 87. 12 3.000 10.000 12.000 2.000 8.000 6.000 24.000 48.000 14.125 Average 15.000 24.571 22.857 32.429 23.500 29.571 36.429 31.857 28.286
96. 5 - 116.900 120.200 105.200 - 133.800 - - 119.025
96. 9 - 95.500 86.500 98.300 116.400 156.900 235.800 114.600 129.143 96. 12 - 88.700 69.500 97.100 108.600 133.800 143.500 97.500 105.529 97. 3 180.400 134.440 296.520 299.880 184.340 331.310 219.550 310.690 244.641 97. 9 60.200 69.500 72.200 77.000 102.400 84.200 89.800 59.500 76.850 97. 11 54.200 74.400 67.000 86.000 93.400 74.200 85.900 68.400 75.438 98. 3 50.200 50.200 46.000 47.600 74.500 70.400 65.800 45.500 56.275 Average 78.600 89.705 100.490 108.923 102.091 135.426 125.907 105.084 107.995
※ Environmental standard of TSP : 300mg/m3/day, below 150mg/m3/year
Class Hagampo Kwandong Wonbuk Mohang Daesan Former
Buchun Nammyon Annual
Taean S/S average
unit : mg/m3
Before operation
of plant
After operation
of plant
그리고 TSP와 PM10의 봄철 농도 증가의 원인 도 편서풍에 의해 해빙된 토양의 비산이나 황사 등도 그 한 원인으로 판단된다
3) 발전소로 인한 대기환경영향 예측결과의 검증
태안화력발전소의 환경영향평가서6)에 따르면 (Table 6 참조) 태안군의 대기환경농도는 건설전 에 비해 발전소 2기 가동시 연평균 최고농도가 황산화물은 1.16배, 질소산화물은 1.70배, 분진은 1.02배 정도 증가할 것으로 예측하고 있다.
그러나 발전소 1,2호기가 가동한 96년도 이후의 대기환경농도 실측결과를 살펴보면 발전소 인근 인 학암포, 관동초교, 원북초교 등은 SO2농도가 1.12∼1.17배로서 예측결과와 어느정도 일치하지 만 대산초교, 구태안변전소 등은 1.75∼2.81배로서
예측치보다 높게 나타나고 있다.
NO2의 농도는 가동전 1회 측정으로는 경향분 석이 어려우나 평가시 1.70배 증가할 것으로 예측 되었는데 실측농도는 전지역 평균하여 1.15배 증 가하는데 그쳤다.
또한 총먼지(TSP)는 환경영향평가시 1.02배 증 가할 것으로 예측되었지만 실측결과는 3배 이상 증가한 것으로 나타났다.
이는 환경영향평가 당시의 대기오염모델링이 잘못되었다기보다는 주변 각종오염원의 증가(대 산석유화학공단 가동 등) 및 연료사용형태의 변 화, 즉 청정연료의 사용, 교통량의 증가 등에 기 인한 결과라고 유추해석할 수 있을 것이다.
따라서 환경영향평가시 대기환경영향 예측시에 는 가동후 환경이 어떻게 변할 것인가를 예측하 Table 5. The annual measuring results of PM10
Class HagampoKwandongWonbuk Mohang Daesan Former Buchun Nammyon Annual
Taean S/S average
96. 9 - 38.200 63.400 63.500 24.100 49.500 40.800 61.200 48.671
96. 12 47.300 22.100 40.100 35.200 34.900 46.400 49.000 39.286
97. 3 86.400 61.000 145.770 104.420 113.140 86.190 83.480 92.930 96.666 97. 9 35.000 40.400 40.000 33.200 57.200 40.800 52.800 27.400 40.850 97. 11 34.200 42.600 33.800 31.500 49.400 38.200 42.500 32.400 38.075 98. 3 30.600 27.400 30.200 20.600 52.400 47.700 48.200 27.400 35.563 Average 40.240 40.129 52.039 46.503 49.063 53.941 46.883 43.976 46.730
※ Environmental standard of PM10 : 150mg/m3/day, below 80150mg/m3/year
Class Hagampo Kwandong Wonbuk Mohang Daesan Former
Buchun Nammyon Annual
Taean S/S average
unit :mg/m3
After operation
of plant
Fig. 6. The trend of annual PM10concentration variation concentration(mmg/m3)
period 200
150 100 50 0
96.9 96.12 97.3 97.9 97.11 98.3
Hagampo Kwandong Wonbuk Mohang Daesan Former Taean S/S Buchun Nammyon
는 것은 한계성이 있으며, 오히려 설비가동이 어 느 정도 그 지역에 영향을 증가시킬 것인가에 초 점을 맞추는 것이 바람직할 것으로 판단된다.
3. 해양환경의 변화와 영향예측결과의 고찰
1) 해양수질 조사지점
해양수질은 가동전후 모두 환경영향평가시 지 정된 인근해역의 8개 정점에서 조사되었다.
2) 발전소 가동전후 해양수질변화추이 (1) 수온 및 일반수질
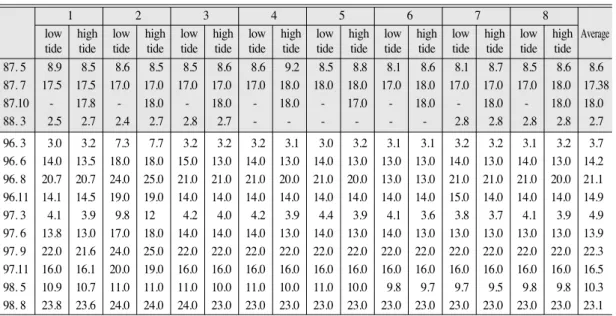
수온의 경우 계절별로 봄철에서 겨울철에 이르 기까지 가장 근사한 시기를 선택하여 각각 87년 5월과 98년 5월, 87년 7월과 98년 8월, 87년 10월 과 97년 11월, 87년 3월과 98년 3월을 비교하였는 데 발전소 가동전에는 8개 지점 모두 1℃ 이내의 차이를 보이지만 발전소 가동후에는 배수구 지점 (2번)이 약 1∼7℃ 높게 나타나고 있다.
또한, 발전소 가동전과 4기 가동후의 계절별 변 화를 살펴보면 가을철을 제외하고는 가동후 주변
해역의 평균수온이 다소 상승한 경향을 보였 다.(Fig.8)
특히 2번 지점은 발전소 배수구인데 봄철 및 가을철에는 환경영향평가시 보다 발전소 가동후 가 1∼2.5℃, 여름철과 겨울철에는 7∼7.4℃ 높게 나타나는 것으로 분석되었다. (Table 8)
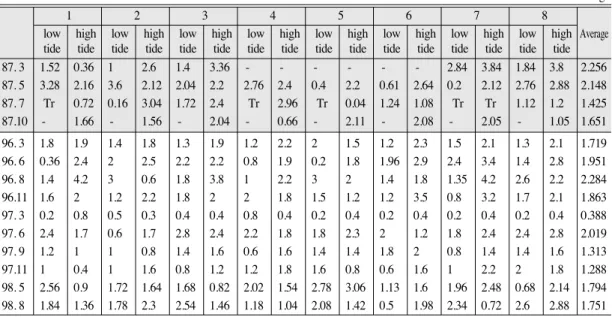
DO의 경우 환경영향평가시에는 7.25∼
10.83mg/l, 가동후에는 6.39∼10.77mg/l로 큰변화 를 감지할 수 없었고 수온이 낮은 겨울철에 높게 나타나는 경향을 보였다.
COD는 환경영향평가 시에 비하여 변화폭이 크 Table 6. The prediction data of air pollutants effect in scaling up power plant
Class Seo-san thermal power plant Outbreak sites
Pollutants Before oper. 2 units oper. 8 units oper.
SO2(ppb) 1.53 1.78 2.53 Injimyon yadangri
Dustfall (mg/sm3) 1.41 1.44 1.53 ( 26km site out of
NO2(ppb) 1.06 1.22 1.70 power plant)
Class Seo-san thermal power plant
Outbreak sites
Pollutants Before oper. 2 units oper. 8 units oper.
Fig. 7. The survey sites of sea-water quality 125˚10’E
37˚25’
2km
YELLOW SEA
PUNCH ˘OM
MAOE
MIN ˘ODO
① ②
③
④
⑤
⑥
⑦
⑧
126˚15’E
Fig. 8. The seasonal comparison of water temperature before and after Operation of Power plant
˚C 25
20 15 10 5 0 Before oper.
After oper.
spring 8.58 10.32
summer 17.23 23.13
autumn 17.91 16.45
winter 2.7 4.88
➜
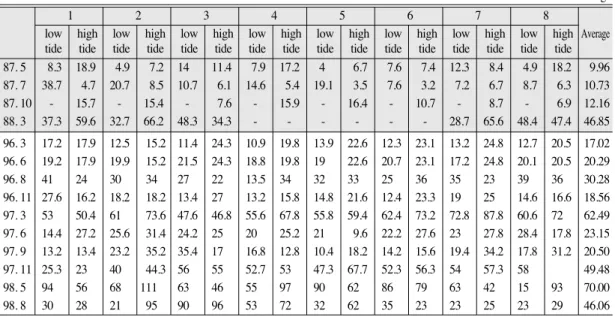
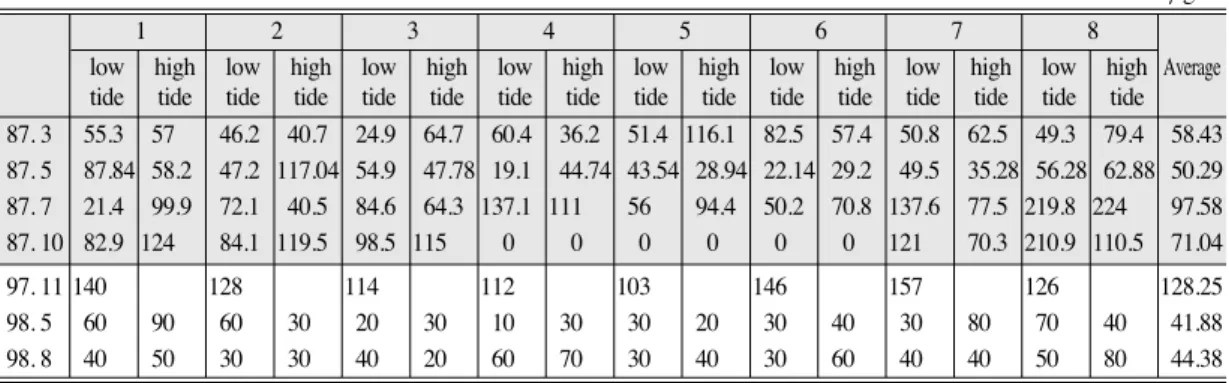
지 않았으나, SS의 경우 평가시 I등급에 달하던 수질이 II∼III등급으로 변화한 현상이 뚜렷하게 나타났다. 이는 주변 간척사업 시행, 선박 출입 등으로 인한 부유물질의 증가로 판단되며, 특히 가동후 측정치 중 두드러지게 농도가 높게 나타 난 경우도 있었는데(예: 98년 5월, 밀물시 2번 지 점 111mg/l) 이는 폭우에 의한 퇴적물의 재부유
에 의한 영향으로 추측된다.
pH는 평가시와 가동후 모두 수질환경기준 I등 급 이내의 범위인 7.8∼8.3이내의 분포를 보였다.
(2) 영양염류
총질소의 경우 환경영향평가 시와 가동후 큰 차이를 보이지 않고 기온이 높은 여름철에 다소 Table 8. The annual measuring results of water temperature
1 2 3 4 5 6 7 8 Average
low high low high low high low high low high low high low high low high tide tide tide tide tide tide tide tide tide tide tide tide tide tide tide tide
87. 5 8.9 8.5 8.6 8.5 8.5 8.6 8.6 9.2 8.5 8.8 8.1 8.6 8.1 8.7 8.5 8.6 8.6 87. 7 17.5 17.5 17.0 17.0 17.0 17.0 17.0 18.0 18.0 18.0 17.0 18.0 17.0 17.0 17.0 18.0 17.38
87.10 - 17.8 - 18.0 - 18.0 - 18.0 - 17.0 - 18.0 - 18.0 - 18.0 18.0
88. 3 2.5 2.7 2.4 2.7 2.8 2.7 - - - - - - 2.8 2.8 2.8 2.8 2.7
96. 3 3.0 3.2 7.3 7.7 3.2 3.2 3.2 3.1 3.0 3.2 3.1 3.1 3.2 3.2 3.1 3.2 3.7 96. 6 14.0 13.5 18.0 18.0 15.0 13.0 14.0 13.0 14.0 13.0 13.0 13.0 14.0 13.0 14.0 13.0 14.2 96. 8 20.7 20.7 24.0 25.0 21.0 21.0 21.0 20.0 21.0 20.0 13.0 13.0 21.0 21.0 21.0 20.0 21.1 96.11 14.1 14.5 19.0 19.0 14.0 14.0 14.0 14.0 14.0 14.0 14.0 14.0 15.0 14.0 14.0 14.0 14.9
97. 3 4.1 3.9 9.8 12 4.2 4.0 4.2 3.9 4.4 3.9 4.1 3.6 3.8 3.7 4.1 3.9 4.9
97. 6 13.8 13.0 17.0 18.0 14.0 14.0 14.0 13.0 14.0 13.0 14.0 13.0 13.0 13.0 13.0 13.0 13.9 97. 9 22.0 21.6 24.0 25.0 22.0 22.0 22.0 22.0 22.0 22.0 22.0 22.0 22.0 22.0 22.0 22.0 22.3 97.11 16.0 16.1 20.0 19.0 16.0 16.0 16.0 16.0 16.0 16.0 16.0 16.0 16.0 16.0 16.0 16.0 16.5 98. 5 10.9 10.7 11.0 11.0 11.0 10.0 11.0 10.0 11.0 10.0 9.8 9.7 9.7 9.5 9.8 9.8 10.3 98. 8 23.8 23.6 24.0 24.0 24.0 23.0 23.0 23.0 23.0 23.0 23.0 23.0 23.0 23.0 23.0 23.0 23.1
1 2 3 4 5 6 7 8
low high low high low high low high low high low high low high low high Average tide tide tide tide tide tide tide tide tide tide tide tide tide tide tide tide 87. 5 8.9 8.5 8.6 8.5 8.5 8.6 8.6 9.2 8.5 8.8 8.1 8.6 8.1 8.7 8.5 8.6 8.6 87. 7 17.5 17.5 17.0 17.0 17.0 17.0 17.0 18.0 18.0 18.0 17.0 18.0 17.0 17.0 17.0 18.0 17.38
87.10 - 17.8 - 18.0 - 18.0 - 18.0 - 17.0 - 18.0 - 18.0 - 18.0 18.0
88. 3 2.5 2.7 2.4 2.7 2.8 2.7 - - - - - - 2.8 2.8 2.8 2.8 2.7
unit : ˚C
Table 9. The annual measuring results of DO
1 2 3 4 5 6 7 8 Average
low high low high low high low high low high low high low high low high tide tide tide tide tide tide tide tide tide tide tide tide tide tide tide tide
87. 3 10.52 10.65 10.28 10.48 9.59 10.64 - - - - - - 10.76 10.48 10.76 10.84 10.5 87. 5 10.56 10.8 10.56 11.08 10.84 10.88 10.84 10.88 10.88 11 10.88 10.92 10.76 10.48 10.88 11.04 10.83 87. 7 7.25 7.7 7.33 7.82 7.66 7.86 7.62 9.98 7.33 7.82 7.29 7.86 8 7.58 7.86 7.66 7.79
87.10 - 7.74 - 7.29 - 7.25 - 7.74 - 6.65 - 7.66 - 7.05 - 6.57 7.25
96. 3 9.6 9.8 9.2 9.3 9.4 9.7 9.1 8.9 9.2 9.4 9.3 9.6 9.5 9.7 9.2 9.5 9.4 96. 6 7 8.45 7.5 8.33 6.5 8.29 6 8.02 6.5 7.98 7 8.31 7.5 8.12 6.5 8.15 7.51 96. 8 7.33 7.09 7.09 7.45 7.25 7.09 7.57 7.13 7.05 7.17 7.13 7.29 7.17 1.8 7.09 1.8 6.59 96.11 8.05 8.46 7.85 8.26 7.65 8.26 8.13 7.85 8.05 8.05 8.46 8.46 8.56 8.05 7.65 8.05 8.12 97. 3 10.87 11.07 9.87 10.67 11.07 11.07 10.87 9.79 10. 10.27 10.87 11.15 10.87 10.87 11.28 10.87 10.77 97. 6 8.93 9.17 8.73 9.05 9.01 8.93 9.05 8.27 8.89 9.09 8.93 9.13 9.05 9.13 8.89 9.37 8.98
97. 9 6.4 6.4 6.4 6.2 6.4 6.4 6.2 6.8 6.6 6 6.4 6 6.2 6.8 6.8 6.39
97.11 7.3 8 7.7 7.3 7.9 7.7 7.3 7.9 7.7 7. 7.5 7.5 7.9 7.3 7.3 7.5 7.61
1 2 3 4 5 6 7 8
low high low high low high low high low high low high low high low high Average tide tide tide tide tide tide tide tide tide tide tide tide tide tide tide tide 87. 3 10.52 10.65 10.28 10.48 9.59 10.64 - - - - - - 10.76 10.48 10.76 10.84 10.5 87. 5 10.56 10.8 10.56 11.08 10.84 10.88 10.84 10.88 10.88 11 10.88 10.92 10.76 10.48 10.88 11.04 10.83 87. 7 7.25 7.7 7.33 7.82 7.66 7.86 7.62 9.98 7.33 7.82 7.29 7.86 8 7.58 7.86 7.66 7.79
87.10 - 7.74 - 7.29 - 7.25 - 7.74 - 6.65 - 7.66 - 7.05 - 6.57 7.25
unit : mg/l
Table 10. The annual measuring results of COD
1 2 3 4 5 6 7 8 Average
low high low high low high low high low high low high low high low high tide tide tide tide tide tide tide tide tide tide tide tide tide tide tide tide
87. 3 1.52 0.36 1 2.6 1.4 3.36 - - - - - - 2.84 3.84 1.84 3.8 2.256
87. 5 3.28 2.16 3.6 2.12 2.04 2.2 2.76 2.4 0.4 2.2 0.61 2.64 0.2 2.12 2.76 2.88 2.148 87. 7 Tr 0.72 0.16 3.04 1.72 2.4 Tr 2.96 Tr 0.04 1.24 1.08 Tr Tr 1.12 1.2 1.425
87.10 - 1.66 - 1.56 - 2.04 - 0.66 - 2.11 - 2.08 - 2.05 - 1.05 1.651
96. 3 1.8 1.9 1.4 1.8 1.3 1.9 1.2 2.2 2 1.5 1.2 2.3 1.5 2.1 1.3 2.1 1.719
96. 6 0.36 2.4 2 2.5 2.2 2.2 0.8 1.9 0.2 1.8 1.96 2.9 2.4 3.4 1.4 2.8 1.951
96. 8 1.4 4.2 3 0.6 1.8 3.8 1 2.2 3 2 1.4 1.8 1.35 4.2 2.6 2.2 2.284
96.11 1.6 2 1.2 2.2 1.8 2 2 1.8 1.5 1.2 1.2 3.5 0.8 3.2 1.7 2.1 1.863
97. 3 0.2 0.8 0.5 0.3 0.4 0.4 0.8 0.4 0.2 0.4 0.2 0.4 0.2 0.4 0.2 0.4 0.388
97. 6 2.4 1.7 0.6 1.7 2.8 2.4 2.2 1.8 1.8 2.3 2 1.2 1.8 2.4 2.4 2.8 2.019
97. 9 1.2 1 1 0.8 1.4 1.6 0.6 1.6 1.4 1.4 1.8 2 0.8 1.4 1.4 1.6 1.313
97.11 1 0.4 1 1.6 0.8 1.2 1.2 1.8 1.6 0.8 0.6 1.6 1 2.2 2 1.8 1.288
98. 5 2.56 0.9 1.72 1.64 1.68 0.82 2.02 1.54 2.78 3.06 1.13 1.6 1.96 2.48 0.68 2.14 1.794 98. 8 1.84 1.36 1.78 2.3 2.54 1.46 1.18 1.04 2.08 1.42 0.5 1.98 2.34 0.72 2.6 2.88 1.751
※ Environmental standard for water quality : 1st class below 1mg/l, 2nd 2mg/l, 3rd 4mg/l
1 2 3 4 5 6 7 8
low high low high low high low high low high low high low high low high Average tide tide tide tide tide tide tide tide tide tide tide tide tide tide tide tide
87. 3 1.52 0.36 1 2.6 1.4 3.36 - - - - - - 2.84 3.84 1.84 3.8 2.256
87. 5 3.28 2.16 3.6 2.12 2.04 2.2 2.76 2.4 0.4 2.2 0.61 2.64 0.2 2.12 2.76 2.88 2.148 87. 7 Tr 0.72 0.16 3.04 1.72 2.4 Tr 2.96 Tr 0.04 1.24 1.08 Tr Tr 1.12 1.2 1.425
87.10 - 1.66 - 1.56 - 2.04 - 0.66 - 2.11 - 2.08 - 2.05 - 1.05 1.651
unit : mg/l
Fig. 10. The trend of SS variation before and after Operation of Power plant ppm
period 80
70 60 50 40 30 20 10
0 87.5 87.7 87.10 88.3 96.3 96.6 96.8 96.11 97.3 97.6 97.9 97.11 98.5 98.8
Average 1st class 2nd class Fig. 9. The trend of COD change before and after Operation of Power plant
mg/l
period 4.5
4 3.5 3 2.5 2 1.5 1 0.5
0 87.5 87.7 87.10 88.3 96.3 96.6 96.8 96.11 97.3 97.6 97.9 97.11 98.5 98.8
Average 1st class 2nd class 3rd water class
높은 농도를 보이며 대체로 II등급의 수질환경기 준을 만족하고 있으며 총인의 경우 발전소 가동 전후 수질기준 I∼III등급의 불규칙한 분포를 보여
영양염류 농도는 발전소 가동과는 별다른 관계를 보이지 않고 있는 것으로 보인다.
Table 11. The annual measuring results of SS
1 2 3 4 5 6 7 8 Average
low high low high low high low high low high low high low high low high tide tide tide tide tide tide tide tide tide tide tide tide tide tide tide tide
87. 5 8.3 18.9 4.9 7.2 14 11.4 7.9 17.2 4 6.7 7.6 7.4 12.3 8.4 4.9 18.2 9.96 87. 7 38.7 4.7 20.7 8.5 10.7 6.1 14.6 5.4 19.1 3.5 7.6 3.2 7.2 6.7 8.7 6.3 10.73
87. 10 - 15.7 - 15.4 - 7.6 - 15.9 - 16.4 - 10.7 - 8.7 - 6.9 12.16
88. 3 37.3 59.6 32.7 66.2 48.3 34.3 - - - - - - 28.7 65.6 48.4 47.4 46.85
96. 3 17.2 17.9 12.5 15.2 11.4 24.3 10.9 19.8 13.9 22.6 12.3 23.1 13.2 24.8 12.7 20.5 17.02 96. 6 19.2 17.9 19.9 15.2 21.5 24.3 18.8 19.8 19 22.6 20.7 23.1 17.2 24.8 20.1 20.5 20.29
96. 8 41 24 30 34 27 22 13.5 34 32 33 25 36 35 23 39 36 30.28
96. 11 27.6 16.2 18.2 18.2 13.4 27 13.2 15.8 14.8 21.6 12.4 23.3 19 25 14.6 16.6 18.56 97. 3 53 50.4 61 73.6 47.6 46.8 55.6 67.8 55.8 59.4 62.4 73.2 72.8 87.8 60.6 72 62.49 97. 6 14.4 27.2 25.6 31.4 24.2 25 20 25.2 21 9.6 22.2 27.6 23 27.8 28.4 17.8 23.15 97. 9 13.2 13.4 23.2 35.2 35.4 17 16.8 12.8 10.4 18.2 14.2 15.6 19.4 34.2 17.8 31.2 20.50
97. 11 25.3 23 40 44.3 56 55 52.7 53 47.3 67.7 52.3 56.3 54 57.3 58 49.48
98. 5 94 56 68 111 63 46 55 97 90 62 86 79 63 42 15 93 70.00
98. 8 30 28 21 95 90 96 53 72 32 62 35 23 23 25 23 29 46.06
※ Environmental standard for water quality : 1st class below 10mg/l, 2nd 25mg/l, 3rd above 25mg/l
1 2 3 4 5 6 7 8
low high low high low high low high low high low high low high low high Average tide tide tide tide tide tide tide tide tide tide tide tide tide tide tide tide 87. 5 8.3 18.9 4.9 7.2 14 11.4 7.9 17.2 4 6.7 7.6 7.4 12.3 8.4 4.9 18.2 9.96 87. 7 38.7 4.7 20.7 8.5 10.7 6.1 14.6 5.4 19.1 3.5 7.6 3.2 7.2 6.7 8.7 6.3 10.73
87. 10 - 15.7 - 15.4 - 7.6 - 15.9 - 16.4 - 10.7 - 8.7 - 6.9 12.16
88. 3 37.3 59.6 32.7 66.2 48.3 34.3 - - - - - - 28.7 65.6 48.4 47.4 46.85
unit : mg/l
Table 12. The annual measuring results of pH
1 2 3 4 5 6 7 8 Average
low high low high low high low high low high low high low high low high tide tide tide tide tide tide tide tide tide tide tide tide tide tide tide tide
87. 3 8.2 8.2 8.3 8.2 8.3 8.1 8.3 8.3 8.2 8.2 8.23
87. 5 7.94 8.25 8.19 8.1 8.3 8.24 8.24 8.23 8.22 8.7 8.15 8.29 8.16 8.36 8.2 8.06 8.23 87. 7 7.97 8.04 8 7.99 7.96 8.01 7.94 8.01 8.01 8.1 8.04 7.96 8.02 8.01 8.03 8.04 8.01
87.10 - 8.23 - 8.15 - 8.13 - 8.15 - 8.05 - 8.22 - 8.17 - 8.09 8.15
96. 3 8.25 8.26 8.19 8.14 8.27 8.29 8.18 8.04 8.32 8.24 8.22 8.21 8.25 8.17 8.22 8.24 8.22 96. 6 7.82 8.19 7.8 8.22 7.8 8.22 7.84 8.25 7.84 8.21 7.8 8.19 7.79 8.17 7.81 8.24 8.01 96. 8 8.16 8.09 8.1 8.15 8.14 8.13 8.14 8.16 8.18 8.11 8.04 8.16 8.16 8.13 8.1 8.14 8.13 96.11 8.15 8.18 8.13 8.21 8.18 8.2 8.22 8.22 8.21 8.2 8.18 8.17 8.16 8.22 8.06 8.23 8.18 97. 3 8.05 8.12 8.1 8.13 8.11 8.13 8.1 8.12 8.11 8.13 8.13 8.13 8.12 8.12 8.11 8.13 8.12 97. 6 8.02 8.07 8.05 8.04 8.03 8.06 8.02 8.07 8.04 8.07 8.02 8.05 8.05 8.05 8.04 8.06 8.05 97. 9 8.02 8.12 8.09 8.13 8.09 8.12 8.11 8.12 8.09 8.09 8.08 8.14 8.11 8.12 8.09 8.1 8.10 97.11 8.11 8.15 8.14 8.18 8.16 8.18 8.17 8.16 8.16 8.15 8.16 8.18 8.17 8.19 8.16 8.18 8.16 98. 5 7.93 8.01 8.11 8.05 8.02 8.04 7.91 7.93 8.11 8.06 8.05 8.07 7.95 7.99 8.05 8.07 8.02 98. 8 8.22 8.22 8.22 8.23 8.23 8.23 8.22 8.2 8.23 8.21 8.2 8.21 8.22 8.23 8.23 8.21 8.22
※ Environmental standard for water quality : 1st class 7.8∼8.3, 2nd,3rd 6.5∼8.5
1 2 3 4 5 6 7 8
low high low high low high low high low high low high low high low high Average tide tide tide tide tide tide tide tide tide tide tide tide tide tide tide tide
87. 3 8.2 8.2 8.3 8.2 8.3 8.1 8.3 8.3 8.2 8.2 8.23
87. 5 7.94 8.25 8.19 8.1 8.3 8.24 8.24 8.23 8.22 8.7 8.15 8.29 8.16 8.36 8.2 8.06 8.23 87. 7 7.97 8.04 8 7.99 7.96 8.01 7.94 8.01 8.01 8.1 8.04 7.96 8.02 8.01 8.03 8.04 8.01
87.10 - 8.23 - 8.15 - 8.13 - 8.15 - 8.05 - 8.22 - 8.17 - 8.09 8.15