DOI : http://dx.doi.org/10.5394/KINPR.2015.40.2.51
†Corresponding Author : [email protected] 051)410-4462
Prediction of Planning Time in Busan Ports-Connected Expressways
†Tae-Gon Kim
* Department of Civil Engineering, Korea Maritime and Ocean University, Busan 49112, Korea
Abstract : Expressways mean the primary arterial highways with a high level of efficiency and safety. However, Gyeongbu and Namhae expressways connected with Busan ports are showing travel time delay by increased traffic including the medium/large-sized vehicles of about 20% compared to those of about 13% regardless of the peak periods. This study, thus, intends to analyze lane traffic characteristics in the basic 8-lane segments of the above-mentioned expressways, compute the planning and buffer times based on travel time reliability, find the lane speed showing a higher correlation with planning time between the lane speeds in the basic 8-lane segments, and finally suggest a correlation model for predicting the planning time in expressways.
Key words : Expressways, Traffic characteristics, Space mean speed, Travel time reliability, Correlation analysis, Correlation model
1. Introduction
1.1 Background
Expressways mean the high-speed arterial highways with a high level of efficiency and safety. However, most of expressways don't play their roles by the high rate of the medium/large-sized vehicles of about 13% and increased traffic. In addition it is not easy to continue to build new expressways because of limited budget and time. So, it is absolutely needed to improve the mobility and efficiency of existing expressways instead of constructing new ones.
1.2 Objectives
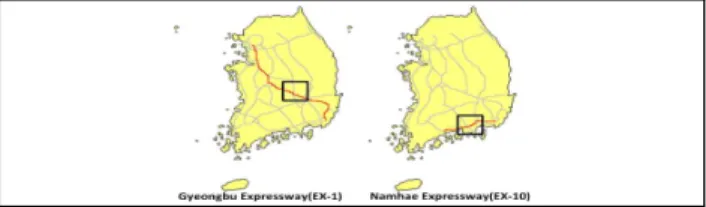
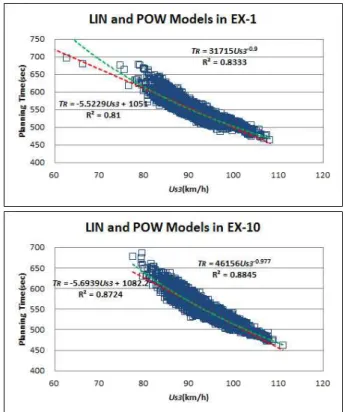
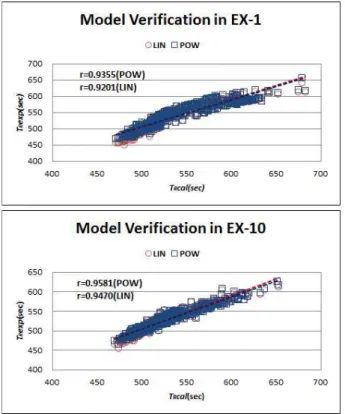
Study expressways as shown in Fig. 1 are showing travel delay by the higher rate of the medium/large-sized vehicles of about 20%. In the studies of travel time and speed, detector speed was reported to show the higher reliability in travel time estimation/prediction of expressways at a speed of over 70km/h(Oh et al., 2003), and average speed was reported to have the higher correlation with the speed on lane 2 than on lanes 3 and 4 in urban freeway(Kim and Jeong, 2012). So, this study is to investigate the lane traffic characteristics in the 8-lane expressways, identify the lane speed characteristics highly correlated with travel time reliability, and suggest the better correlation models for predicting planning time in the 8-lane expressways.
1.3 Data Collection
Study segments were selected from the basic 8-lane ones, as described in Table 1. So, data collection was repeatedly conducted from Jun. 16, 2014 to Jul. 6, 2014, and a master dataset for analysis was generated every 15 minutes in the basic 8-lane segments(i.e., lane 1 for passing vehicles, lane 2 for small-sized ones, lane 3 for medium-sized ones and lane 4 for large-sized ones for each direction).
Fig. 1 Expressways under the study
Item Gyeongbu(EX-1) Namhae(EX-10) Total Segment Total Segment Length(km) 416.0 4×15 273.1 4×15 No. of lanes 4 to 10 8 4 to 8 8 Rate of Medium/
Large Vehicles(%) 18.7 21.3
Table 1 Geometry of expressways under the study
2. Analysis of traffic characteristics
2.1 Flow
Flow was expressed by an hourly flow, as follows(TRB, 1975);
(1)Where,
: Flow(veh/h)
: No. of vehicles observed at station(veh)
: Observed time(1hour)
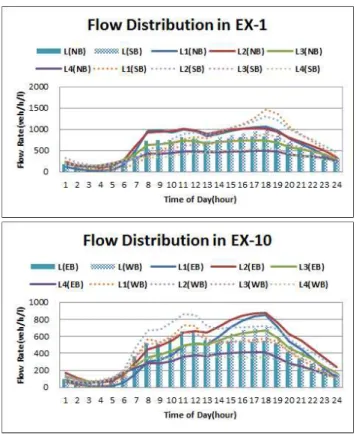
Fig. 2 Flow distribution in expressways under the study
Expressways Mean SD Mean SD Mean SD Mean SD L1 L2 L3 L4 L EX-1 NB 630 390 680 350 510 230 370 130 550
SB 650 430 710 380 530 240 400 150 570 EX-10 EB 380 280 480 280 370 200 260 130 370 WB 370 240 500 270 380 200 250 120 380 Note: L1 is lane 1, L2 is lane 2, L3 is lane 3, L4 is lane 4,
L is lane mean, NB is northbound, SB is southbound, EB is eastbound, WB is westbound, SD is standard deviation
Table 2 Flow statistics in expressways(veh/h/l)
There seemed to be a distinct difference in flow rate between the directions as well as the lanes for each expressway as shown in Fig. 2. Also, average flow rate appeared to increase by about 9% to 27% in lanes 1 and 2 showing a higher deviation, but to decrease by about 4%
to 31% in lanes 3 and 4 showing a lower deviation as summarized in Table 2.
2.2 Speed
Speed was converted into the space mean speed, as follows(May, 1990);
(2)
Where,
: Space mean speed in segment(km/h)
: No. of stations in segment
: No. of vehicles observed at station (veh)
: Spot mean speed at station (km/h)
Fig. 3 Speed distribution in expressways under the study
Expressways Mean SD Mean SD Mean SD Mean SD L1 L2 L3 L4 L EX-1 NB 119 4 104 3 92 3 81 3 100
SB 119 5 104 2 91 2 80 2 99
EX-10 EB 117 3 104 2 95 3 84 3 100
WB 114 2 104 1 94 3 83 2 99
Table 3 Speed statistics in expressways(km/h)
There did not seem to be a significant difference in speed
between the directions but there was a distinct difference
between the lane speeds for each expressway as shown in
Fig. 3. Also, average speed appeared to decrease by about
6% to 17% in lanes 3 and 4 showing about 2.5km/h
deviation, but to increase by about 5% to 18% in lanes 1
and 2 showing a higher deviation as summarized in Table
3.
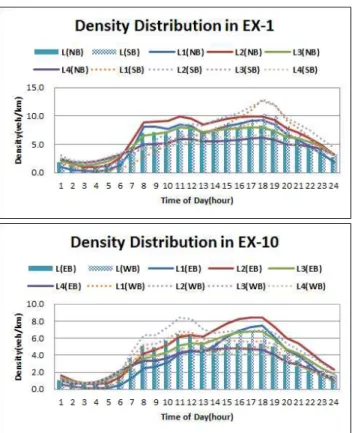
2.3 Density
Density was estimated by the reciprocal of the distance headway, as follows(May, 1990);
×
(3)
Where, : Distance headway of each vehicle (m)