Effects of high taurocholate load on activities of hepatic alcohol metabolizing enzymes
You Hee Kim
1and Mi Jeoung Shin
Department of Biochemistry, Keimyung University
School of Medicine, 194 Dongsan-Dong, Joong-Gu, Taegu, 700- 712, Korea
1Corresponding author: Tel, +82-53-250-7462;
Fax, + 82-53-252-1605; E-mail, [email protected] Accepted 24 April 2002
Abstract
Membrane-associated cytotoxicity induced by hydro- phobic bile salts is a major contributing factor leading to liver diseases. Administration of ursodeoxycholate reduces serum liver enzymes in chronic liver dis- eases but the nature of this effect is still unclear.
Using alcohol metabolising enzymes as cellular markers, the hepatotoxic properties of hydrophobic bile salts and the putative hepatoprotective effect of ursodeoxycholate was examined. Two animal mod- els of biliary retention, bile duct obstruction and choledochocaval fistula was used to investigate the effect of taurocholate on the hepatic alcohol metab- olizing enzymes: cytosolic alcohol dehydrogenase, microsomal ethanol oxidizing system, catalase and aldehyde dehydrogenase before and after the infu- sion of taurocholic acid or tauroursodeoxycholic acid for two days period. Bile duct obstruction was found to be similar to or slightly exceeds choledoch- ocaval fistula in the degree of retention. Following the taurocholic acid infusion, the serum alcohol dehydrogenase activity as well as microsomal etha- nol oxidizing system and aldehyde dehydrogenase were greatly increased but the level of cytosolic alcohol dehydrogenase and catalase activities was found to be lower in either or both models in com- parison with the control animals. However, the taur- oursodeoxycholic acid infusion did not induce any significant changes in the levels of all the alcohol metabolizing enzyme activities in either or both models. These findings suggest that hydrophobic taurocholic acid (7α
ααα) affects the plasmalemma toallow leakage of cytosolic alcohol dehydrogenase into the blood circulation, stimulates the biosynthe- sis of microsomal ethanol oxidizing system and aldehyde dehydrogenase, and suppresses the bio- synthesis of alcohol dehydrogenase and catalase.
But in contrast, the hydrophilic tauroursodeoxy- cholic acid (7ββββ) provided hepatoprotective effect.
Keywords: Alcohol metabolizing enzymes, Bile acid cytotoxicity, Choledochocaval fistula rat
Introduction
Some 80% to 90% of ingested alcohol is oxidized in the liver (Vidal et al., 1990) where ethanol is metabolized in a two stage oxidative process first to acetaldehyde and to acetate (Horton and Mills, 1979). The enzymes that catalyze these two oxidations are alcohol dehydrogenase (ADH), located in the cytoplasm, catalase in the peroxisomes, the microsomal ethanol oxidizing system (MEOS) in the endoplasmic reticulum (Lieber, 1985), and aldehyde dehydrogenase (ALDH) which is located in the soluble and insoluble fractions of hepatocytes (Crow et al., 1974; Harada, 2001). Although ADH catalyzes the rate-limiting step in the ethanol metabolism (Plapp et al., 1984; Vidal et al., 1990), its physiological role is uncertain (Pietruszko, 1975). However, the serum activity of this enzyme is a specific reflexion of hepatocellular necrosis (Mezey et al., 1968; Skursk et al., 1979) because the highest ADH activities have been found in the liver (Skursk et al., 1979), and the reduction of ADH activity is proportional to the severity of liver disease (Pan et al., 1989; Vidal et al., 1989); that being so, the appearance of this enzyme in serum can indicate liver disease with comparatively good selectivity (Skursk et al., 1979).
Bile acids are cytotoxic when present in abnormally high
concentrations (Hofmann, 1999). Bile acids cytotoxicity is
thought to be dependent on their detergent property
(Hardison et al., 1981; Kitani et al., 1986; Morgan et al.,
1998) or lipid-solubilizing properties (Ogawa et al., 1990). At
concentration near the critical micellar concentration, or at
high perfusion rate, bile salts are capable of solubilizing cell
membrane components (Morgan et al., 1998) leading to
cell lysis (Drew and Priestly, 1963). On the other hand, bile
acids stimulate biliary membrane-bound enzymes, alkaline
phosphatase (Ogawa et al., 1990) and γ-glutamyl
transpeptidase (Kim and Kim, 1997), and competitively
inhibit the cytochrome P 450-dependent microsomal
biotransforming enzymes (Greim et al., 1972), arylesterase
(Han and Kim, 1997) and carboxylesterase (Han and Kim,
1998). The most common model used to study
abnormalities associated with cholestasis is the animal with
complete biliary obstruction, most often the rat. Using this
model of cholestasis, the increase in the activities of MEOS
and aldehyde dehydrogenase, and the decrease in the
activities of alcohol dehydrogenase and catalase were observed (Kwak et al., 1988). However, due to the impairment of transhepatocellular transport and increased biliary pressure (Hardison et al., 1983), this model may not be appropriate to clarify whether the activity change of the enzymes is caused by retention of biliary constituents. Creation of a shunt between the common bile duct and the superior vena cava, a choledochocaval fistula (CCF), causes biliary retention without obstruction (Toyota et al., 1984). Many laboratories have studied the bile acid cytotoxicity by determining the cytotoxic parameters such as alkaline phosphatase, lactate dehydrogenase, 5'-nucleotidase and aminotransferases (Hardison et al., 1983; Kitani et al., 1986; Ogawa et al., 1990); however, the possible changes of alcohol dehydrogenase, as the cytotoxic parameter, induced by different bile constituents load have not been investigated. In the present study, we have examined the leakage of cytosolic ADH into the blood stream using two animal models of retention of biliary constituents to investigate in vivo cytotoxicity of bile acids. Activities of MEOS, catalase and ALDH during 2 days experiment were measured in rat livers after BDO and in the liver from a CCF rat. Activities of these alcohol metabolzing enzymes were determined following the infusion of either taurine amidate of cholic acid (3, 7, 12-trihydroxy-5-cholanoic acid) (TCA) or ursodeoxycholic acid (3, 7-dihydroxy-5-cholanoic acid) (TUDC) at high perfusion rate (450 µmol/kg) for 15 min (Ogawa et al., 1990).
Materials and Methods
Chemicals
β-nicotinamide adenine dinucleotide (β-NAD+
),
β-nicotinamide adenine dinucleotide reduced form disodium salt (β-NADH, from yeast), N, N’, dimethyl-4- nitrosoanilline,
β-nicotinamide adenine dinucleotidephosphate sodium salt (NADP
+, from yeast), glycine, pyrazole, propionaldehyde, deoxycholic acid sodium salt, nicotinamide, glucose 6-phosphate, semicarbazide hydrochloride, 2-butanol, taurocholic acid sodium salt (from ox bile), tauroursodeoxycholic acid sodium salt, alcohol dehydrogenase from horse liver, aldehyde dehydrogenase from baker's yeast, catalase from bovine liver and reference protein (10 g/100 ml bovine serum albumin) were purchased from Sigma Chemical Co. (St. Louis, MO, USA). Absolute ethanol was purchased from Merck (Damstadt, Germany). Unless specified otherwise, additional reagents used were of analytical grade.
Animals
Normal male rats of Sprague-Dawley strain, weighing 280-320 g, were used for the experiments. All animals
were maintained on a pellet diet obtained commercially (Sam Yang Foods Co., Wonju, Korea) and tap water. All the experimental groups, with five rats in each group, were divided into 15 groups as follows: One normal group (group 1); Sham-operated control groups (group 2A and 2B): the rats were sacrificed on the 1st and 2nd day after sham operation, midline laparatomy; BDO groups (group 3A and 3B): the rats were sacrificed on the 1st and 2nd day after common bile duct ligation;
BDO groups received TCA infusion (group 4A and 4B):
the rats were infused with TCA (450
µmol//kg)intravenously through the external jugular vein shortly after BDO, and were sacrificed on the 1st and 2nd day post-ligation; the BDO group received TUDCA infusion (group 5A and 5B): the rats were infused with TUDCA (450
µmol//kg) intravenously through the externaljugular vein shortly after BDO, and were sacrificed on the 1st and 2nd day post-ligation; the CCF group (group 6A and 6B): the rats were sacrificed on the 1st and 2nd day after CCF implantation according to the method of Hardison et al. (1983); the CCF group received TCA infusion (group 7A and 7B): immediately after the implantation of fistula, the rats were infused with TCA (450
µmol//kg) into cannula, and were sacrificed on the1st and 2nd day post-implantation; the CCF group received TUDCA infusion (group 8A and 8B): shortly after CCF implantation, the rats were infused with TUDCA (450
µmol/kg) into cannula, and were sacrificedon the 1st and 2nd day post-implantation. All animals had fasted 12 h prior to sacrifice or surgery in which rats were anesthesized lightly with ether. Bile duct obstruction was performed as previously described (Kim and Joo, 2001). A CCF was implanted according to the method of Hardison et al. (1983). Briefly, after a midline incision, the common bile duct was cannulated close to the liver hilus with a PE-50 tube. The cannula was looped outside the abdominal cavity by crossing the incision and tunneled subcutaneously to the neck of the rat. A second catheter consisting of a silastic tube connected to a PE-90 tube was inserted 2.7 cm into the interior jugular vein, and both cannulas were connected behind the animal's neck. Bile salts were infused by using the syringe pump (Sage Instruments, model 341A) according the methods of Ogawa et al. (1990) for 15 min. The livers were excised following perfusion (see below), and blood was collected from the abdominal aorta. The serum was separated by centrifugation and stored at -20
oC until use.
Preparation of subcellular fractions
Subcellular fractionation was performed as described
previously (Ihm and Kim, 1997). Briefly, the livers were
perfused via portal vein with cold 0.25 M sucrose, and
then excised, blotted, weighed, minced and homogenized
in 9 volume of 0.25 M sucrose. Each homogenate was
subjected to cell fractionation. Cytosol, mitochondria and microsomes were isolated by the sucrose linear density gradient centrifugation method (Kwak and Kwak, 1986), and stored at -80
oC. All the isolation procedures were performed at 2 to 4
oC. The hepatic cytosolic preparations were used for ADH and ALDH assays without any treatment. For the studies on the subcellular distribution of ALDH activity, the microsomal and mitochondrial pellet were suspended in 0.25 M sucrose to yield a final protein concentration of 5 mg/ml. The suspensions was diluted with one half of 1% sodium bicarbonate (w/v) solubilizing buffer containing 1% sodium deoxycholate (w/v). The suspension was sonicated at 2 min-intervals for a total 10 min using a Fischer model 300 ultrasonic dismembrator at 20
±0.4 kHz. This microsomal preparation was also used for determination of MEOS activity. Another portion of the liver was homogenized in 9 volume of 5 mM potassium phosphate buffer, pH 6.8 and sonicated to determine catalase activity.
Enzyme assays Alcohol dehydrogenase
Cytosolic ADH activities were determined with the hepatic cytosolic preparation according to the method of Koivula et al. (1975). The assay mixture contained 196 µM NaOH- glycine buffer, pH 9.6, 40
µM ethanol, 2.68µM NAD+and 0.1 ml of sample, in a final volume of 4.0 ml. The mixture was incubated for 3 min at 37
oC. ADH oxidizes ethanol to acetaldehyde and NADH at the expense of NAD
+. The absorbance of NADH was measured at 340 nm using a Varian Cary 210 spectrophotometer. The enzyme activities were expressed as nM of NADH formed per min per mg protein of hepatic cytosolic preparations. Alcohol dehydro- genase activties in sera were measured using n-butanol and N, N’-dimethyl-4-nitrosoaniline as the substrates according to the method of Skurk (1979). 0.25 ml of serum was incubated with the reaction mixture containing 0.25
µMNAD
+, 2.5
µM N, N-dimethyl-4-nitrosoaniline, 10µM NADH,50 mM n-butanol in 0.1 M sodium phosphate buffer, pH 8.5, in a final volume of 1.0 ml for 20 min at 25
oC. The incubations were terminated by the addition of 0.25 ml of 50 mM pyrazole. The absorbance of butylaldehyde was measured at 440 nm using a Varian Cary 210 spectrophotometer. The enzyme activities were expressed as µM of butylaldehyde formed per min per ml of sera.
Microsomal ethanol oxidizing system
The activities were determined according to the modified method of Lieber and Decarli (1968). Each 0.5 ml of sonicated microsomal suspensions (see above) containing a final protein concentration of 2.5 mg/ml and 0.5 ml of the cytosolic preparations was incubated in a medium containing 0.3
µM NADP+, 5
µMMgCl
2, 20 µM nicotinamide, 8
µM glucose 6-phosphate,50
µM ethanol and 80µM of phosphate buffer, pH 7.4.The incubations were carried out in main chambers of
stoppered 50 Erlenmeyer flasks, with a center wall containing 0.6 ml of 15 mM semicarbazide-HCl in 0.16 M potassium phosphate buffer, pH 7.0 for 30 min at 37
oC. The reaction was stopped with 0.5 ml of 70%
trichloroacetic acid. After an overnight diffusion period at room temperature, the concentration of acetaldehyde semicarbazide was determined spectrophotometrically at 224 nm. The enzyme activities were expressed as nM of acetaldehyde formed per min per mg protein of hepatic microsomal preparations.
Catalase
Catalase activity was determined using hydrogen peroxide as the substrate according to the method of Nelson and Kiesow (1972). The reaction mixture consisted of 31.5
µM hydrogen peroxide in 150µMKH
2PO
4buffer, pH 6.8 and 10% (W/V) homogenate (see above) 20
µl, in a final volume of 3.2 ml. Extinctionof hydrogen peroxide was scanned for 1 min at 25
oC.
The decomposition of hydrogen peroxide was measured at 240 nm. The enzyme activity was expressed as µM decomposed hydrogen peroxide (∆H) per min per mg protein of liver homogenate.
Aldehyde dehydrogenase
Aldehyde dehydrogenase activity was measured spectrophotometrically using propionaldehyde and NAD
+as the substrates by following the NADH production at 340 nm according to the method of Koivula and Koivulsalo (1975). The reaction mixture contained 168
µM tetrasodium pyrophosphate, 6.68µMpyrazol, 5.32
µM NAD+, 24
µM propionaldehyde with0.1 ml of hepatic subcellular preparations in final volume of 4.0 ml was incubated for 3 min at 37
oC. The enzyme activities were expressed as in the ADH assay.
Determination of protein
The protein concentration was determined by the Biuret reaction (Gornal at al., 1949), using bovine albumin as the standard.
Statistical analysis
Values are expressed as mean ±SD. Statistical significance was calculated using Student's t-test at P
≤0.05.
Results
Alcohol dehydrogenase
The level of cytosolic ADH activities did not change
significantly in either or both models in comparison with
those levels of activities from normal or sham-operated
control (Table 1). However, the level of the serum ADH
activity was increased markedly soon after the BDO or
CCF construction in comparison with those levels of
activities from either normal or sham-operated control (P
≤0.001) as shown in Table 4. Subsequent to the
TCA infusion, the activities of cytosolic ADH in the rat liver decreased significantly on the 2nd day after the bile duct ligation or CCF construction (P
≤0.001) (Table 2 and 3). The level of ADH activity in the serum was significantly increased from the 1st to the 2nd day post- ligation or post-implantation following the TCA infusion (P
≤0.001) as shown in Tables 5 and 6. After TUDC infusion, the levels of the cytosol ADH activities in the rat liver as well as in serum did not show any significant change by either or both models in comparison with
Table 1. Effects of time and model of biliary retention on liver cytosolicalcohol dehydrogenase (ADH) activities in rats Experimental
groups
ADH activites (nM NADH min-1 mg protein-1) Normal
Sham 1 day Sham 2 days CCF 1 day CCF 2 days BDO 1 day BDO 2 days
77.6±10.8 76.7±11.4 78.3±12.1 75.2±10.3 73.2±11.6 72.7±10.9 68.3±11.3
The data are expressed as mean ±SD with 5 rats in each group; Sham 1 day or Sham 2 days: Sacrificed on the 1st day or 2nd day after sham operation, CCF 1 day or CCF 2 days: Sacrificed on the 1st day or 2nd day after choledochocaval fistula construction, BDO 1 day or BDO 2 days:
Sacrificed on the 1st day or 2nd day after common bile duct ligation.
Table 2. Effects of taurocholic acid (TCA), and tauroursodeoxycholic acid (TUDCA) infusions after bile duct obstruction (BDO) on liver cytosolic alcohol dehydrogenase (ADH) activities in rats
Experimental groups
ADH activites (nM NADH min-1 mg protein-1) BDO 1 day
BDO 1 day + TCA BDO 1 day + TUDCA BDO 2 days BDO 2 days + TCA BDO 2 days + TUDCA
72.7±10.9 35.4±6.8r 74.2±11.4 68.3±11.3 27.5±5.3u 70.6±10.5
The data are expressed as mean ±SD with 5 rats in each group; BDO 1 day + TCA or BDO 1 day + TUDCA, and BDO 2 days + TCA or BDO 2 days + TUDCA: One of the following bile acids were administered intravenously through the superior vena cava: TCA or TUDCA (45 moles/100 g body weight) at the time of common bile duct ligation in rats. Then the rats were sacrificed 1 or 2 days after the ligation.
r; P < 0.001 vs. BDO 1 day, u; P < 0.001 vs. BDO 2 days
Table 3. Effects of taurocholic acid (TCA), and tauroursodeoxycholic acid (TUDCA) infusions after choledochocaval fistula (CCF) on liver cytosolic alcohol dehydrogenase (ADH) activities in rats
Experimental groups
ADH activites (nM NADH min-1 mg protein-1) CCF 1 day
CCF 1 day + TCA CCF 1 day + TUDCA CCF 2 days CCF 2 days + TCA CCF 2 days + TUDCA
75.2±10.3 46.2±6.9l 76.4±11.2 73.2±11.6 36.6±7.4o 77.3±12.3
The data are expressed as mean ±SD with 5 rats in each group; CCF 1 day + TCA or CCF 1 day + TUDCA, and CCF 2 days + TCA or CCF 2 days + TUDCA: One of the following bile acids were administered intravenously through the superior vena cava: TCA or TUDCA (45 moles/100 g body weight) at the time of CCF construction in rats. Then the rats were sacrificed 1 or 2 days after CCF construction.
l; P < 0.001 vs. CCS 1 day, o; P < 0.001 vs. CCS 2 days
Table 4. Effects of time and model of biliary retention on serum alcohol dehydrogenase (ADH) activities in rats
Experimental groups
ADH activites (µM butylaldehyde min-1 ml-1) Normal
Sham 1 day Sham 2 days CCF 1 day CCF 2 days BDO 1 day BDO 2 days
54.9±1.3 55.3±1.4 55.1±1.1 32.6±10.7c,f 37.2±12.2c,i 50.4±15.8c,f 52.6±17.2c,i
The data are expressed as mean ±SD with 5 rats in each group;
Experimental groups are descibed in Table 1 and text.
c; P < 0.001 vs. Nomal, f; P < 0.001 vs. Sham 1 day, i; P < 0.001 vs. Sham 2 days
Table 5. Effects of taurocholic acid (TCA), and tauroursodeoxycholic acid (TUDCA) infusions after bile duct obstruction (BDO) on serum alcohol dehydrogenase (ADH) activities in rats
Experimental groups
ADH activites (µM butylaldehyde min-1 ml-1) BDO 1 day
BDO 1 day+TCA BDO 1 day+TUDCA BDO 2 days BDO 2 days+TCA BDO 2 days+TUDCA
50.4±15.8 80.7±23.6p 51.2±16.5 52.6±17.2 91.6±28.4s 51.8±15.1
The data are expressed as mean ±SD with 5 rats in each group;
Experimental groups are descibed in Table 3 and text.
p; P < 0.05 vs. BDO 1 day, s; P < 0.05 vs. BDO 2 days
Table 6. Effects of taurocholic acid (TCA), and tauroursodeoxycholic acid (TUDCA) infusions after choledochocaval fistula (CCF) on serum alcohol dehydrogenase (ADH) activities in rats
Experimental groups ADH activites (µM butylaldehyde min-1 ml-1) CCF 1 day
CCF 1 day+TCA CCF 1 day+TUDCA CCF 2 days CCF 2 days+TCA CCF 2 days+TUDCA
32.6±10.7 50.3±16.2 30.8±11.6 37.2±12.2 61.4±18.9m 35.7±11.7
The data are expressed as mean ±SD with 5 rats in each group;
Experimental groups are descibed in Table 2 and text.
m; P < 0.05 vs. CCF 2 days
those activities from the BDO or CCF control group (Tables 2, 3, 5 and 6).
MEOS
The levels of MEOS activities did not increase significantly in the rat liver in either or both models in comparison with those levels of activities from the sham-operated control or normal control group except on the 2nd day after BDO, where the enzyme activity level was greatly elevated in the cholestatic rat liver on the 2nd day post-ligation in comparison with those level
of activities from the sham-operated or normal control (P
≤0.05) (Table 7). Subsequent to the TCA injection, the activities of MEOS in the rat liver increased from the 1st to the 2nd day post-ligation or on the 2nd day after CCF construction in comparison with those activities from each BDO or CCF control group (P
≤0.05) (Tables 8 and 9). Subsequent to the TUDC injection, activities of MEOS in the microsomal preparation of rat liver did not show any significant increase in either or both models in comparison with those activities from the BDO or CCF control group (Tables 8 and 9).
Table 7. Effects of time and model of biliary retention on hepatic microsomal ethanol oxidizing system (MEOS) activities in rats
Experimental groups
MEOS activites
(nM acetaldehyde min-1 mg protein-1) Normal
Sham 1 day Sham 2 days CCF 1 day CCF 2 days BDO 1 day BDO 2 days
5.38 ± 0.76 5.41±0.80 5.45±0.78 5.62±0.87 5.84±0.82 5.88±0.85 6.73±0.96a,g
The data are expressed as mean ±SD with 5 rats in each group;
Experimental groups are descibed in Table 1 and text.
a; P < 0.05 vs. Nomal, g; P < 0.05 vs. Sham 2 days
Table 8. Effects of taurocholic acid (TCA), and tauroursodeoxycholic acid (TUDCA) infusions after bile duct obstruction (BDO) on hepatic microsomal ethanol oxidizing system (MEOS) activities in rats
Experimental groups
MEOS activites
(nM acetaldehyde min-1 mg protein-1) BDO 1 day
BDO 1 day+TCA BDO 1 day+TUDCA BDO 2 days BDO 2 days+TCA BDO 2 days+TUDCA
5.88±0.85 7.53±1.32p 5.96±0.83 6.73±0.96 8.62±1.41s 6.87±1.07
The data are expressed as mean ±SD with 5 rats in each group;
Experimental groups are descibed in Table 3 and text.
p; P < 0.05 vs. BDO 1 day, s; P < 0.05 vs. BDO 2 days
Table 9. Effects of taurocholic acid (TCA), and tauroursodeoxycholic acid (TUDCA) infusions after choledochocaval fistula (CCF) on hepatic microsomal ethanol oxidizing system (MEOS) activities in rats
Experimental groups
MEOS activites
(nM acetaldehyde min-1 mg protein-1) CCF 1 day
CCF 1 day+TCA CCF 1 day+TUDCA CCF 2 days CCF 2 days+TCA CCF 2 days+TUDCA
5.62±0.87 6.70±0.92 5.73± 0.84 5.84±0.82 7.71±1.14m 6.04±0.93
The data are expressed as mean ±SD with 5 rats in each group;
Experimental groups are descibed in Table 2 and text.
m; P < 0.05 vs. CCF 2 days
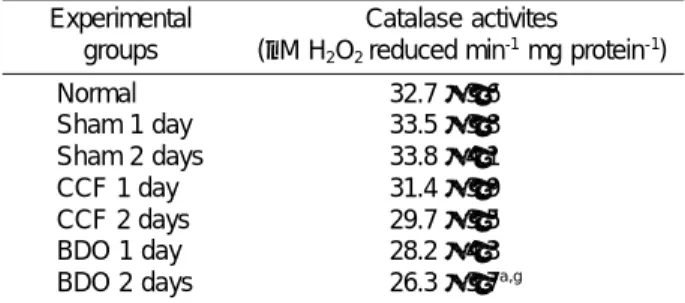
Table 10. Effects of time and model of biliary retention on hepatic catalase activities in rats
Experimental groups
Catalase activites
(µM H2O2 reduced min-1 mg protein-1) Normal
Sham 1 day Sham 2 days CCF 1 day CCF 2 days BDO 1 day BDO 2 days
32.7±3.6 33.5±3.8 33.8±4.1 31.4±3.9 29.7±3.5 28.2±4.3 26.3±3.7a,g
The data are expressed as mean ±SD with 5 rats in each group;
Experimental groups are descibed in Table 1 and text.
a; P<0.05 vs. Nomal, g; P<0.05 vs. Sham 2 days
Table 11. Effects of taurocholic acid (TCA), and tauroursodeoxycholic acid (TUDCA) infusions after bile duct obstruction (BDO) on hepatic catalase activities in rats
Experimental groups
Catalase activites
(µM H2O2 reduced min-1 mg protein-1) BDO 1 day
BDO 1 day+TCA BDO 1 day+TUDCA BDO 2 days BDO 2 days+TCA BDO 2 days+TUDCA
28.2±4.3 21.8±3.1p 30.8±3.9 26.3±3.7 17.0±2.3t 27.5±3.4
The data are expressed as mean ±SD with 5 rats in each group;
Experimental groups are descibed in Table 3 and text.
p; P < 0.05 vs. BDO 1 day, t; P < 0.01 vs. BDO 2 days
Table 12. Effects of taurocholic acid (TCA), and tauroursodeoxycholic acid (TUDCA) infusions after choledochocaval fistula (CCF) on hepatic catalase activities in rats
Experimental groups
Catalase activites
(µM H2O2 reduced min-1 mg protein-1) CCF 1 day
CCF 1 day+TCA CCF 1 day+TUDCA CCF 2 days CCF 2 days+TCA CCF 2 days+TUDCA
31.4±3.9 23.7±2.7k 32.5±4.1 29.7±3.5 22.1±2.9n 30.7±3.8
The data are expressed as mean ±SD with 5 rats in each group;
Experimental groups are descibed in Table 2 and text.
k; P < 0.05 vs. CCF 1 day, n; P < 0.01 vs. CCF 2 days
Catalase
Catalase activities in the rat liver was found to remain in the same level in either or both models in comparison with those activities from the sham-operated or normal control except on the 2nd day after BDO where the enzyme activity decreased significantly in the cholestatic rat liver after the ligation in comparison with the activities from the sham-operated and normal control (P
≤0.05) (Table 10). Subsequent to the TCA infusion, the catalase activities in the rat liver decreased significantly from the 1st (P
≤0.05) to the 2nd day (P
≤0.01) in comparison with those activities from each control group (Tables 10 and 11). Following the TUDC infusion, catalase activities in the rat liver was not increased to any significant level in either or both models in
comparison with those of the BDO or CCF control group (Tables 10 and 11).
Subcellular ALDH activities
The ALDH activities of cytosolic, mitochondrial and microsomal preparations of the rat liver were not increased any significant level in either or both models in comparison with those activities from sham-operated control or normal control (Table 13). Subsequent to the TCA infusion, the cytosolic ALDH activity in the cholestatic rat liver increased significantly on the 2nd day post-ligation in comparison with that activity from the BDO control group (P
≤0.01). The microsomal ALDH activity in the cholestatic rat liver also increased from the 1st (P
≤0.05) to the 2nd day post-ligation
Table 13. Effects of time and model of biliary retention on hepatic subcellular aldehyde dehydrogenase (ALDH) activities in ratsExperimental groups
ALDH activities (nM NADH min-1 mg protein-1)
Cytosol Mitochondria Microsome
Normal Sham 1 day Sham 2 days CCF 1 day CCF 2 days BDO 1 day BDO 2 days
58.7 ± 7.2 59.0 ± 6.4 59.4 ± 7.3 59.7 ± 6.5 62.2 ± 7.0 62.8 ± 6.2 64.7 ± 7.5
95.2 ± 11.8 96.3 ± 12.5 97.1 ± 13.2 96.2 ± 13.5 96.8 ± 13.4 97.8 ± 13.7 98.7 ± 14.3
70.2 ± 10.8 71.5 ± 11.5 71.9 ± 10.6 71.7 ± 10.3 72.2 ± 11.2 73.6 ± 11.4 77.8 ± 11.9 The data are expressed as mean ±SD with 5 rats in each group; Experimental groups are descibed in Table 1 and text.
Table 14. Effects of taurocholic acid (TCA), and tauroursodeoxycholic acid (TUDCA) infusions after bile duct obstruction (BDO) on hepatic subcellular aldehyde dehydrogenase (ALDH) activities in rats
Experimental groups
ALDH activities (nM NADH min-1 mg protein-1)
Cytosol Mitochondria Microsome
BDO 1 day BDO 1 day+TCA BDO 1 day+TUDCA BDO 2 days BDO 2 days+TCA BDO 2 days+TUDCA
62.8±6.2 78.2±6.6q 62.2±6.9 64.7±7.5 81.3±7.3t 63.0±7.1
97.8±13.7 102.7±13.3 95.5±13.1 98.7±14.3 108.4±14.6 96.8±12.7
73.6±11.4 97.5±12.8p 73.9±10.6 77.8±11.9 109.5±14.2t 79.6±10.3 The data are expressed as mean ±SD with 5 rats in each group; Experimental groups are descibed in Table 3 and text.
p; P<0.05 vs. BDO 1 day, q; P<0.01 vs. BDO 1 day, t; P<0.01 vs. BDO 2 days
Table 15. Effects of taurocholic acid (TCA), and tauroursodeoxycholic acid (TUDCA) infusions after choledocho caval fistula (CCF) on hepatic subcellular aldehyde dehydrogenase (ALDH) activities in rats
Experimental groups ALDH activities (nM NADH min-1 protein-1)
Cytosol Mitochondria Microsome
CCF 1 day CCF 1 day+TCA CCF 1 day+TUDCA CCF 2 days CCF 2 days+TCA CCF 2 days+TUDCA
59.7±6.5 72.3±6.7j 60.8±7.3 62.2±7.0 76.8±6.2n 63.8±6.8
96.2±13.7 97.5±13.1 96.6±12.9 96.8±13.4 99.7±13.5 97.2±12.6
71.7±10.3 87.4±10.5j 72.5±11.0 72.2±11.2 95.3±12.6m 73.9±10.8 The data are expressed as mean SD with 5 rats in each group; Experimental groups are descibed in Table 2 and text.
j; P<0.05 vs. CCF 1 day, m; P<0.05 vs. CCF 2 days, n; P<0.01 vs. CCF 2 days
BDO control subsequent to the TCA infusion (Table 13).
The cytosolic ALDH activity in the CCF rat liver increased from the 1st to the 2nd day after the TCA infusion (P
≤0.05 and P
≤0.01). And the microsomal ALDH activity in the CCF rat liver also increased from the 1st to the 2nd day after the TCA infusion (P
≤0.05) (Table 15). The ALDH activity in the liver mitochondria did not show a significant increase in either or both models in comparison with those activities from the BDO or CCF control group subsequent to the TCA infusion (Tables 14 and 15). Subsequent to the TUDC infusion, the level of ALDH activities in the rat liver did not show a significant change in either or both models in comparison with those activities from the BDO or CCF control group (Tables 14 and 15).
Discussion
Bile acids are planar, surface-active amphipathic molecules. When present in sufficient concentration, conjugated bile acid molecules is capable of solubilizing other lipids (Hofmann, 1999). At abnormally high levels, bile acids become cytotoxic for being able to solubilize membrane lipids into aquous phase. Bile acid cytotoxicity is strongly affected by its structure: the greater the hydrophobicity, the greater the cytotoxicity within the confines of dipole integrity. The simple experimental preparations for studying abnormalities associated with cholestasis have been to induce complete biliary obstruction (BDO) and total biliary fistula (CCF) in the animal system, most often in the rat.
The serum ADH, a cytosolic marker enzyme, is a specific reflexion of hepatocellular necrosis (Mezey et al., 1968; Skursk et al., 1979). We have earlier reported the leakage of ADH into the blood stream and activity changes of the other alcohol metabolizing enzymes in cholestasis induced by BDO in rats (Kwak et al., 1988).
The cytotoxicity of bile acid in vivo was further extended by examining the leakage of ADH and other alcohol metabolizing enzymes into the blood stream as a cytotoxic parameter of the liver from CCF rats and BDO during 2 days period under the influence of the hydrophobic TCA (7α-planar) or hydrophilic TUDCA (7β-nonplanar) (Hardison et al., 1981). The activity of ADH in the serum increased significantly soon after BDO or CCF (groups 3 and 6) over the levels of those activities from each control (groups 1 and 2), although the cytosolic ADH activity levels remained about the same in either or both models. However, the level of MEOS activity was increased significantly in group 3B in comparison with those activity from group 2B. Catalase activity level was found to be significantly lower in the group 3B than those levels of activities from groups 1 and 2. The ALDH activities did not show a significant
change in all the hepatic preparations in either or both models (groups 3 and 6).
As expected, the activity level of cytosolic ADH and catalase in the rat liver decreased significantly after TCA injection in either or both models (groups 4 and 7) in comparison with each control. Also the level of serum ADH activity and the activity of MEOS as well as the cytosolic and microsomal ALDH activity in the rat liver were increased significantly in group 4 and 7B after the TCA infusion (groups 3 and 6). However, the enzyme activity in the mitochondrial preparation did not show a significant change in either or both models before and after the TCA infusion. After the TUDC infusion, activities of ADH, MEOS, catalase and ALDH in the rat liver as well as ADH activitiy in the rat serum did not change significantly in either or both models. All the results by BDO model were coincident with our previous study (Kwak et al., 1988).
These present findings indicate that the rise of ADH activity in serum is a reflection of cholestasis-induced hepatocellular damage in these animal models. Also, BDO is found to be similar to or slightly exceeds CCF in the degree of retention at the early stage of cholestasis.
These results suggest that hydrophobic TCA (7α) did induce damage to the plasmalemma lipids to allow leakage of cytosolic ADH into the vascular circulation system. In addition, the hepatic MEOS and ALDH (microsomal and cytosolic) expression was elevated whereas the levels of hepatic ADH and catalase appeared to decrease perhaps due to the spillage to extracellular fluid. And in either or both models when cholestasis is combined with high TCA load, the change in activity of alcohol metabolizing enzymes is significantly amplified. TUDC (7β) induced hepatoprotective effect have likely resulted from its hydrophilic property and ability to neutralize the other toxic bile salts by competition.
However, the mechanism of changes in activities of alcohol metabolizing enzymes in cholestatic hepatobiliary disease is still unknown. Further investigations should eventually resolve this issue.
References
Crow KE, Kiston TM, MacGibbon AK, Batt RD. Intracellular localisation and properties of aldehyde dehydrogenase from sheep liver. Biochim Biophys Acta 1974;121-28
Drew R, Priestly BG. Choleretic and cholestatic bile salts in the rats. Experimentia 1963;35:809-11
Gornal AG, Bardawill CJ, David MM. Determination of serum protein by means of Biuret reaction. J Biol Chem 1949;177:
751-66
Greim H, Tr lzsch D, Roboz J, Dressler K, Czygan P, Hutterer F, Schaffner, Popper H. Mechanism of cholestasis 5. Bile acids in normal rat livers and in those after bile duct ligation.
Gastroenterology 1972;63:837-45
Han BH, Kim YH. Effect of high taurocholate load on activity of rat liver arylesterase. Kor J Hepatol 1997:3:154-69 Han BH, Kim YH. Effect of high taurocholate load on activity of rat liver cholinestarse. Keimyung Med J 1998;17:487-503 Hardison WGM, Hatoff DE, Miyai K, Weiner RG. Nature of bile acids maximum secretory rate in the rat. Am J Phisiol 1981;
241:G337-41
Hardison WGM, Weiner RG, Hatoff DE, Miyai K. Similarities and differences between models of extrahepatic biliary obstruction and complete biliary retention without obstruction in the rat. Hepatology 1983;3:383-90
Harada S. [Classification of alcohol metabolizing enzymes and polymorphisms--specificity in Japanese]. [Review] Nihon Arukoru Yakubutsu Igakkai Zasshi 2001;36:85-109
Hoffmann AF. The continuing importance of bile acids in liver and intestinal disease. Arch Intern Med 1991;159:2647-58 Horton AA, Mills DJ. Developmental patterns of alcohol dehydrogenase and aldehyde dehydrogenases in homo- genates and subcellular fractions of rat liver. Mech Aging Dev 1978;11:363-70
Ihm JS, Kim YH. Thiosulfate sulfurtransferase and UDP- glucuronosyltransferase activities in cholestatic rat liver induced by common bile duct ligation. Exp Mol Med 1997;29:
197-201
Koivula T, Koivusalo M, Lindros KO. Liver aldehyde and alcohol dehydrogenase activities in rat strains genetically selected for their ethanol preference. Biochem Pharmacol 1975;24:1807-11
Koivula T, Koivusalo M. Different forms of rat liver aldehyde dehydrogenase and their subcellular distributions. Biochem Biophys Acta 1975:397:9-23
Kwak CS, Kwak JS. Cell fractionation method of the rat liver.
Keimyung Univ med J 1986;5:251-61
Kim YH and Joo I. Arylamine N-methyltransferase and thiol methyltransferase activities in cholestatic rat liver induced by common bile duct ligation. Exp Mol Med 2001;33:23-28 Kim SK, Kim YH. Induction of rat liver γ-glutamyl transpeptidase by bile acid load. Kor J Hepatol 1997;3:210-26
Kitani K, Kanai M, Ohta M, Sato Y. Differing transport maxima values for taurine-conjugated bile salts in rats and hamsters.
Am J Phisiol 1986;251:G852-58
Kwak CS, Kim YH, Mun KC. Activities of alcohol metabolizing enzymes in the cholestatic rat liver. Keimyung Univ Med J 1988;7:64-75
Lieber CS. Alcohol Metabolism. In Alcoholic Liver Disease (Hall, P., eds.), 1985;1-68, Edward Arnold, London
Lieber CS, Decarli LM. Ethanol oxidation by hepatic microsomes; adaptive increase after ethanol feeding. Science 1968;162:917-18
Mezey E, Cherrick GR, Holt PR. Serum alcohol dehydrogenase, an indicator of intrahepatic cholestasis. N Engl J Med 1968;279:241-48
Morgan WA, Dingg Y, Bach PH. The relationship between sodium chloride concentration and bile acid cytotoxicity in cultured kidney cells. Renal Failure 1998;20:441-50
Nelson DP, Kiesow LA. Enthalpy of decomposition of hydrogen peroxide by catalase at 25 (with molar extinction coefficients of H2O2 solutions in the UV). Anal Biochem 1972;
49:479-91.
Ogawa Mink J, Hardison WGM, Miyai K. Alkaline phosphatase activity in hepatic tissue and serum correlates with amount and type of bile acid load. Lab Invest 1990;62;
87-95
Pan J, Soler X, Par A, Gaballer J, Farr, Rod J. Influence of liver disease on hepatic alcohol and aldehyde dehydrogenase. Gastroenterology 1989;97:708-14
Plapp BV, Leidal KG, Smith RK, Murch BP. Kinetic inhibition of ethanol metabolism in rats and the rate-limiting role of alcohol dehydrogenase. Arch Biochem Biophys 1984;230:33- 38
Pietruszko R. Mammalian liver alcohol dehydrogenases. Adv Exp Med Biol 1975;56:1-31
Skursk L, Kov J, tachov M. A sensitive photometric assay for alcohol dehydrogenase activity in blood serum. Anal Biochem 1979;99:65-71
Stiel A. Pathophysiology of cholestasis: correlation between bile acid metabolism and liver damage. [Review] Z Gastroenterol 1992;30 Suppl 1:46-48
Toyota N, Miyai K, Hardison WGM. Effect of biliary pressure versus high bile acid flux on the permeability of hepatocellular tight junction. Lab Invest 1984;5:536-42
Vidal F, Perez J, Morancho J, Pinto B, Richart C. Hepatic alcohol dehydrogenase activity in alcoholic subjects with and without liver disease. Gut 1990;31:407-11