J. Korea Inst. Build. Const., Vol. 16, No. 1
http://dx.doi.org/10.5345/JKIBC.2016.16.1.087
www.jkibc.org
Analysis of Living Noise in a Multi-unit Dwelling using Acoustic Simulation
Yang, Ginam
1Ann, Joon-suk
2Kim, Daewon
3Kim, Gwang-Hee
3Shin, Yoonseok
3*Department of Architectural Engineering, Kyonggi University, Yeongtong-Gu, Suwon-Si, 443-760, Korea
1Department of Architectural, Kyonggi University, Yeongtong-Gu, Suwon-Si, 443-760, Korea
2Department of Plant Architectural Engineering, Kyonggi University, Yeongtong-Gu, Suwon-Si, 443-760, Korea
31)
Abstract
More than half of Korea’s urban population currently lives in multi-unit dwellings. This particular residence structure inevitably positions the living spaces of residents in close proximity to one another. Because of this proximity, the sounds of a particular household will transfer to other residents’ units creating conflict between tenants.
Efforts to alleviate this problem have been made in both the public and private sector. A prominent method of noise analysis between living units has been to make an actual sound measurement and obtain qualitative measurements from questionnaires. Although this method has been most widely used, such analysis requires a large amount of human effort and time. In addition, the questionnaire method fails to provide the objective information needed to accurately assess the noise situation. To overcome the inadequacies of this previous method, this study seeks to evaluate the applicability of an acoustic simulation method. Three types of living noises were analyzed to assess the noise levels passed between multi-unit dwellings. The acoustic simulation method was found to be more economical, efficient, and adaptable in information processing. The results of this study can be further applied to design and control living-noise through procedures such as acoustic absorption or space redesign.
Keywords : multi-unit dwelling, living noise, acoustic simulation, space design
1. Introduction
1.1 Research background and objective
Multi-unit dwellings account for 63 percent of all residential buildings in Korea, a considerably high portion[1]. Multi-unit dwellings were activated as an alternative to make efficient use of land and resolve Korea’s housing shortage problem. As the result, the multi-unit dwelling is a generalized residential building. However, the structural proximity of neighboring units has been responsible for social
Received : December 14, 2015 Revision received : January 5, 2016 Accepted : January 15, 2016
* Corresponding author : Shin, Yoonseok
[Tel: 82-31-249-9721, E-mail: [email protected]]
ⓒ2016 The Korea Institute of Building Construction, All rights reserved.
issues such as invasion of privacy and psychological stress due to living noise[2]. Legal conflicts have continuously been reported due to living noise, particularly inter-floor noise, which in extreme cases have even precipitated physical confrontations and in at least once case, murder.
Both the Korean government and the private
sector have made efforts to reduce the conflicts
arising from living noise. The Ministry of Land,
Infrastructure, and Transport revised the related
laws and regulations, including the accreditation
scheme of a floor structure and floor impact noise of
a multi-unit dwelling(Enforced in July 1, 2005)[3] In
addition, many researchers have conducted studies
to analyze the current state of noise occurrence, and
the characteristics of noise sources found in the
Analysis of Living Noise in a Multi-unit Dwelling using Acoustic Simulation
multi-unit dwelling[4]. However, a limitation of these studiesis that they have been heavily dependent either on objective data of actual noise measured using a sound meter or on subjective data from a questionnaire survey, and are hardly reliable in terms of their accuracy.
The introduction of an acoustic simulation technique to a living noise analysis can be an alternative to address this issue. Moreover, if the acoustic simulation is applied to the living noise analysis, it can save time and reduce the manpower needed, since it is not necessary to measure the noise repeatedly. In addition, the acoustic simulation offers the advantages of providing the closest results in the evaluation of living noise distribution with changes in spatial compartment or the use of sound absorbing material, without the need to construct a structure. Despite these advantages mentioned above, there have been almost no studies conducted using acoustic simulation in a living noise analysis of multi-unit dwelling. For this reason, the aim of this study is to analyze living noise of a multi-unit dwelling using an acoustic simulation, and verify the applicability of the simulation. The findings of this research can be utilized as fundamental data to develop a guideline for a multi-unit dwelling design in consideration of living noise, and reduce the living noise of the multi-unit dwelling in the future.
1.2 Research scope and methodology
The scope of this research is restricted to employing an acoustic simulation in a living noise analysis of a multi-unit dwelling, and assessing its applicability. To be specific, TV noise, inter-floor noise and sink noise are analyzed in this research of all the living noise sources of a multi-unit dwelling.
In the acoustic simulation modeling, ‘Odeon,’ a commercial acoustic simulation program usually used for auditoriums and stadiums, is employed.
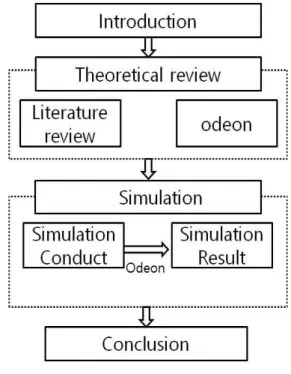
Figure 1 shows the research procedure.
Figure 1. Research Flow
2. Theoretical review
2.1 Literature review
Previous studies related with this research are listed in Table 1. The studies can be largely classified into the noise source analysis method of a multi-unit dwelling[3,4,5,6,7] and the noise source analysis through an acoustic simulation[8,9,10,11,12,13].
As indicated in Table 1, studies on living noise of
the multi-unit dwelling and the characteristics of
noise sources have usually been conducted through a
questionnaire survey and by measuring noise at an
actual site using a sound meter. However, conducting
an actual measurement is time-consuming and
requires a lot of manpower, and as a questionnaire
survey aims to analyze the subjective noise experienced
by residents it is hard to secure objectivity. The aim
of this study is thus to provide an efficient and
objective method for the analysis of living noise of the
multi-unit dwelling through the use of an acoustic
simulation program usually used for gymnasiums and
performing arts centers.
Classification Author Content
Noise source analysis method
Shin et al.
[3]
An analysis of living noise sources and their characteristics occurring in the multi-unit dwelling using a 'Selective Level
Meter(SLM)' Ryu and
Jeon [4]
A proposal of a combined rating system for multiple noises in residential building through a questionnaire survey and a hearing test
Choi [5]
An analysis of indoor noise levels and types through a questionnaire survey and measurement at an actual site
Lee [6]
An analysis of inter-floor noise of the multi-unit dwelling and need for a regulation of the inter-floor noise through a questionnaire survey and using a sound meter
Kim [7]
A study on the criteria for the inter-floor noise of the multi-unit dwelling and a noise reduction plan
Acoustic simulation
Jeong and Kim
[8]
Variation of acoustic performance by change in finishing material of a large gymnasium
Jeong and Kim
[9]
The improvement in acoustic performance of a glass-faced court yard using acoustic simulation
Nam and Kim
[10]
Acoustic performance improvement of performing arts halls in universities using acoustic simulation
Jeong et al.
[11]
An analysis of the noise reduction effect of a water turbine generator through an acoustic simulation Yun
and Jeong [12]
An analysis of room acoustics of multiplex theaters using an acoustic simulation
Kim et al.
[13]
An improvement plan for room acoustics of a multi-purpose performing center using an acoustic simulation
2.2 Odeon
‘Odeon’ is widely used for the acoustic design of diverse facilities, including multi-purpose performing arts centers, gymnasiums, and train stations. Odeon 0.9, which was developed based on
1990;the current version is Odeon13. This program is a 3D computer simulation using ray-tracing and an image model. Odeon enables a user to easily identify acoustic problems by identifying acoustic characteristics through auralization.[14]
Using a computer simulation technique in a room acoustic design has the following advantages[15].
First, at the initial design phase it is possible to swiftly correct any error occurring in the decision process of a room shape or finishing materials for the wall from an economic perspective. Second, the model used in the computer simulation is software, which is compatible. Third, the reverberation with the passage of time can be understood visually.
Fourth, it is comparatively easy to get the 3D directional information since the acoustic field model coded as a number in a computer can cut the 3D space arbitrarily. In sum, it is believed to be effective for living noise analysis due to its economic and fast processing ability, its high compatibility, its visual deliverability of information, and the numerical information acquisition.
3. Acoustic simulation for a living noise analysis
3.1 Spatial structure
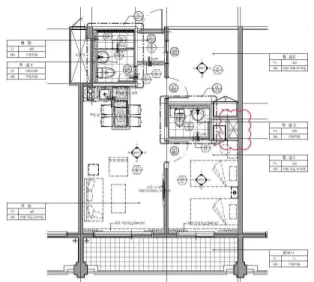
The simulation of an actual multi-unit dwelling
was carried out in this study. The multi-unit
dwelling was designed for the simulation to have five
individual spaces: two rooms, one living room, one
bathroom, and one veranda, as illustrated in Figure
2. The total floor area is about 70㎡. Based on the
floor plan in Figure 3, the subject dwelling was
modeled using a CAD program, and it was opened on
Odeon for the simulation. The acoustic
characteristics and major finishing materials of the
subject dwelling are listed in Table 2.
Analysis of Living Noise in a Multi-unit Dwelling using Acoustic Simulation
Figure 2. Floor plan of the house for the simulation
Figure 3. 3D Modeling(Auto CAD)
Division Frequency(hz)
Material 125 250 500 1000 2000 4000
Floor
Mortal on the concrete slab and linoleum or vinyl floor
finish
0.02 0.02 0.03 0.04 0.04 0.05
Living room
ceiling Gypsum board finish
on ceilingtrim 0.26 0.20 0.10 0.07 0.04 0.07 room ceilingBed Gypsum board finish
on ceilingtrim 0.02 0.22 0.15 0.10 0.08 0.07
Wall
Wallpaper finish on double gypsum board
dry wall using C-studs
0.02 0.03 0.05 0.06 0.07 0.08
Window Glass 0.1 0.07 0.05 0.03 0.02 0.02 Door Wooden door 0.20 0.10 0.10 0.08 0.10 0.10
Table 2. Finish materials and sound absorbing rate data of the
simulation
3.2 Simulation outline
In this study, room acoustic simulation methodology using ray-tracing technique was adopted to predict interior sound fields characteristics of the multi-unit dwelling. Using acoustic simulations, architectural planning and construction problems can be easily and quickly reviewed and predicted to improve acoustic quality. The ray-tracing method is often used in designing sound quality since it is easy to trace how a sound is reflected according to changes in interior finish materials using a drawing.
In order to evaluate reliability of the simulation model, in-situ acoustic measurement was carried out in advance according to ISO 3382-1. Acoustic simulation followed the same configurations with the in-situ measurement. Figure 4 shows sound source and receiver positions. A loudspeaker as a sound source was omni-directional characteristics, which was set at 3 positions with 1.5 m high above the floor. Microphone as a receiver was placed at 7 positions with 1.2 m high above the floor within the dwelling. The ray-tracing diagram obtained from the simulation is illustrated in Figure 5.
As for the simulation set-up, impulse response length was set to 1,000 ms in consideration of common reverberation time of 0.7 s in multi-unit dwellings. Transition order which determines reflection order by image mirror method was set to 2 in consideration of relatively small room volume less than 1,000 ㎡ of floor area and less diffusive surfaces (In case of complicated room model, transition order of 0 or 1 is usually applied).
Numbers of tracing rays were 2,000 for early rays
and 16,000 for late rays, respectively. Lamber’s law
as a scattering algorithm was applied. Background
noise leve was set to 27.1 dB(A) in consideration of
normal condition. As environmental parameters, air
temperature was set to 20℃, and relative humidity
was set to 50 %.
Figure 5. Ray-tracing
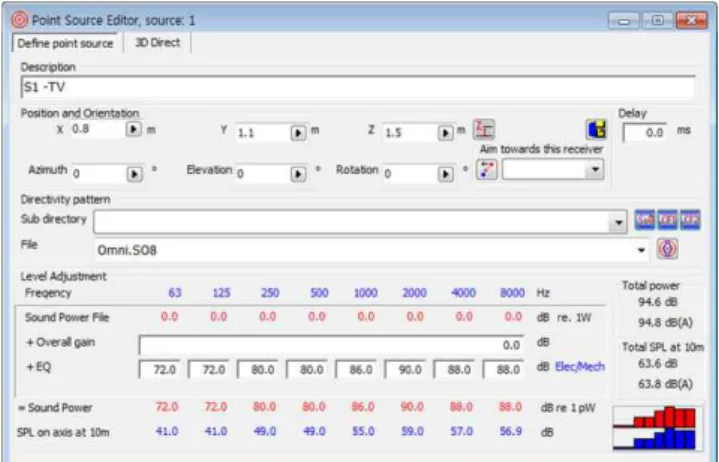
Before the simulation the television noise was set as indicated in Figure 6. The television noise and the sink noise were assumed as a point source with sound power level of 94,8 dB(A) in terms of total power level. The floor impact noise source is different from other noise sources as it has impact sound. For this reason, unlike the other noise sources above, the floor impact noise source was assumed as a surface source to be generated evenly on the entire ceiling in the simulation with sound power level of 76.6 dB(A) in consideration of its frequency characteristics as shown in Figure 7.
Figure 7. Inter-floor noise setting
Sound pressure level (SPL) and reverberation time (RT) were adopted as acoustic parameters for evaluation of sound fields characteristics in accordance with ISO 3382-1. SPL represents loudness characteristics of sounds, and RT represents liveness of sound fields. In detail, T30 which uses a decay rate of 30 dB was used for calculation of RT. Frequency range for acoustic analysis was 125 to 4,000 Hz in 1/1 octave bands.
Main acoustic parameters were visually demonstrated at 500 Hz and 2,000 Hz in consideration of major frequency properties of normal voice.
3.3 Reliability assessment of the simulation
ISO 3382-1 specifies the evaluation method of
sound fields characteristics in a room. Generally,
Analysis of Living Noise in a Multi-unit Dwelling using Acoustic Simulation
verification of simulated room sound fields in comparison with the actual sound fields is carried out mainly using reverberation time among acoustic parameters. Just Noticeable Difference (JND) of reverberation time is defined as relative 5%
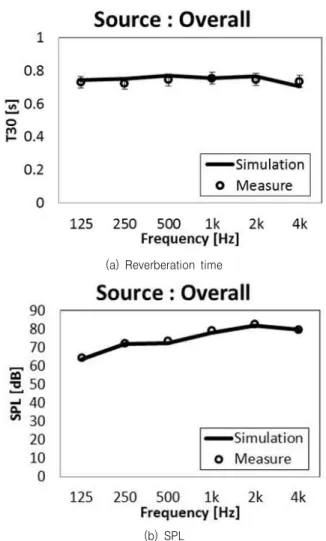
difference between measured and simulated values in accordance with Annex A in ISO 3382-1 as fitting guideline. Therefore, it is generally recognized that there is no perceptional difference when reverberation time difference between measured and simulated is smaller than 5% of the measured value. Table 3 shows the acoustic fitting results in terms of reverberation time according to sound source positions as a function of frequency bands. Each reverberation time was averaged from 7 receiver positions. As a result, all differences of the measured and simulated reverberation times were less than 5% of the measured values. In addition, sound pressure level also showed similar tendency between the measured and simulated values as shown in Figure 8.
Division T30 125 250 500 100
0 200
0 400
0
Site measures
A1 0.74 0.74 0.76 0.76 0.74 0.70
A2 0.73 0.71 0.74 0.77 0.75 0.78
A3 0.71 0.72 0.73 0.74 0.74 0.71
Average 0.73 0.72 0.74 0.75 0.75 0.73
Simulation estimates
A1 0.74 0.75 0.78 0.76 0.77 0.70
A2 0.75 0.75 0.77 0.76 0.77 0.71
A3 0.73 0.74 0.76 0.74 0.75 0.70
Average 0.74 0.75 0.77 0.76 0.76 0.70
Discrepancy 2% 4% 4% 0% 3% 4%
Table 3. Site measures and simulation estimates
(a) Reverberation time
(b) SPL
Figure 8. Result comparsion of simulation and acture measure
4. Simulation results and the analysis
4.1 Spatial distribution of sound pressure level The sound pressure level(SPL) refers to the size of a sound source. The SPL has a significant meaning in a soundproofing design for the multi-unit dwelling depending on the spatial compartment.
Figures 8 through 13 illustrate the visual distribution of the SPL at 500HZ and at 2000HZ, respectively
4.1.1 Television noise
In terms of television noise, Figures 9 and 10 are
the visual distribution of the SLP at 500Hz and at
2000Hz, respectively. The black circle is the
In Figure 9, the SPL of television noise was measured at 80dB at the noise source location. The SPL was measured at 60dB in Room 1, at 63dB in Room 2, at 73dB in the living room, and at 72dB at the sink. The SPL was measured highest at the sound source location, and lowest in Room 1. In Figure 10, the SPL of television noise was measured at 89dB at the noise source location. The SPL was measured at 74dB in Room 1, at 75dB in Room 2, at 83dB in the living room, and at 81dB at the sink. The SPL was measured highest at the sound source location, and lowest in Room 1.
Figure 9. SPL at 500Hz
Figure 10. SPL at 2000Hz
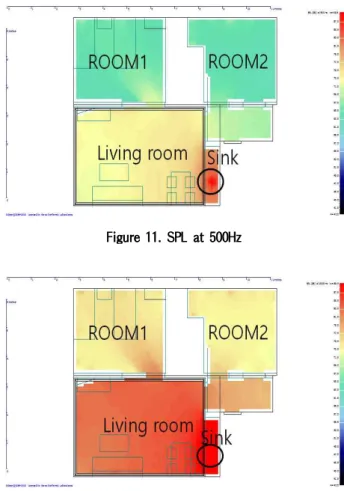
4.1.2 Sink noise
In terms of sink noise, Figures 11 and 12 show the visual distribution of the SPL at 500Hz and at 2000Hz, respectively. The black circle is the
In Figure 11, the SPL of sink noise was measured at 85dB at the noise source location. It was measured at 64dB in Room 1, and at 62dB in Room 2, and 74dB in the living room. The SPL was measured highest at the sound source location, and lowest in Room 2.
In Figure 12, the SPL of sink noise was measured at 89dB at the noise source location. It was measured at 75dB in Room 1, and at 73dB in Room 2, and 84dB in the living room. The SPL was measured highest at the sound source location, and lowest in Room 1.
Figure 11. SPL at 500Hz
Figure 12. SPL at 2000Hz
4.1.3 Inter-floor noise
In terms of inter-floor noise, Figures 13 and 14 show the visual distribution of the SPL at 500Hz and at 2000Hz, respectively. The black circle is the receiving point of the inter-floor noise.
In Figure 13, the SPL of inter-floor noise was
Analysis of Living Noise in a Multi-unit Dwelling using Acoustic Simulation
measured at 63dB in the living room. It was measured at 50dB in Room 1, and at 55dB in Room 2, and 61dB at the sink. The SPL was measured highest in the living room, and lowest in Room 1. In Figure 14, the SPL of inter-floor noise was measured at 44dB in the living room. It was measured at 40dB in Room 1, and at 40dB in Room 2, and 42dB at the sink. The SPL was measured highest in the living room, and lowest in Rooms 1 and 2.
Figure 13. SPL at 500Hz
Figure 14. SPL at 2000Hz
4.2 Analysis of reverberation time
The reverberation time is the most important evaluation index for the resonance level. It is defined as the time taken to decay by 60dB from a direct sound. The results of the analysis of reverberation time are illustrated in Figures 15 and 16.
Figure 15. Reservation time of the sink noise
Figure 16. Reservation time of the television noise
As shown in Figure 15, the reverberation time of the sink noise was 1 second in Room 2, which was the highest, while it was 0.52 seconds at the sink, which was lowest. As shown in Figure 16, the reverberation time of the television noise was 0.96 seconds in Room 2, which was thehighest, while it was 0.48 seconds at the sink, which was lowest.
4.3 Analysis of results
In the study, a simulation of the living noise that might be caused in a multi-unit dwelling was implemented. For the simulation, the living noise was divided into television noise, sink noise, and inter-floor noise.
In the research findings, it was found that the SPL
was highest at the noise source location, and it was
distributed differently depending on distance from
the noise source. The SPL of the inter-floor noise
Rooms 1 and 2. In addition, the reverberation time was longer in Room 2, and shorter in Room 2. As the result, the distribution of the SPL was identified visually, and the SPL was compared by the distribution in each space.
In conclusion, the following advantages are provided when an acoustic simulation is utilized to analyze living noise. First, the acoustic simulation model is more economic, swift and objective in information processing compared with existing research methods. Second, the acoustic simulation technique enables the researcher to flexibly cope with changes in actual and virtual conditions. Third, the acoustic simulation technique helps the researcher to understand the data easily due to its visual conveyance of information. Fourth, the acoustic simulation technique makes it possible to save and retrieve the results as numerical data.
Finally, the simulation result shows very accurate prediction results, as shown in Table 3 and Figure 8. Thus, this accurate model means the acoustic simulation has potential applicability in living noise analysis. Therefore, the acoustic simulation approach can be utilized in floor plan, finishing material selection, constuction method selection considering the effect of the living noise.
5. Conclusion
Residents of multi-unit dwellings are prone to conflicts with their neighbors due to the audibility of living noise caused by the proximity of high numbers of other households. For this reason, many studies have been conducted to resolve the problem. In previous analyses it has been a general rule to collect data through a questionnaire survey and actual site measurement. However, it requires a great deal of time and manpower to measure the noise at an actual
dependent on people’s subjective evaluations.
Therefore, the acoustic simulation was applied to a living noise analysis of the multi-unit dwelling. As a result, it was found to have many advantages compared with the conventional research method for living noise, including more economic and efficient information processing, flexible analysis, visual result presentation, and available numerical data.
Based on this, it is expected that the acoustic simulation can be actively utilized in living noise analysis. If the findings of this research are utilized in the soundproofing design of a multi-unit dwelling, it is expected that living noise can be reduced through the installation of sound absorbing materials and the division of spaces.
In this study, the acoustic simulation was utilized for the living noise analysis of a multi-unit dwelling, and its applicability was verified. However, only three noise sources were selected, which is a limitation of this research. In addition, the question of how the installation of sound absorbing materials and changes in space division can have an impact on the living noise was not dealt with. These will be discussed in a future study.
Acknowledgement
This research was partly supported by a National Research Foundation of ICT R&D program of MSIP/IITP [2014-044-055-002. Loudness Based Broadcasting Loudness and Stress Assessment of Indoor Environment Noises]
References
1. Lee JG, Jeon YH, Park JC. A Study on the Double Layer Structure to Reduce of Noisy through Floor in Apartment Units. Journal The Korean Society of Living Environmental System. 2015 Apr;22(2):305-10.
2. Ham JS. An arbitration case of inter-floor noise conflict in
a multi-unit dwelling. Proceeding of the Korea Residential
Analysis of Living Noise in a Multi-unit Dwelling using Acoustic Simulation