480
Copyright © 2021 The Korean Society of Fisheries and Aquatic Science pISSN:0374-8111, eISSN:2287-8815
서 론
남해강진만은사천시
,
하동군과남해군에위치한주요패류 생산해역중하나로수출용패류생산지정해역제7
호로지정되 어있다(Shin et al., 2018).
지정해역은수입국기준에따라해역 의수질,
패류의위생상태를비롯하여오염원에대한지속적인 관리가이루어진다(Park et al., 2011).
따라서패류의위생안전 성확보를위해서는해역의수질뿐만아니라병원성세균이나 입자유해물질과같은육상기인오염물질의유입량,
이동경로,
확산범위등수로학적요소에대한평가가요구된다
(US FDA,
2017).
패류의경우주로연안에서식하고있어육상기인오염물질에쉽게노출될수있으며패류의여과섭식과정에서이러 한오염물질이축적될우려가있어특별한위생관리가필요하 다
(Shin et al., 2017). 2012
년3
월에실시된수출용패류생산지정해역현장점검에서노로바이러스가검출되면서수출이전면 중단되어약
800
억원의피해액이발생한바가있으며이로인 해수출용패류생산해역의위생학적안전성확보를위한육상 기인오염물질의관리에대한관심이높아지고있는실정이다.
육지와 인접한 해역의 경우 육상기인 오염물질에 매우 취약한데
(Mee, 2012),
해역을 위생학적으로 안전하게 관리하기위해서는오염물질의거동특성에대한연구는필수적이다
(Balachandran et al., 2008).
체류시간은물질수송시간을표현 하는개념중하나로해역내의물질이경계를벗어나기까지 소요된시간으로정의된다(Monsen et al., 2002; Delhez et al.,
2014).
체류시간의공간분포특성은해역의물리과정뿐만아니라생지화학과정의공간적인차이를설명하는데유용하며
,
육 상기인오염물질의거동특성에대한간접적인정보를제공한 다(Monsen et al., 2002; Park et al., 2011b; Kim et al., 2020).
Modeling Variation in Residence Time Response to Freshwater Discharge in Gangjin Bay, Korea
Jin Ho Kim, Sung-Eun Park
1
* and Won-Chan Lee1
South Sea Fisheries Research Institute, National Institute of Fishery Science, Yeosu 58780, Korea
1Marine Environment Research Division, National Institute of Fishery Science, Busan 46083, Korea
The term residence time is defined as the time taken for substances in a system to leave the system and is a useful concept to explain the physical environment characteristics of a coastal area. It is important to know the spatial char- acteristics of the residence time to understand the behavioral properties of pollutants generated in a marine system.
In this study, the spatial distribution of average residence time was calculated for Gangjin Bay, Korea, using a hydro- dynamic model including a particle tracking module. The results showed that the average residence time was about 10 days at the surface layer and about 20 days at the bottom layer. Spatially, this was the longest residence time in the southwestern sea. There was no significant difference in average residence time at the surface layer due to fresh- water discharge, but spatial variation at the bottom layer was larger. The average residence time at the bottom layer decreased in the southwestern area due to freshwater discharge and increased in the northern area. This result suggests that the residence time of anthropogenic pollutants may have a large spatial difference depending on the freshwater discharge, and thus the time taken to influence cultured organisms may also vary.
Keywords: Residence time, Freshwater discharge, Vertical variation, Particle tracking model
*Corresponding author: Tel: +82. 51. 720. 2521 Fax: +82. 51. 720. 2515 E-mail address: [email protected]
This is an Open Access article distributed under the terms of the Creative Commons Attribution Non-Commercial Licens (http://creativecommons.org/licenses/by-nc/3.0/) which permits unrestricted non-commercial use, distribution, and reproduction in any medium, provided the original work is properly cited.
Received 23 June 2021; Revised 15 July 2021; Accepted 22 July 2021 저자 직위: 김진호(연구사), 박성은(연구사), 이원찬(과장) https://doi.org/10.5657/KFAS.2021.0480
Korean J Fish Aquat Sci 54(4), 480-488, August 2021
담수유입에 따른 체류시간 변화
481
남해강진만의경우자연하천과함께인구밀집지역이인접 하고있는반폐쇄성내만으로강우시유입되는육상기인오염 물질이해상양식장과양식생물에직접적인영향을줄가능성 이매우높다
(Park et al., 2011a).
또한,
해역으로유입된육상기 인오염물질의성상에따라침강특성이달라지며수심별해수 순환특성의차이에따라오염물질의해역내체류시간또한큰 차이가발생할수있다.
여기에남해강진만은지형적인특성으 로인해대방수로,
노량수로,
창선수로등주요수로를통해해 수의유출·
입이일어나므로시간에따라만내부에복잡한해수 순환구조가형성되며(Kim and Yoon, 2009),
이로인해만내 로유입된물질의거동특성또한시·
공간적으로복잡할것으 로판단된다.
본연구에서는강우에따른육상기인오염물질의거동특성 을파악하기위해서해수유동모델과입자추적모델을사용하여 체류시간
(Monsen et al., 2002; Park et al., 2011b)
의공간적분 포특성을파악하였다.
또한,
강우시하천을통해담수가대량 으로유입될때표층과저층의체류시간변화를정량적으로비 교하였다.
재료 및 방법
사용모델
본연구에서는남해강진만의해수순환특성을재현하기위해 서
EFDC (environmental fluid dynamic code)
를사용하였다. EFDC
는수평방향으로는직교-
곡선좌표계를사용하며수직으 로는Sigma (Sigma-Aldrich Co. Ltd., St. Louis, MI, USA)
나sigma-zed
좌표계를 사용할수있는것이특징이다(Hamrick
and Mills, 2000). EFDC
에는입자추적모듈이포함되어있어해역의해수순환특성재현과동시에입자추적모의하는것이 가능하다
. Lagrangian
입자추적모듈은Random walk method
를적용하고있는데이를통해난류혼합에의한입자의거동을해석할수있으며통계적인처리가가능하다
(Suh, 2006; Suh
and Lee, 2011).
계산 조건
남해강진만의체류시간계산을위해강진만을비롯하여광양 만을포함한해역을대상으로모델을구성하였다
(Fig. 1).
격자의크기는
104.4-870.9 m
로가변격자를적용하였으며사용된격자의수는총
4,728
개이다.
수직으로는5
개층으로구성하고계산시간간격은
1
초이며입자추적모델의모의기간은50
일로 Fig. 1. Computation grid for study area.Fig. 2. Precipitation and simulated river discharge at Sacheongang station.
Fig. 3. Gangjin Bay (Namhae, South Korea) showing monitoring stations and boundary for residence time calculation (check box, designated shellfish growing area for export; black circle, float- ing buoy; blue circle, water current measurement; red circle, tidal gauge).
설정하였다
.
모델의개방경계에는해양조사원에서제공하는4
개분조(M
2, S
2, O
1, K
1)
의진폭과위상값을입력하였으며바람 은없는것으로가정하였다.
관측된 하천유량을 검증자료로 활용하여 유역모델을 통해 남해 강진만으로 유입되는 담수유입량을 계산하였다
(NIFS,
2016).
유역모델을통해계산된하천은총54
개이며해수유동모델에전체하천을고려하였다
.
계산된담수유입량을토대로 갈수기,
평수기,
풍수기로설정하였다(Fig. 2).
이를통해담수유 입량의많고적음에따른표층과저층의체류시간변화정도를 정량적으로비교하였다.
본연구에서체류시간은방류된입자가최초로경계를벗어 난시점으로정의하였으며
Fig. 1
의경계내에격자당1
개씩총2,841
개의입자를동시에방류하여입자추적모델을모의하였다
(Park et al., 2011b ; Kim et al., 2020).
방류된입자는해수의 흐름에따라이동하며30
분간격으로위치정보가저장되도록 설정하였다.
입자추적모델의모의에서입자의거동특성과해역내체류시간은방류시점에따라달라지므로각기다른시점 에방류한입자의체류시간을평균한평균체류시간을계산하였 다
(Park et al., 2011b; Kim et al., 2020).
현장관측
수립된모델의검증을위해대방수로에서유속과유향을관 측하였으며조위검증은해양조사원의조위자료
(
삼천포)
를이용하였다
(Fig. 3).
또한,
입자추적모델검증을위해표류부이현장관측을수행하였다
. 2017
년3
월13
일06
시부터10
시까지대 조기창조시에대상해역인남해강진만의동,
서,
남쪽의수로 와대부분의하천이유입되는북쪽해역의경계그리고남해군 인근의해역에각각표류부이를투하하여해수의방향이반대 가될때까지표류부이의위치정보를수집하였다.
표류부이궤 적자료를통해각수로에서유입되는해수가어떻게이동하 는지를파악하고해역의중앙부에서의해수순환특성을파악 하였다.
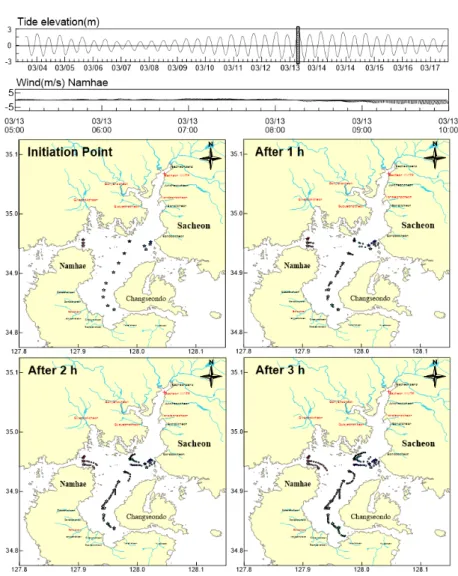
Fig. 4. Lagrangian trajectories of the floating buoys with tide elevation and wind vectors.
담수유입에 따른 체류시간 변화
483
결 과
표류부이궤적
2017
년3
월13
일대조기창조시에관측한표류부이궤적을비롯하여관측시기의조시와바람에대한정보는
Fig. 4
와같다.
현장관측당시대조기창조로유속이강하게형성되었으며바 람은거의없었다.
표류부이관측결과,
동쪽과서쪽에서방류 한부이는해수의흐름을따라해역의중앙으로이동하였으며 남쪽수로에서방류한부이역시만내측으로이동하지만그거 리는비교적짧게나타났다.
해역의중앙부에방류한부이는방 류직후남하하는것으로나타났는데,
이는동쪽과서쪽의수로 를통해유입된해수가중앙에서수렴하여남하한결과로생각 할수있다.
또한,
남쪽의수로를통해유입된해수는강진만중 앙해역의해수순환에영향을미치지못하는것을알수있다. 모델 검증
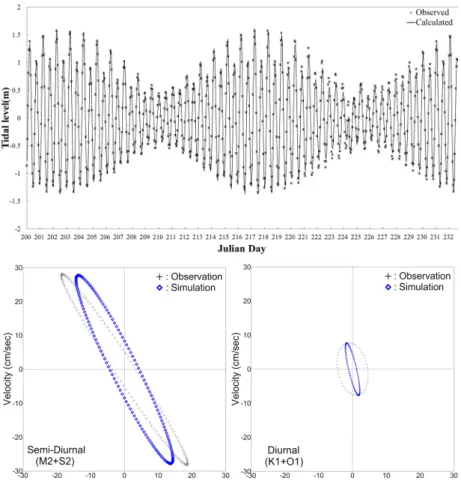
수립된모델을검증하기위해조위와유속에대하여관측값 과모델에서계산한값을비교하였다
(Fig. 5).
모델검증을위해RAAE (relative absolute average error)
를계산한결과,
조위의경우
2%
이며조류는17%
로계산되었다.
조위는10%
이내,
조류는
20%
이내일때모델의재현성이양호하다고판단할수있다
(Kim and Yoon, 2011).
또한반일주조와일주조모두유사한 조류타원을보이고있는것을확인할수있어수립된모델이남 해강진만의해수순환특성을잘재현하고있는것으로판단할 수있었다.
입자추적모델결과의재현성을확인하기위해관측 된부이궤적을입자추적모델계산결과와비교하였다(Fig. 6).
이때
,
구조물에걸려명확한궤적을얻을수없었던부이의궤적 은제외하였다.
부이의궤적과입자의궤적을비교한결과유사 한궤적을나타내고있는것을확인할수있다.
특히남해와창 선도사이의해역에서창조시남하하는흐름과창선수로인근 에서방류한부이가창조시에동쪽으로이동하는것을모델에 서잘재현하고있다.
이러한결과는세개의수로를통해동시 에해수가유입하는남해강진만의경우내부에서복잡한해수 순환이나타날것으로예상할수있는데본연구에서수립된모 델이남해강진만의공간적인해수순환특성을잘재현하고있 다는것을의미한다.
해수유동 특성
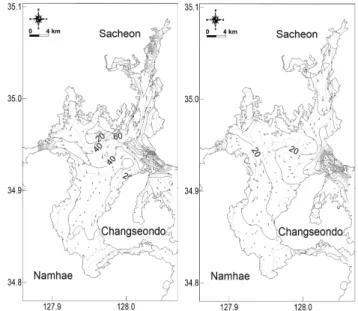
계산된남해강진만의해수순환특성은
Fig. 7
과같다.
남해강Fig. 5. A comparison between observed tidal level and current and calculated value.
진만은창조시동쪽경계인대방수로와서쪽경계인노량수로
,
남쪽의창선수로를통해동시에해수가유입하는것으로나타 났다.
동-
서에서유입된해수는해역의중앙에서수렴하여남하 하며남쪽의창선수로를통해유입된해수는유입직후해역중 앙에서남하하는해수와만나는것을알수있다.
이러한해수 순환구조로인해남해군인근해역에서는Fig. 4
의표류부이궤 적에서알수있듯이창조시남하하는흐름이나타나며남해군 인근의해수는거리상가까운창선수로보다거리가먼노량수 로를통해교환되기쉬운환경임을알수있다.
이를통해남해 군인근해수의체류시간은길것으로추측할수있다.
대방수로 에서유입한해수중일부는북쪽해역으로이동하는데이를통 해북쪽해역의해수는주로대방수로를통해해수교환이이루 어지는것을알수있다.
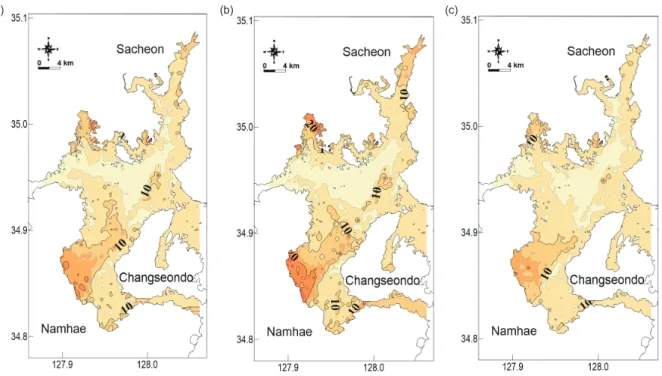
평균체류시간 특성
담수유입에 따른 표층과 저층의 평균체류시간 공간분포는
Fig. 8, Fig. 9
와같다.
먼저표층의경우평수기에평균체류시 간은대부분의해역에서10
일내외로계산되었으며남해군인 근해역에서20
일이상으로가장긴평균체류시간이나타났다(Fig. 8).
갈수기와풍수기의경우중앙해역에서평균체류시간의변화는크지않았지만남해군인근에서강수량이증가함에 Fig. 6. A comparison between observed trajectories of floating buoys (left) and calculated particle track (right).
Fig. 7. Simulated maximum current vector field computed in Gangjin Bay during flood (left) and ebb (right) in spring tide con- ditions.
따라평균체류시간이감소하는것으로나타났다
.
이러한특징 은남해군인근뿐만아니라하천유입지점부근에서확인할수 있다.
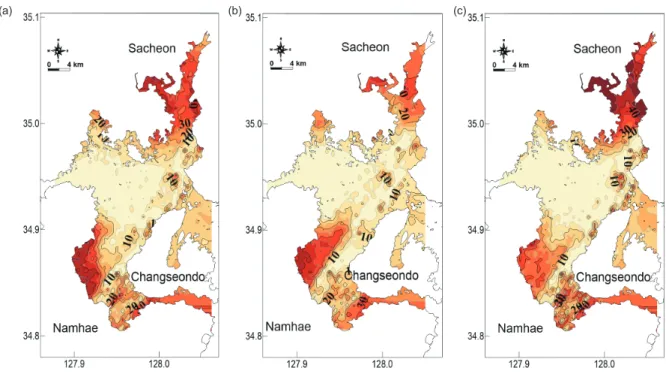
저층의평균체류시간계산결과에서는강진만중앙해역에서 약
10
일내외로표층과유사한평균체류시간이계산되었지만 북쪽해역과남해군인근해역에서는약40
일로표층에비해2-4
배이상긴평균체류시간이계산되었다(Fig. 9).
표층에서강수 량에따른평균체류시간의변화가가장뚜렷하게나타난남해 군인근해역에서는강수량이증가함에따라저층의평균체류 시간또한감소하는것으로나타났다.
반면,
북쪽해역에서는 강수량이증가한경우저층의평균체류시간이증가하는것으 로나타났다.
이러한표층과저층의평균체류시간결과는육상기인오염물 질이강진만으로유입될경우표층에비해저층에서더긴시간 동안체류하는것을의미하며입자오염물질이유입된후침강 하면서저층에도달할경우부유상태의오염물질보다더욱긴 시간동안해역내에체류할수있음을시사한다
.
강수량에따른공간적인평균체류시간변화를정량적으로파 악하기위한풍수기와갈수기의평균체류시간차
(
갈수기-
풍수 기)
는Fig. 10
과같다.
강우시표층에서는전체적으로약1.2
일 의평균체류시간증가하였으며공간적인평균체류시간의변화 는크게나타나지않았다.
반면저층에서는담수유입에의해전 체적으로평균체류시간이1.29
일감소하였는데표층과달리평 균체류시간증감에대한공간적차이가뚜렷하게나타났다.
특 히남해군인근해역에서는평균체류시간이약15
일가량감소 한반면강진만북쪽해역에서는평균체류시간이약20
일가량담수유입에 따른 체류시간 변화
485
(a) (b) (c)
(a) (b) (c)
Fig. 8. Spatial distribution of averaged residence time of surface layer in Gangjin Bay during (a) normal, (b) rainy and (c) dry season.
증가하는것으로나타났다
.
이는집중강우로인해담수와함께 육상기인오염물질이강진만으로유입될경우저층에서체류시 간의공간적차이가커지는것을의미한다.
고 찰
본연구에서는표류부이현장관측결과를입자추적모델의결 과와비교하였다
(Fig. 6).
일반적으로입자추적모델의경우해 수유동모델을구성하여해역의해수순환특성을재현하고이 를토대로가상의입자를방류하여모의한다(Park et al., 2011b;
Chung and Duyen, 2012; Smyth et al., 2016).
수립된해수유동 모델이검증과정을통해해역의해수순환특성을잘재현하고 있다고판단할지라도이를토대로한입자추적모델의결과는 표류부이현장관측결과와일치하지않을수있다.
이러한불일치의이유는다음과같이생각할수있다
.
첫째,
해 수유동모델검증과정의한계이다.
일반적으로해수유동모델의 검증은복수의지점을대상으로관측한조류정보를토대로수 행되며이러한검증을근거로수립된모델이해역의해수순환 특성을잘재현하고있다고판단한다.
하지만이는복수의검증 지점에대한검증일뿐이며이를제외한대부분의해역은여전 히모델계산에의한추측으로남아있다.
남해강진만과같이복 수의수로를통해해수가거의동시에유출입할경우내부의해 수순환특성은아주복잡할것으로판단할수있으며이를검증 하기위해서는많은수의검증지점이필요할것이다.
하지만실 질적으로이를충족하는것은불가능에가깝다.
또한,
입자추적모델결과의정량적인검증방법은전무한실정으로이에대 한추후연구가필요하다
.
둘째
,
입자추적모델의한계이다.
앞서설명한바와같이입자 추적모델에서입자의확산은random walk method
에따라계 산된다.
이는확정론적인이송과정과확률론적확산과정에따 라입자의거동이모의되며입자추적모델의결과는특정현상 의재현이아닌확률론적인접근을의미하는것이다(Suh and
Lee, 2011).
따라서입자추적모델에서계산된입자의궤적은실제표류부이궤적과다를수있지만입자추적모델상에서입자 의수를증가시키면실제관측결과와유사한궤적이나올확률 이증가한다
.
이러한이유에도불구하고표류부이현장관측결 과와입자추적모델계산결과는비교적유사하게나타났으며(Fig. 6),
이는수립된모델이강진만의해수순환특성을비교적잘재현하고있는것을의미한다
.
남해강진만은굴
,
피조개등이주로생산되는해역으로5,290
ha
가 수출용패류생산지정해역으로 지정되어있어 해역의 세 균학적수질에영향을미치는육상기인오염물질유입에대한 관심이높아지고있는실정이다(Park et al., 2011b; Ha et al., 2013; Shin et al., 2017; Shin et al., 2018).
본연구에서는남해 강진만의평균체류시간을계산하고담수유입에따른평균체류 시간의공간적인변동특성을알아보았다.
평균체류시간변화양상은표층과저층에서다른양상이나타났다
(Fig. 8, Fig. 9,
Fig. 10).
이러한결과는해역으로유입된육상기인오염물질의성상에따라다른체류시간이나타날수있음을의미한다
.
즉,
김진호
ㆍ
박성은ㆍ
이원찬486
(a) (b) (c)
Fig. 9. Spatial distribution of averaged residence time of bottom layer in Gangjin Bay during (a) normal, (b) rainy and (c) dry season.
Fig. 10. Spatial distribution of the difference of averaged residence time between dry and rainy season at surface (left) and bottom (right) layer in Gangjin Bay.
담수유입에 따른 체류시간 변화
487
오염물질의비중이나침강속도에따라육상기인오염물질이해 역으로유입될경우체류시간에큰차이가발생할수있으며특 히표층보다저층으로유입된오염물질의경우강우에따라더 오랜시간체류하며양식생물에영향을줄수있음을의미한다
.
본연구에서는해역내에서방류된입자가최초로외경계를 벗어난시점을체류시간으로정의하였다.
하지만,
물질의체류 시간과영향시간(influence time)
은구분되며물질의해역내체 류시간이길다고반드시영향시간이긴것은아니다(Delhez et
al., 2014).
체류시간은본연구에서말한바와같이해역내입자가최초로외경계를벗어난시점으로정의되며이는
lagrang-
ian
개념이다.
하지만,
영향시간은eulerian
개념으로한지점에 서의물질체류시간을말하는것으로외부에서유입되는것을 포함한다(Delhez et al., 2014).
이를구분하기위해영향시간은local residence time (Abdelrhman, 2005), local flushing time (Jouon et al., 2006; Plus et al., 2009)
등의개념을사용하여연 구가수행되고있다.
따라서해역내양식생물에대한육상기인 오염물질의영향을정량화하기위해서는이러한영향시간에대 한추가적인연구가필요할것으로판단된다.
사 사
이 논문은
2021
년도 국립수산과학원 수산과학연구사업(R2021034)
의지원으로수행되었습니다.
References
Abdelrhman MA. 2005. Simplified modeling of flushing time and residence times in 42 embayments in New England, USA, with special attention to Greenwich Bay, Rhode Island. Estuar Coast Shelf Sci 62, 339-351. http://doi.
org/10.1016/j.ecss.2004.09.021.
Balachandran KK, Reddy GS, Revichandran C, Srinivas K, Vi- jayan PR and Thottam TJ. 2008. Modelling of tidal hydro- dynamics for a tropical ecosystem with implications for pol- lutant dispersion (Cochin Estuary, Southwest India). Ocean Dyn 58, 259-273. http://doi.org/10.1007/s10236-008-0153- Chung DH and Duyun NTK. 2012. Sensitivity of lagrangian par-6.
ticle tracking based on a 3D numerical model. J Mod Phys 3, 1972-1978. https://doi.org/10.4236/jmp.2012.312246.
Delhez EJM, Brye B, Brauwere A and Deleersnijder E. 2014.
Residence time vs influence time. J Mar Syst 132, 185-195.
https://doi.org/10.1016/j.jmarsys.2013.12.005.
Ha KS, YOO HD, Shim KB, Kim JH, Lee TS, Kim PH, Lee HJ and Yu HS. 2013. The effects of inland pollution sources around the port of Jeokyang and Jangpo after rainfall events on bacteriological water quality in the Changseon area, Korea. Korean J Fish Aquat Sci 46, 160-167. https://doi.
org/10.5657/kfas.2013.0160.
Hamrick JM and Mills WB. 2000. Analysis of water tempera-
ture in Conowingo Pond as influenced by the peach bottom atomic power plant thermal discharge. Eviron Sci Policy 3, 197-209. http://doi.org/10.1016/s1462-9011(00)00053-8.
Jouon A, Douillet P, Ouillon S and Fraunie P. 2006. Calculations of hydrodynamic time parameters in a semi-opened coastal zone using a 3D hydrodynamic model. Cont Shelf Res 26, 1395-1415. https://doi.org/10.1016/j.csr.2005.11.014.
Kim JH, Park SE, Kim YM, Kim CS, Kang SC, Jung WS, Sim BR and Eom KH. 2020. Assessing average residence time as a physical descriptor for shellfish farming area in Jaran Bay, Korea. J Environ Sci Int 29, 273-282. http://doi.org/10.5322/
jesi.2020.29.3.273.
Kim TY and Yoon HS. 2011. Skill assessments for evaluating the performance of the hydrodynamic model. J Korean Soc Mar Envron Energy 14, 107-113. https://doi.org/10.7846/
JKOSMEE.2011.14.2.107.
Kim YJ and Yoon JS. 2009. A study on the behavior of floating debris and fresh water diffusion according to discharge of Namgang Dam. J Ocean Eng Technol 23, 37-46.
Mee L. 2012. Between the devil and deep blue sea: the coastal zone in an era of globalization. Estuar Coast Shelf Sci 96, 1-8. https://doi.org/10.1016/j.ecss.2010.02.013.
Monsen NE, Cloern JE, Lucas LV and Monismith SG. 2002. A comment on the use of flushing time, residence time, and age as transport time scales. Limnol Oceanogr 47, 1545- 1553. https://doi.org/10.4319/lo.2002.47.5.1545.
NIFS (National Institute of Fisheries Science). 2016. Watershed modeling for land pollution management in Gangjin Bay.
Research Report 90, NIFS, Busan, Korea, 5-77.
Park KBW, Jo MR, Lee HJ, Kwon JY, Son KT and Lee TS.
2011a. Evaluation of the effect of the discharged water from Bong stream after rainfall events on the bacterial water qual- ity in Gangjinman, Korea. Korean J Fish Aquatic Sci 44, 622-629. https://doi.org/10.5657/kfas.2011.0622.
Park SE, Lee WC, Hong SJ, Kim HC and Kim JH. 2011b.
Variation in residence time and water exchange rate by re- lease time of pollutants over a tidal cycle in Masan Bay. J Korean Soc Mar Envron Energy 14, 249-256. https://doi.
org/10.7846/jkosmee.2011.14.4.249.
Plus M, Dumas F, Stanisiere JY and Maurer D. 2009. Hydrody- namic characterization of the Arcachon Bay, using model- derived descriptors. Cont Shelf Res 29, 1008-1013. https://
doi.org/10.1016/j.csr.2008.12.016.
Shin SB, Ha, KS, Lee KJ, Jung SH, Lee JH, Oh EG, Kim YK and Lee HJ. 2017. Assessment of sanitary safety of the oys- ter Crassostrea gigas, Short neck clam Ruditapes philippi-
narum and small ark shell Scapharca subcrenata in Gangjin
Bay, Korea. Korean J Malacol, 33, 275-283. https://doi.org/10.9710/kjm.2017.33.4.275.
Shin SB, Lim CW, Lee JH and Jung SH. 2018. Evaluation of inland pollution sources impact in the Gangjin Bay, Korea. J Kor Soc Fish Mar Edu 30, 2241-2248.
dispersion. Environ Model Softw 21, 234-242. https://doi.
org/10.1016/j.envsoft.2004.04.015.
Suh SW and Lee HY. 2011. Analysis of hydrodynamic change around the saemangeum area using a particle tracking meth- od. J Korean Soc Coast Ocean Eng 23, 442-450. https://doi.
org/10.9765/kscoe.2011.23.6.442.
US FDA (Food and Drug Administration). 2017. National shell- fish sanitation program, guide for the control of molluscan shellfish: 2017 Revision. Retrieved from https://www.fda.
gov/media/117080/download on Jun 23, 2021.