• 검색 결과가 없습니다.

The Impact of Product Distribution and Information Technology on Carbon Emissions and Economic Growth: Empirical Evidence in Korea

N/A
N/A
Protected

Academic year: 2021

Share "The Impact of Product Distribution and Information Technology on Carbon Emissions and Economic Growth: Empirical Evidence in Korea"

Copied!
12
0
0

로드 중.... (전체 텍스트 보기)

전체 글

(1)

Abstract

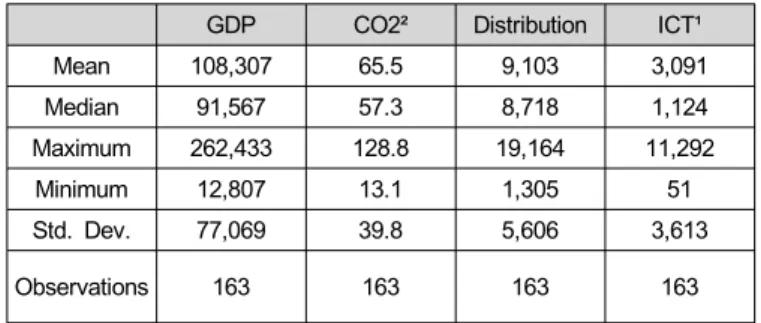
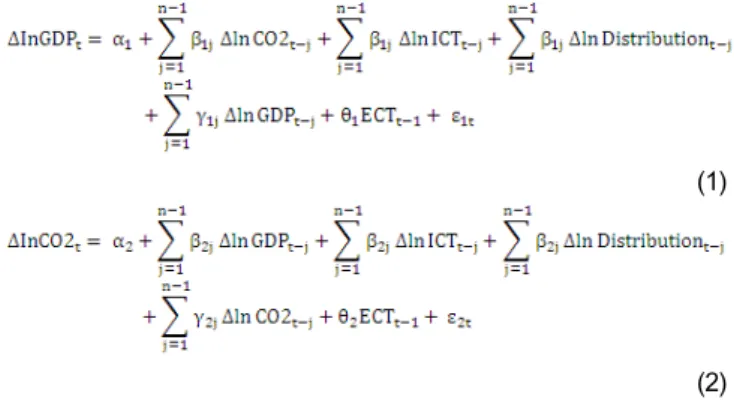
The paper deals with the impact of the product distribution and information technology sectors on energy resource use, car- bon emissions and economic growth by examining the long-run equilibrium relationships and Granger causal relationships among these variables in South Korea. The quarterly time series data from the first quarter of 1970 to the third quarter of 2010 (163 observations) are collected and retrieved from the Bank of Korea database. The paper examines the long-run equilibrium relationships using cointegration techniques and Granger cau- sality using vector error correction models. Test results indicate a long-run equilibrium relationship exists among these variables.

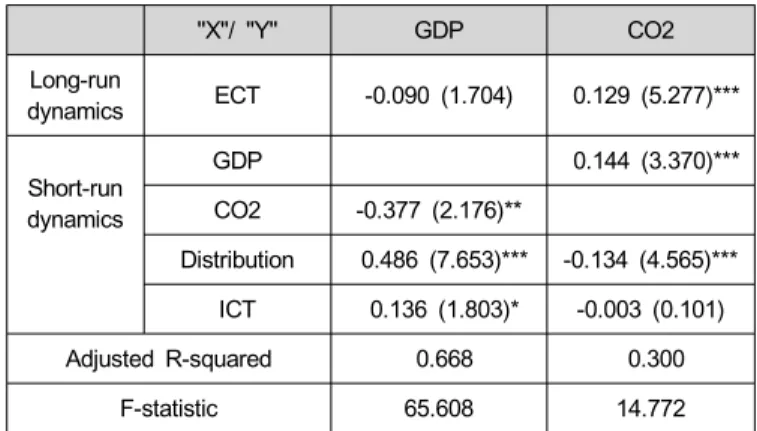
In testing directional causality, both the product distribution and the information technology sectors show direct effects on eco- nomic growth but only marginal effects on carbon emissions.

Keywords: energy resources, product distribution, information technology, carbon emissions, economic growth, South Korea

JEL Classification: L81, O44, O53, Q48, Q55

1. Introduction

Since the early 1970s, South Korea has built up a remark- able record of economic growth and integration in the high-tech modern and knowledge economy. A competitive education sys- tem, a highly skilled and dedicated workforce and advances in

* Assistant Professor, Administrative Sciences Department, Metropolitan College, Boston University [808 Commonwealth Avenue, Boston, MA 02215, USA Tel.: (+1 617) 358-5627 Fax: (+1 617) 353-6840 E-mail:

[email protected]]

information communications technology are widely acclaimed as key factors driving this knowledge economy. In recent years, however, a rapidly ageing population, international pressure for environmental sustainability initiative and widening gaps between and within industries are becoming increasingly apparent.

Finding best solutions to these problems is one of the greatest challenges faced by policy makers of South Korea today.

Carbon dioxide (CO2) emissions are those stemming from the burning of fossil fuels and the manufacture of cement. They in- clude carbon dioxide produced during consumption of solid, liq- uid and gas fuels and gas flaring. According to the International Energy Agency data from the World Energy Outlook 2009 report released in November 2010, CO2 emissions by South Korea grew by 113% between 1990 and 2007 – the largest growth among the 34 member nations of the Organisation for Economic Cooperation and Development. In comparison, during the 17-year period, global CO2 emissions grew by 38%. South Korea ranked as the world's ninth largest CO2 emitter with 488.7 million metric tons of CO2 in 2007, which is equivalent to about 10 metric tons per capita.

An annual publication of the Carbon Dioxide Information Analysis Center (Boden et al., 2011) reported that between 1970 and 2007 South Korea experienced phenomenal growth in fossil-fuel CO2emissions with a growth rate that averaged 11.5%

annually. Initial growth in emissions was owed to coal con- sumption, which still accounts for 46.9% of the fossil-fuel CO2 emissions of South Korea. Since the early 1970s oil con- sumption has been a major source of emissions. South Korea is the world's fifth largest importer of crude oil. Natural gas also became a significant source of CO2 emissions after 1987 as South Korea increased imports of liquid natural gas. All these data are likely to put greater pressure on South Korea to com- mit to aggressive CO2 cuts ahead of the United Nations Climate Change Talks.

Reuters News (2011) reported that South Korea’s ruling and opposition parties had agreed to approve an emissions trade bill in an upcoming parliamentary review, expected later in 2011, according to the chairperson of the Presidential Committee on Print ISSN: 2288-4637 / Online ISSN 2288-4645

doi: 10.13106/jafeb.2014.vol1.no3.17.

The Impact of Product Distribution and Information Technology on Carbon Emissions and Economic Growth: Empirical Evidence in Korea

2)

Jung Wan Lee*

[Received: April 14, 2014 Revised: May 12, 2014 Accepted: August 14, 2014]

(2)

Green Growth. The chairperson also said that South Korea would implement a carbon tax and raise power prices as cur- rent prices drive excessive demand. After strong opposition from industry, in April 2011 the government finalized the draft of the carbon emissions trading scheme bill by increasing free carbon allowances and softening penalty rules for non-compliance.

Green growth is a central policy of the administration of South Korean President Lee Myung-Bak, and the government aims to reduce greenhouse gas emissions voluntarily by 30% by 2020 from projected levels. On top of the emission trading scheme, the government would implement a carbon emission tax to cut pollution while also raising power prices. The government has planned on spending 27.5 trillion Korean won (equivalent to US$ 25.4 billion) over the next two decades on smart grids to make electricity distribution more efficient, reduce CO2emissions and save US$ 26 billion in energy imports.

Economic growth is the increasing ability of a nation to pro- duce more goods and services. Growth can occur in many dif- ferent ways: for example, the increased use of land, labor, capi- tal and business resources and increased productivity of existing resources. The use of information communications technology can facilitate the production of goods and services more effi- ciently and rapidly. The information communications technology infrastructure provides the framework for the efficient distribution of goods and services, improve communications between firms and spread to other industries. This further suggests the impact of the information communications technology sector in con- tributing to the economic growth of a country. The increased economic importance of information communications technology raises new questions for governments regarding the best policy frameworks to adopt in order to encourage information communi- cations technology-led green growth.

This paper therefore considers sustainable and green growth prospects for South Korea. Does the growth of the information communications technology sector affect economic growth? Does the growth of the information communications technology sector result in an increase in CO2 emissions? Does the growth of the product distribution sector lead to economic growth? Does the growth of the product distribution sector cause an increase in CO2 emissions? These are vital questions if we are explicitly to disentangle the impact of the information communications tech- nology and product distribution sectors on both energy resource use and green growth in the economy. Policy decisions will be more effective if they recognize these contextual relationships and how they relate and adapt to the existing country realities.

2. Literature Review

2.1. Economic Development, Energy Resource Use and Carbon Emissions

Is there a relationship between carbon emissions and eco- nomic development? The question is whether or not emission levels are connected with development levels. This line of re- search argues that the relationship between economic activity and carbon emissions may change as the economy moves through different stages of development. Economic activity may be a key driver of carbon emissions. Economic growth is often associated with high carbon emissions per unit of output. Many studies have examined the time-series dynamics between eco- nomic growth and CO2emissions to infer the direction of cau- sality cross-country (Coondoo & Dinda, 2008; Lee & Lee, 2009;

Luzzati & Orsini, 2009). The general consensus of these studies is that there is a close correlation between economic growth and environmental degradation: when an economy grows, the quality of the environment declines.

However, a theory of how economic growth does not always contribute to environmental degradation is proposed. Grossman and Krueger (1995) propose the environmental Kuznets curve hypothesis that postulates that the relationship between econom- ic development and the environment resembles an inverted U-curve. Many researchers provide extensive reviews and em- pirical studies of the hypothesis (Dinda, 2004; Martinez-Zarzoso

& Bengochea-Morancho, 2004; Soytas & Sari, 2009; Stern, 2004), especially in the United States (Soytas et al., 2007), in Turkey (Akbostanci et al., 2009), in India (Managi & Jena, 2008), and in the BRIC countries (Tamazian et al., 2009).

However, the empirical evidence remains mixed and is still in- conclusive to date because a higher national income does not necessarily warrant greater efforts to contain the emissions of pollutants.

Empirically, the effect of energy resource use on economic growth has been established through the analysis of causality between energy consumption and GDP. The majority of these studies reveal a causal relationship between energy resource use and growth, especially in OECD countries (Lee et al., 2008), in G7 countries (Narayan & Smyth, 2008), in African countries (Akinlo, 2008; Wolde-Rufael, 2009), in South America (Yoo & Kwak, 2010), in the Middle East (Al-Iriani, 2006;

Narayan & Smyth, 2009), in Asian countries (Chen et al., 2007;

Lee & Chang, 2008), in the Commonwealth of Independent States (Apergis & Payne, 2010), in European countries (Ciarreta

& Zarraga, 2010), in developing countries (Lee, 2005; Sari &

Soytas, 2007), and in developed and developing countries

(Chontanawat et al., 2008; Mahadevan & Asafu-Adjaye, 2007;

(3)

Sharma, 2010). They find that economic growth exerts a causal influence on energy resource use in the long run, and energy resource use points to output growth in the short run. Though the general consensus of these studies is that there is a pos- itive correlation between economic growth and energy resource use, some results have been mixed. For example, Huang, Hwang, and Yang (2008) and Costantini and Martini (2009) ar- gue that the causal relationship between economic growth and energy consumption is mixed depending on the functional form adopted and the sample of countries analyzed.

More recently, some researchers have examined the time-ser- ies dynamics between income and CO2 emissions to infer the direction of causality. This question has been formulated in terms of causality and different econometric techniques have been used to examine the possible causal linkages between these two variables, for example, for the Commonwealth of Independent States (Apergis & Payne, 2010), for a panel of 109 countries (Lee & Lee, 2009), for a panel of 43 developing coun- tries (Narayan & Narayan, 2010), and in developed countries (Coondoo & Dinda, 2002). However, the empirical results of the relationship between economic growth and CO2 emissions are mixed.

In this regard, many researchers employ a combined ap- proach by examining the dynamic relationships between eco- nomic growth, energy resource use, and CO2emissions together, especially in the EU (Keppler & Mansanet-Bataller, 2010), in Asian-Pacific countries (Niu et al., 2011), in the BRIC countries (Pao & Tsai, 2010), in France (Ang, 2007), in India (Ghosh, 2010), and in China (Zhang & Cheng, 2009). They find that economic growth is closely related to CO2 emissions, especially in the recent decade in emerging economies. The results of those studies show that there are different causal links between economic growth, energy resource use, and CO2emissions at different stages of economic development (Dinda & Coondoo, 2006; Soytas & Sari, 2009). In sum, it is expected that higher economic growth may require greater energy resource use and thus result in high CO2emissions. Given all these existing find- ings, the following hypothesis is considered:

Hypothesis 1: Economic growth is related to CO2 emissions.

2.2. Information Communications Technology, Economic Growth and CO2 Emissions

Economic growth reflects the ability of a nation to produce more goods and services. The use of information communica- tions technology infrastructure enables goods and services to be produced and provided more efficiently and rapidly (Lam & Shiu, 2010). The information communications technology infrastructure provides a framework for the efficient delivery of goods, im- proves communications between firms, and spreads to other in-

dustries, thereby contributing to overall economic growth (Koutroumpis, 2009). They ease in the trade of goods and serv- ices and the creation of new businesses and jobs (Arvanitis &

Loukis, 2009; Carayannis & Popescu, 2005). Hence, the devel- opment of information communications technology in many coun- tries continues to attract the interest of their governments in view of its potential to contribute to economic growth.

There has been a considerable amount of empirical work on the economic impact of the information communications technol- ogy sector on overall economic growth. The broad conclusion of these studies is that a positive and significant link exists be- tween the information communications technology sector and economic growth on the country level. For example, many stud- ies have reported that the information communications technol- ogy sector is one of the main drivers of better economic growth or sustainable growth (Daveri & Silva, 2004; Lipsey & Carlaw, 2004) and higher productivity (Laursen, 2004; Plepys, 2002).

Thompson and Garbacz (2007) reported that the development of information communications technology has a significant positive impact on productivity growth for the world as a whole by im- proving the efficiency of how it and other resources are used.

Many studies have reported that information communications technology development plays an important role in regional eco- nomic growth, in particular, in industrialized countries (Colecchia

& Schreyer, 2002; Dutta, 2001; Oliner & Sichel, 2000), in the United States (Cronin et al., 1993; Cronin et al., 1991;

Wolde-Rufael, 2007) and in South Korea (Yoo & Kwak, 2004).

They find that although causality is generally in both directions, the information communications technology sector more strongly precedes the economic growth of the nation. To conclude, this study expects that the information communications technology sector will play an important role in economic growth.

The relationship between economic growth, information com-

munications technology, and energy resource use can be jointly

determined because higher economic growth and information

communications technology development require more energy re-

source use. Moreover, the relationship between energy resource

use with the particular sectors of the economy and environ-

mental degradation has not gained much attention. The in-

formation communications technology sector is one of them. So

far, there is no systematic time series that analyzes the relation-

ship between the information communications technology sector,

CO2 emissions and economic growth. The development of in-

formation communications technology infrastructure and the use

of information communications technology products can contrib-

ute to economic growth while leading to an increase in energy

resource use resulting in higher CO2 emissions. For example,

the increased use of information communications technology

products and the development of information communications

technology infrastructure result in higher demand for energy at

(4)

various functions which leads to environmental degradation.

Furthermore, an investigation of the relationship between the in- formation communications technology sector, energy resource use, and environmental degradation should be of interest to both policy makers and practitioners. Hence, the following hy- potheses are formulated:

Hypothesis 2: The growth of the information communications technology sector leads to economic growth.

Hypothesis 3: The growth of the information communications technology sector is related to an increase in CO2 emissions.

2.3. Product Distribution, Resources Use and Environmental Issues

Product distribution is the process of making a product or service available for use or consumption by a consumer or business user. Wholesale and retail distribution remains the most significant channel to the market for manufacturers and the most important supply chain for customers. Thus, supply chain management usually takes into consideration issues of minimizing end cost, efficient logistical aspects, and timely deliv- ery of goods (Cox, 1999). At the beginning of the twenty-first century, however, a shift in focus has been observed. For ex- ample, business chain partners were formed to participate in im- plementing environmentally friendly practices that reduce waste and pollution. Terms such as green or environmental purchasing (Min and Galle, 1997; Walton et al., 1998), green value chain practices (Handheld et al., 1997), spectrum of environmental management programs (Beckman et al., 2001), and green sup- ply (Bowen et al., 2001) are used to characterize environmental aspects of supplier arrangements; all of these implicitly or ex- plicitly focus on improved environmental performance through better supply chain management.

A number of authors have recognized the link between envi- ronmental management issues and supply chains (Corbett &

Klassen, 2006; Khoo et al., 2002). Lamming and Hampson (1996) draw parallels between environmental management practi- ces and supply chain management practices. Hall (2002) argues that there are elements such as product and operational life- cycles, which relate to supply chain and environmental issues.

Green et al. (1996) argue that green supply, the way in which innovations in supply chain management and industrial purchas- ing can be considered in the context of the environment, has greater potential to address environmental concerns than any other operational functions. Bowen et al. (2001) find that supply management capabilities impact on product-based initiatives di- rected toward improving environmental performance. Green et al.

(1998) stress the influence that service firms, particularly in the retail sector, can exert on the environmental practices of

manufacturers.

In a similar vein, Florida and Davison (2001) argue that close relationships across the production chain facilitate the adoption of advanced manufacturing practices, creating new opportunities for joint improvements in productivity and environmental outcomes. Hampson and Johnson (1996) argue that environ- mental issues can be related to overall business efficiency.

They also note that interest in environmental supply chains is based on increased awareness of environmental issues, the in- creasingly strategic importance of purchasing and trends toward cooperation and partnership approaches between customers and suppliers. In sum, an investigation of the relationship between the growth of the product distribution sector, economic growth, and environmental degradation should be of interest to both pol- icy makers and practitioners. Hence, the following hypotheses are formulated:

Hypothesis 4: The growth of the product distribution sector results in an increase in CO2 emissions.

Hypothesis 5: There is a long-run equilibrium relationship be- tween the information communications technol- ogy sector, the product distribution sector, eco- nomic growth and CO2 emissions.

3. Data

This section describes data and outlines the methodology used in the development or selection of indicators and the nor- malization of data.

CO2. CO2 emissions are those stemming from the burning of fossil fuels and the manufacture of cement. They include carbon dioxide produced during consumption of solid, liquid and gas fuels and gas flaring. The data used in the model are pre- sented on a quarterly basis, transformed from the annual data reported by International Energy Agency.

GDP. GDP is used to measure economic growth. GDP repre- sents gross domestic product at market prices. These statistics are collected and published quarterly by the Bank of Korea.

Information Communications Technology. Information communi- cations technology represents the economic output of information communications technology industry at market prices, including communication and publishing, broadcasting, film and information services. These statistics are collected and published quarterly by the Bank of Korea.

Product Distribution. Product distribution represents the eco- nomic output of the product distribution sector at market prices, including the wholesale and retail trade, restaurants and hotels, transport and storage. These statistics are collected and pub- lished quarterly by the Bank of Korea.

All these three economic series data are collected and re-

(5)

trieved from the Bank of Korea Economic Statistics System (http://ecos.bok.or.kr/) database published by the Bank of Korea.

The sample is restricted to those periods for which quarterly da- ta are available, from the first quarter of 1970 to the third quar- ter of 2010 (163 observations). Normalization of the data is nec- essary before any aggregation can be made. It is important to transform the values to the same unit of measurement as CO2 emissions are expressed as metric tons whereas the other in- dicators are expressed as billion Korean won. Therefore, trans- formation into a natural log mitigates possible distortions of the dynamic properties of the series. Table 1 displays descriptive statistics along with various summary statistics for the time series. Table 2 displays the results of Pearson correlation analy- sis among the time series.

<Table 1> Descriptive Statistics of Sample Series

GDP CO2² Distribution ICT¹

Mean 108,307 65.5 9,103 3,091

Median 91,567 57.3 8,718 1,124

Maximum 262,433 128.8 19,164 11,292

Minimum 12,807 13.1 1,305 51

Std. Dev. 77,069 39.8 5,606 3,613

Observations 163 163 163 163

¹ ICT refers information communications technology

² CO2 is in million metric tons. All units are in billion Korean won.

<Table 2> Results of Pearson Correlation Analysis

GDP CO2 Distribution ICT¹

GDP 1.000

CO2 0.984*** 1.000

Distribution 0.991*** 0.992*** 1.000

ICT¹ 0.992*** 0.922*** 0.928*** 1.000

¹ ICT refers to information communications technology

***, p-value < 0.01 Correlation is significant at the 0.01 level (2-tailed).

4. Methodology 4.1. Unit Root Test

It is recognized in the literature that the data generating proc- ess for many economic variables is characterized by stochastic

trends that might result in spurious inference if the time series properties are not carefully investigated. A time series is said to be stationary if the auto covariances of the series do not depend on time. The formal method for testing the stationarity of a series is the unit root test. There are several well-known tests for this purpose based on individual time series. They are the augmented Dickey-Fuller (1979), Phillips-Perron (1988), GLS-detrended Dickey-Fuller (Elliot et al., 1996), Elliott-Rothenberg-Stock's Point Optimal (Elliot et al., 1996), and Ng and Perron's (2001) unit root tests. The unit root tests described above test the null hypoth - esis: a series has a unit root (non-stationary). Kwiatkowski et al.

(1992) propose a different approach from the unit root tests de- scribed above in that the series is assumed to be stationary un- der the null hypothesis.

Table 3 reports the results of unit root tests. All the test equations were tested by the least squares method. The auto- matic lag length selection was based on the Schwarz in- formation criterion and the optimal lag in the tests was auto- matically selected based on the Schwarz information criterion.

The bandwidth for the tests was selected based on the Newey–

West (1994) estimator using the Bartlett kernel function. The null hypothesis of a unit root cannot be rejected in the level of the series, but all null hypotheses of a unit root are rejected in the first difference of the series. The results in Table 3 confirm that all series are integrated in the order of one.

<Table 3> Results of Unit Root Test

Methods GDP(0) CO2(0) Distribution(0) ICT(0) GDP(1) CO2(1) Distribution(1) ICT(1) ADF test

-2.206 -2.513 -1.574 -2.457

-3.576*** -4.727*** -4.872*** -3.931***

-2.379 -2.254 -2.508 -2.453

PP test -48.222*** -14.564*** -23.498*** -16.560***

0.823 1.125 1.791 0.795

DF-GLS -2.481** -3.665*** -0.077*** -3.566***

3.764 3.830 3.243 6.543

NP test -2.632** -5.853*** -2.280** -4.896***

1.571*** 1.549*** 1.576*** 1.576***

KPSS test¹ 0.331 0.313 0.347 0.336

Note: In the ADF, PP and DF-GLS tests, probability values for

rejection of the null hypothesis of a unit root are employed

based on MacKinnon (1996) one-sided p-values. In the NP

test, probability values for rejection of the null hypothesis are

based on the Ng and Perron (2001) p-values. ¹In the KPSS

test, probability values for rejection of the null hypothesis are

based on Kwiatkowski, Phillips, Schmidt and Shin (1992) LM

statistic p-values (***, p-value < 0.01 and **, p-value < 0.05).

(6)

4.2. Cointegration Test

Engle and Granger (1987) point out that a linear combination of two or more non-stationary series may be stationary. If such a stationary linear combination exists, the non-stationary time series are said to be cointegrated. The stationary linear combi- nation is called the cointegrating equation and may be in- terpreted as a long-run equilibrium relationship among the variables. There are several tools for testing for the presence of cointegrating relationships among non-stationary variables in a multivariate setting. They are the Johansen (1991) cointegration test, and the Engle-Granger (1987) and Phillips-Ouliaris (1990) residual-based cointegration tests.

The Engle-Granger and Phillips-Ouliaris tests obtain only sin- gle cointegration relationship based on ordinary least squares, whereas it is possible to obtain more than one cointegration re- lationship with the Johansen test, which is a maximum like- lihood-based test. The Johansen procedure uses two ratio tests, a trace test and a maximum eigenvalue test, totest the number of cointegration relationships. Both can be used to determine the number of cointegrating vectors present, although they do not always indicate the same number of cointegrating vectors. If trace statistics and maximum eigenvalue statistics yield different results, the result of the maximum eigenvalue test is preferred because of the benefit of carrying out separate tests on each eigenvalue.

Table 4. Results of Johansen Cointegration Test Number of

cointegration (r) Trace statistic Maximum eigenvalue statistic

r = 0 74.507*** 34.790***

r ≤ 1 39.716*** 26.345***

r ≤ 2 13.371 8.515

r ≤ 3 2.855 2.855

Note: The probability value for rejection of the null hypothesis of no cointegration is based on the MacKinnon-Haug-Michelis (1999) p-values (***, p-value < 0.01 and **, p-value < 0.05).

Table 4 reports the results of the Johansen cointegration test.

For the Johansen cointegration test, the assumptions of co- integration tests allow for individual effects but no individual line- ar trends in vector autoregression. The results in Table 4 find that the trace statistic and the maximum eigenvalue statistic are larger than the critical values; the trace test indicates at least two cointegrating vectors at the 0.01 level and the maximum ei- genvalue test also indicates at least two cointegrating vectors at the 0.01 level. The results indicate that there exist at least two

cointegrating equations among the variables at the 0.01 level.

The results indicate that there exists a long-run equilibrium rela- tionship among the variables. Therefore, Hypothesis 5 that there is a long-run equilibrium relationship between the information communications technology sector, the product distribution sec- tor, CO2 emissions and economic growth is supported.

4.3. Granger Causality Test

The conventional modeling techniques for testing the direction of Granger causality in a multivariate setting employ vector au- toregressive and vector error correction models. Engle and Granger (1987) and Granger (1988) report that if two or more variables are cointegrated, there always exists a corresponding error correction representation in which the short-run dynamics of the variables in the system are influenced by the deviation from equilibrium. The vector error correction model is a techni- que that captures both the dynamic and the interdependent rela- tionships of regressors, and corrects a disequilibrium that may shock the whole system. The vector error correction model im- plies that changes in one variable are a function of the level of disequilibrium in the cointegrating relationship as well as changes in the other explanatory variables. Therefore, a vector error correction model can be constructed as shown in Equation 1 and 2.

(1)

(2) where t represents 1, 2, 3 , n observations; … Δ is the differ - ence operator; is the deterministic component (constant); , α β γ and θ are the parameters of regressors; is the error cor- rection term obtained from the cointegrating vectors.

The vector error correction model can distinguish between

short-run and long-run Granger causality because it can capture

both the short-run dynamics between the time series and their

long-run equilibrium relationship. The long-run causality is im-

plied through the significance of the t-statistics of the lagged er-

ror correction terms. The short-run Granger causality in the vec-

tor error correction model can be tested by the Wald test. The

Block exogeneity Wald test in the vector error correction system

(7)

provides Chi-squared statistics of coefficients on the lagged en- dogenous variables, which are used to interpret the statistical significance of coefficients of the regressors. The hypothesis in this test is that lagged endogenous variables do not Granger-cause the dependent variable.

Table 5 reports the results of Granger causality tests using vector error correction models. In Table 5, the numeric values in the cells are the coefficients of the regressors, which represent the short-run elasticity, and are followed by standard errors in parenthesis, which are used to interpret the statistical sig- nificance of the parameters. In testing Hypothesis 1 that eco- nomic growth is related to an increase in CO2emissions, Table 5 shows that this is supported and statistically significant at the 0.05 level. The results indicate that there exists an inverse rela- tionship between CO2 emissions and economic growth. For ex- ample, a 1% increase in CO2emissions contributes to economic growth by -0.377% whereas economic growth only marginally af- fects an increase in CO2 emissions. This finding confirms the environmental Kuznets inverted U-curve hypothesis that when rising incomes pass beyond a turning point environmental pollu- tion levels begin to decline as higher national income warrants greater efforts to contain the emissions of pollutants. It appears that South Korea might have been on the right path to environ- mental sustainability while continuing sustainable economic growth.

In testing Hypothesis 2 and 3, i.e. whether there is a causal relationship from the information communications technology sec- tor to economic growth and CO2 emissions, Table 5 shows that the information communications technology sector has a positive relation with economic growth but an insignificant impact on the increase in CO2 emissions. It suggests that a 1%increase in the information communications technology sector increases eco- nomic growth by 0.136% and contributes to CO2 emissions by -0.003%. It appears that the information communications technol- ogy sector might have been on the right path to environmental sustainability while continuing sustainable growth of the sector.

Hypothesis 4 testing whether there is a causal relationship from the growth of the product distribution sector to CO2 emis- sions is supported and statistically significant at the 0.01 level.

Table 5 shows that the growth of the product distribution sector has a positive effect on economic growth but an inverse relation with CO2emissions. It suggests that a 1% increase in the prod- uct distribution sector output increases economic growth by 0.486% and contributes to CO2 emissions by -0.134%. It ap- pears that the production distribution sector might have been on the right path to environmental sustainability while reasonably managing environmental sustainability and the green growth initiative.

<Table 5> Results of Granger Causality Test

5. Discussion and Policy Implications

The results of this study show that the product distribution sector (including wholesale and retail distributors, transport and storage operators) in South Korea is a leader in using in- formation technology to reduce low value-added labor activities and at the same time improving clean low-carbon supply chain activities. There are a variety of information communications technology-enabled distribution solutions, such as cutting-edge bar codes, point-of-sale systems, advanced data collection, ra- dio-frequency identification compliance systems, automated label- ing systems, and enterprise mobility computing technology. The build-out of cellular wide area networks across the country and the advances in mobile computing applications have moved route accounting and direct store delivery to the forefront of business practices. Combining leading edge technology such as wide area network cellular networking, global positioning systems and navigation solutions, as well as the software to centralize them all, information communications technology-enabled dis- tribution solutions help product distribution organizations to facili- tate more effective planning, scheduling and operation of their product distribution and transportation fleet. All these information communications technology-enabled distribution solutions help distributors to consolidate efficiencies across their entire supply chain by empowering their partners with accurate and real-time data. This improves productivity while reducing unnecessary ex- penses, giving the distributors the edge they need to stay ahead of the competition. This may have considerable bearing on why productivity improvement in production distribution has consistently exceeded the overall business sector in South Korea.

The information communications technology sector lends itself

"X"/ "Y" GDP CO2 Long-run

dynamics ECT -0.090 (1.704) 0.129 (5.277)***

Short-run dynamics

GDP 0.144 (3.370)***

CO2 -0.377 (2.176)**

Distribution 0.486 (7.653)*** -0.134 (4.565)***

ICT 0.136 (1.803)* -0.003 (0.101)

Adjusted R-squared 0.668 0.300

F-statistic 65.608 14.772

Note: The probability value for rejection of the null hypothesis is employed at the 0.05 level (***, p-value < 0.01; **, p-value <

0.05; and *, p-value < 0.10).

(8)

to new models of profitable services so businesses will find it lucrative to innovate in this space. The green use of information communications technology, coupled with innovative business models and progressive policy making, will play a critical role in the reduction of CO2emissions. The offerings of information communications technology may address environmental sustain- ability concerns in ways that can also be aligned with social and economic goals. There is a growing role for information communications technology in the pursuit of green goals be- cause the government and local authorities are increasingly ex- pected to focus on environmental sustainability and green growth. The roles of information communications technology can facilitate smart information management and lead to the creation of new services that benefit companies, society and the government. As an important contributor to the sustainable growth of South Korea, the information communications technol- ogy sector seems to have played a leading role in fostering en- vironmental and economic sustainability both within its own sec- tor and as an industry wide infrastructure. The information com- munications technology sector in South Korea would be an im- portant enabler of sustainable and green growth in such a context. Its unique function as a key element of infrastructure for efficient industries and a critical productivity enhancer is cru- cial for sustaining growth and laying foundations for the econo- my that should be competitive in the long term.

Green growth is a term to describe a path of economic growth that uses natural resources in a sustainable manner, and makes a cleaner low-carbon economy compatible with growth. It can be used globally to provide an updated concept of sustain- able development. The challenges of sustainable development have convinced many countries that a different kind of economic growth is needed. In response, many governments are putting in place measures aimed at green growth. Together with in- novation, going green can be a long term driver for economic growth: for example, investing in renewable energy, improved ef- ficiency in the use of energy and materials, and improved pro- ductivity of industrial sectors. According to a publication of the Organisation for Economic Co-operation and Development (2011), a green growth strategy is centered on mutually reinforc- ing aspects of economic and environmental policy. It takes into account the full value of natural capital as a factor of production and its role in growth. It focuses on cost-effective ways of at- tenuating environmental pressures to effect a transition toward new patterns of growth that will avoid crossing critical local, re- gional and global environmental thresholds. Innovation and in- formation communications technology will play key roles in the path.

In the meantime, in business today, companies cannot ignore environmental issues. Increasing government regulation and stronger public mandates for environmental accountability have

brought these issues into the executive suite and onto strategic planning agendas. At the same time, companies are integrating their supply chain processes to lower costs and better serve customers. These two trends are not independent; companies must involve suppliers and purchasers to meet and even ex- ceed the environmental expectations of their customers and their government. Two additional themes which emerge from this re- search are the importance of the industry’s commitment to envi- ronmental friendly supply chains, and the need to move beyond environmental compliance to achieve a proactive environ- ment-friendly supply chain. This is a natural outgrowth of in- dustrial ecology, with its holistic view of material and energy flows and the concomitant aim to reduce the environmental im- pact of products from cradle to grave.

The discussion above implies that actors and actor coalitions are important and that there is increasing evidence of multi level patterns of governance and industry-wide networks of influence on environmental issues. Green growth strategies need to en- courage greener behavior by firms and consumers, facilitate smooth and just reallocation of jobs, capital and technology to- ward greener activities and provide adequate incentives and support to green innovation. Misguided government policies, market constraints and distortions all lead to or arise from mar- ket failures, which means there is often a gap between private returns from economic activity and the overall benefits that ac- crue to society. Green growth policies should aim to close that gap and raise returns on green investment and innovation. They must also aim to minimize the distributional consequences of change for the least advantaged groups of society and manage any negative economic impacts on firms while retaining in- centives for improved economic performance. Emphasis should be placed on sectors with high potential for green job creation or employment that contributes to protecting and preserving the environment. It is critical to identifying how these activities can accelerate the transition to green growth.

From a policy viewpoint, governments must design strategies that will allow the nations to move from their present processes of growth and development onto sustainable development paths.

This will require policy changes in many countries, with respect

both to their own development and to their impacts on other na-

tions’development possibilities. Therefore, critical objectives for

environment and development policies that follow the concept of

sustainable development include reviving growth, changing the

quality of growth, and integrating the environment and econom-

ics into decision making. Of course, countries will take different

approaches in designing policies to shift to a green economy,

depending on their policy settings and institutions, level of de-

velopment and resource endowments, and the particular environ-

mental challenges they face. A common consideration must en-

sure that green economy measures are cost-effective and pro-

(9)

mote new ways of addressing environmental problems through innovation.

Alongside the wide range of measures to promote the tran- sition to a green economy, some countries have used market mechanisms such as taxes and trad able permit schemes to put a price on pollution or overexploitation of natural resources.

These instruments have helped guide consumers and producers toward decisions that result in less pollution or at least slower depletion of natural resources. They have also given firms in- centives to find innovative ways of tackling environmental challenges. Some countries have also relied on environmental requirements to improve the efficiency of resource use and to reduce pollutants by setting technical specifications to improve energy efficiency or emission performance. Many countries have relied on government support to foster innovation and the de- ployment of green technologies. Green economy measures such as those that foster a low carbon economy or promote green consumers and producers could be used as an accelerator to ensure that open trade continues to support the efforts to bring about a green economy.

Recognizing the difficulty and limitations of trying to directly control their domestic economies in an increasingly open and globalized economy, governments may try to pursue economic growth through strategic policies. These policies are designed to increase access to foreign markets, encourage foreign invest- ment inflows and maintain national competitiveness. In this re- spect, economic growth is often associated with specialization in a few sectors with high CO2emissions per unit of output such as the manufacturing and heavy industries. As a consequence, as the economy expands, demand for and supply of energy and of energy-intensive goods also increases, pushing up CO2emissions. Therefore, new policies must be different from those pursued in the past as they not only have to lead to high growth rates but must also lead to sustained employment gen- eration and structural changes in the industries of the economy.

In order to implement such an approach, empirical analyses are needed to estimate future associated emissions and the current and future mitigation potential of development actions. This would provide an initial guide for ranking sustainable develop- ment actions. Policy makers can then weigh the emissions re- duction potential against other sustainability aspects of the ac- tion in choosing the appropriate policy to implement.

6. Conclusions

This study investigated a long-run equilibrium relationship and Granger causality between the information communications tech- nology sector, the production distribution sector, CO2 emissions and economic growth in South Korea. The results indicate that

both the information communications technology and production distribution sectors have played a leading role in fostering envi- ronmental and economic sustainability both within their own sec- tor and within the overall economy of South Korea and at the same time acted as an important contributor to the green growth of the economy. On the other hand, economic growth may drive technological change, increase efficiency and foster the development of institutions and preferences more conducive to environmental protection and emissions mitigation. Comparing the trends in the efficiency of energy use by the information communications technology sector and the efficiency of in- formation communications technology use by the product dis- tribution sector and CO2 emission change per unit GDP in South Korea, this study demonstrates the importance of techno- logical progress in terms of energy saving and CO2 emission reduction, thereby enabling useful policy decisions for green growth.

The results of this study should be interpreted with caution as only two selected industries are included in the model and data for only a single country are investigated. Work to date suggests that environmental and resource productivity has been rising, although there are significant differences between industries. Growth of GDP and other measures of output tend to outstrip the growth of environmental inputs into the production system. Improved environmental productivity, however, has not been accompanied by absolute decreases in environmental pres- sure or the sustainable use of certain natural assets. In this context, indicators that measure the green economy also need to be interpreted carefully. Judged simply by the size of the in- dustries involved in the production of cleaner low-carbon envi- ronmental goods and services, today’s green economy is rela- tively small. Economic opportunities, entrepreneurship and in- novation in conjunction with green growth can arise in all sec- tors, however, so an assessment based on green industries un- derstates the economic importance of environmentally related activities.

References

Akbostanci, E., Turut-Asik, S., & Tunc, G.I. (2009). The relation- ship between income and environment in Turkey: Is there an environmental Kuznets curve? Energy Policy, 37, 861 867. –

Akinlo, A.E. (2008). Energy consumption and economic growth:

Evidence from 11 African countries. Energy Economics, 30, 2391 2400. –

Al-Iriani, M. (2006). Energy GDP relationship revisited: An exam – -

ple from GCC countries using panel causality. Energy

Policy, 34, 3342 3350. –

(10)

Ang, J.B. (2007). CO

2

emissions, energy consumption, and out- put in France. Energy Policy, 35, 4772-4778.

Apergis, N., & Payne, J.E. (2009). Energy consumption and economic growth in Central America: Evidence from a panel cointegration and error correction model. Energy Economics, 31, 211 216. –

Apergis, N., & Payne, J.E. (2010). The emissions, energy con- sumption, and growth nexus: Evidence from the Commonwealth of Independent States. Energy Policy, 38, 650 655. –

Arvanitis, S., & Loukis, E.N. (2009). Information and communica- tion technologies, human capital, workplace organization and labour productivity: A comparative study based on firm-level data for Greece and Switzerland. Information Economics and Policy, 21, 43-61.

Beckman, S., Bercovitz, J., & Rosen, C. (2001). Environmentally sound supply chain management. In: Madu, C.N. (Ed.), Handbook of environmentally conscious manufacturing.

Kluwer Academic Publishers, Boston, MA, pp. 363-383.

Bowen, E., Cousins, P.D., Lamming, R.C., & Faruk, A.C. (2001).

The role of supply management capabilities in green supply. Production Operations Management, 10(2), 174-189.

Carayannis, E.G., & Popescu, D. (2005). Profiling a methodology for economic growth and convergence: learning from the EU e-procurement experience for central and eastern European countries. Technovation, 25, 1-14.

Chen, S.-T., Kuo, H.-I., & Chen, C.-C. (2007). The relationship between GDP and electricity consumption in 10 Asian countries. Energy Policy, 35, 2611-2621.

Chontanawat, J., Hunt, L.C., & Pierce, R. (2008). Does energy consumption cause economic growth: Evidence from sys- tematic study of over 100 countries. Journal of Policy Modeling, 30, 209 220. –

Ciarreta, A., & Zarraga, A. (2010). Economic growth-electricity consumption causality in 12 European countries: A dy- namic panel data approach. Energy Policy, 38, 3790-3796.

Colecchia, A., & Schreyer, P. (2002). ICT investment and eco- nomic growth in the 1990s: Is the United States a unique case? A comparative study of nine OECD countries. Review of Economic Dynamics, 5, 408-442.

Coondoo, D., & Dinda, S. (2002). Causality between income and emission: A country group specific econometric analysis. Ecological Economics, 40, 351-367.

Coondoo, D., & Dinda, S. (2008). The carbon dioxide emission and income: a temporal analysis of cross-country dis- tributional patterns. Ecological Economics, 65, 375 385. – Corbett, C.J., & Klassen, R.D. (2006). Extending the horizons:

Environmental excellence as key to improving operations.

Manufacturing & Service Operations Management, 8(1), 5-23.

Costantini, V., & Martini, C. (2009). The previous term causality next term between energy consumption and economic growth: A multi-sectoral analysis using non-stationary co- integrated panel data. Energy Economics, 32, 591 603. – Cox, A. (1999). Power, value and supply chain management.

International Journal of Supply Chain Management, 4(4), 167-175.

Cronin, F.J., Colleran, E.K., Herbert, P.L., & Lewitzky, S. (1993).

Telecommunications and growth: The contribution of tele- communications infrastructure investment to aggregate and sectoral productivity. Telecommunications Policy, 17, 677 690. –

Cronin, F.J., Parker, E.B., Colleran, E.K., & Gold, M.A. (1991).

Telecommunications infrastructure and economic growth.

An analysis of causality. Telecommunications Policy, 15, 529 535. –

Daveri, F., & Silva, O. (2004). Not only Nokia: what Finland tells us about new economy growth. Economic Policy, 19, 117-163.

Dickey, D.A., & Fuller, W.A. (1979). Distribution of the estima- tors for autoregressive time series with a unit root.

Journal of the American Statistical Association, 74, 427–

431.

Dinda, S., & Coondoo, D. (2006). Income and emission: A pan- el data-based cointegration analysis. Ecological Economics, 57, 167 181. –

Dinda, S. (2004). A theoretical basis for the environmental Kuznets curve. Ecological Economics, 53, 403 413. – Dutta, A. (2001). Telecommunications and economic activity: An

analysis of Granger causality. Journal of Management Information Systems, 17, 71 95. –

Elliott, G., Rothenberg, T.J., & Stock, J.H. (1996). Efficient tests for an autoregressive unit root. Econometrica, 64, 813-836.

Engle, R.F., & Granger, C.W.J. (1987). Cointegration and error correction: representation, estimation and testing.

Econometrica, 55, 251 276. –

Florida, R., & Davison, D. (2001). Gaining from green manage- ment: Environmental management systems inside and outside the factory. California Management Review, 43(3), 64-85.

Friedl, B., Getzner, M., 2003. Determinants of CO

2

emissions in a small open economy. Ecological Economics, 45, 133–

148.

Ghosh, S. (2010). Examining carbon emissions economic growth nexus for India: A multivariate cointegration approach.

Energy Policy, 38, 3008-3014.

Granger, C.W.J. (1988). Some recent developments in a con-

(11)

cept of causality. Journal of Econometrics, 39, 199 211. – Green, K., Morton, B., & New, S. (1996). Purchasing and envi-

ronmental management: Interactions, policies and opportunities. Business Strategy and the Environment, 5, 188-197.

Green, K., Morton, B., & New, S. (1998). Green purchasing and supply policies: Do they improve companies' environ- mental performance? Supply Chain Management, 3(2), 89-95.

Grossman, G.M., & Krueger, A.B. (1995). Economic growth and the environment. Quarterly Journal of Economics, 110, 353-377.

Hall, J. (2002). Environmental supply-chain innovation. Greener Management International, 35, 105-119.

Hampson, J., & Johnson, R. (1996). Environmental legislation and the supply chain. International Purchasing and Supply Education and Research Association, Eindhoven, the Netherlands.

Handheld, R.B., Walton, S.V., Seeger, L.K., Melnyk, S.A., 1997.

Green value chain practices in the furniture industry.

Journal of Operations Management, 15(4), 293-315.

Huang, B.-N., Hwang, M.-J., & Yang, C.-W. (2008). Causal rela- tionship between energy consumption and GDP growth revisited: A dynamic panel data approach. Ecological Economics, 67, 41 54. –

Johansen, S. (1991). Estimation and hypothesis testing of co- integration vectors in Gaussian vector autoregressive models. Econometrica, 59, 1551 1580. –

Keppler, J.H., & Mansanet-Bataller, M. (2010). Causalities be- tween CO

2

, electricity, and other energy variables during phase I and phase II of the EU ETS. Energy Policy, 38, 3329-3341.

Khoo, H. H., Spedding, T. A., Bainbridge, I., & Taplin, D.M.R.

(2002). Creating a green supply chain. Greener Management International, 35, 71-88.

Koutroumpis, P. (2009). The economic impact of broadband on growth: A simultaneous approach. Telecommunications Policy, 33, 471-485.

Kwiatkowski, D., Phillips, P.C.B., Schmidt, P., & Shin, Y.C.

(1992). Testing the null hypothesis of stationary against the alternative of a unit root. Journal of Econometrics, 54, 159-178.

Lam, P.-L., & Shiu, A. (2010). Economic growth, tele- communications development and productivity growth of the telecommunications sector: Evidence around the world. Telecommunications Policy, 34, 185-199.

Lamming, R., & Hampson, J. (1996). The environment as a supply chain management issue. British Journal of Management, 7, S45-S62.

Laursen, K. (2004). New and old economy: the role of ICT in

structural change and economic dynamics. Structural Change and Economic Dynamics, 15, 241-243.

Lee, C.-C., Chang, C.-P., & Chen, P.-F. (2008). Energy-income causality in OECD countries revisited: The key role of capital stock. Energy Economics, 30, 2359 2373. – Lee, C.-C., & Chang, C.-P. (2008). Energy consumption and

economic growth in Asian economies: A more compre- hensive analysis using panel data. Resources and Energy Economics, 30, 50 65. –

Lee, C.-C., & Lee, J.-D. (2009). Income and CO

2

emissions:

Evidence from panel unit root and cointegration tests.

Energy Policy, 37, 413 423. –

Lee, C.-C. (2005). Energy consumption and GDP in developing countries: A cointegrated panel analysis. Energy Economics, 27, 415 427. –

Lipsey, R.G., & Carlaw, K.I. (2004). Total factor productivity and the measurement of technological change. Canadian Journal of Economics, 37, 1118 -1150.

Luzzati, T., & Orsini, M. (2009). Natural environment and eco- nomic growth: Looking for the energy-EKC. Energy, 34, 291 300. –

Mackinnon, J.G. (1996). Numerical distribution functions for unit root and co-integration tests. Journal of Applied Econometrics, 11, 601-618.

Mackinnon, J.G., Haug, A.A., & Michelis, L. (1999). Numerical distribution functions of likelihood ratio tests for co-integration. Journal of Applied Econometrics, 14, 563-577.

Mahadevan, R., & Asafu-Adjaye, J. (2007). Energy con- sumption, economic growth and prices: A reassessment using panel VECM for developed and developing countries. Energy Policy, 35, 2481 2490. –

Managi, S., & Jena, P.R. (2008). Environmental productivity and Kuznets curve in India. Ecological Economics, 65, 432–

440.

Martinez-Zarzoso, I., & Bengochea-Morancho, A. (2004). Pooled mean group estimation of an environmental Kuznets curve for CO

2

. Economics Letters, 82, 121 126. –

Min, H., & Galle, W.P. (1997). Green purchasing strategies:

Trends and implications. International Journal of Purchasing Materials Management, 33(3), 10-17.

Narayan, P.K., & Narayan, S. (2010). Carbon dioxide emissions and economic growth: Panel data evidence from devel- oping countries. Energy Policy, 38, 661 666. –

Narayan, P.K., & Smyth, R. (2008). Energy consumption and GDP in G7 countries: New evidence from panel co- integration with structural breaks. Energy Economics, 30, 2331 2341. –

Narayan, P.K., & Smyth, R. (2009). Multivariate granger cau-

sality between electricity consumption, exports and GDP:

(12)

Evidence from a panel of Middle Eastern countries.

Energy Policy, 37, 229-236.

Newey, W., & West, K. (1994). Automatic lag selection in co- variance matrix estimation. Review of Economic Studies, 61, 631-653.

Ng, S., & Perron, P. (2001). Lag length selection and the con- struction of unit root tests with good size and power.

Econometrica, 69, 1519-1554.

Niu, S., Ding, Y., Niu, Y., Li, Y., & Luo, G. (2011). Economic growth, energy conservation and emissions reduction: A comparative analysis based on panel data for 8 Asian-Pacific countries. Energy Policy, 39, 2121-2131.

Oliner, S.D., & Sichel, D. (2000). The resurgence of growth in the late 1990s: Is information technology the story?

Journal of Economic Perspectives, 14, 3 22. –

Organisation for Economic Co-operation and Development (2011). Towards green growth. Paris, France.

Pao, H.-T., & Tsai, C.-M. (2010). CO

2

emissions, energy con- sumption and economic growth in BRIC countries.

Energy Policy, 38, 7850-7860.

Phillips, P., & Perron, P. (1988). Testing for a unit root in time series regression. Biometrica, 75, 335 346. –

Phillips, P.C.B., & Ouliaris, S. (1990). Asymptotic properties of residual based tests for cointegration. Econometrica, 58, 165 193. –

Plepys, A., 2002. Sustainability in the Information Society: The grey side of ICT. Environmental Impact Assessment Review, 22, 509-523.

Sari, R., & Soytas, U. (2007). The growth of income and energy consumption in six developing countries. Energy Policy, 35, 889 898. –

Sharma, S. S. (2010). The relationship between energy and economic growth: Empirical evidence from 66 countries.

Applied Energy, 87, 3565 3574. –

Soytas, U., & Sari, R. (2009). Energy consumption, economic growth, and carbon emissions: Challenges faced by an EU candidate member. Ecological Economics, 68, 1667–

1675.

Soytas, U., Sari, R., & Ewing, B.T. (2007). Energy consumption, income, and carbon emissions in the United States.

Ecological Economics, 62, 482 489. –

Squalli, J. (2007). Electricity consumption and economic growth:

bounds and causality analyses for OPEC members.

Energy Economics, 29, 1192 1205. –

Stern, D.I. (2004). The rise and fall of the environmental Kuznets curve. World Development, 32, 1419 1439. – Tamazian, A., Chousa, J.P., & Vadlamannati, C. (2009). Does

higher economic and financial development lead to envi- ronmental degradation: Evidence from the BRIC countries. Energy Policy, 37, 246 253. –

Thompson Jr., H.G., & Garbacz, C. (2007). Mobile, fixed line and Internet service effects on global productive efficiency. Information Economics and Policy, 19, 189-214.

Walton, S.V., Handheld, R.B., & Melnyk, S.A. (1998). The green supply chain: Integrating suppliers into environmental management processes. International Journal of Purchasing Materials Management, 34(2), 2-11.

Wolde-Rufael, Y. (2007). Another look at the relationship be- tween telecommunications investment and economic ac- tivity in the United States. International Economic Journal, 21, 199 205. –

Wolde-Rufael, Y. (2009). Energy consumption and economic growth: The experience of African countries revisited.

Energy Economics, 31, 217 224. –

Yoo, S.-H., & Kwak, S.-J. (2004). Information technology and economic development in Korea: A causality study.

International Journal of Technology Management, 27, 57 67.

Yoo, S.-H., & Kwak, S.-Y. (2010). Electricity consumption and economic growth in seven South American countries.

Energy Policy, 38, 181-188.

Zhang, X.-P., & Cheng, X.-M. (2009). Energy consumption, car- bon emissions, and economic growth in China.

Ecological Economics, 68, 2706-2712.

Web References

Boden, T.A., Marland, G., & Andres, R.J. (2011). Global, region- al, and national fossil-fuel CO

2

emissions. Carbon Dioxide Information Analysis Center, Oak Ridge, TN. doi 10.3334/CDIAC/00001_V2011.

Reuters News (2011, June 15). South Korea’s CO

2

trade bill re-

ceives bipartisan backing. Copy in possession of Ju-Min

Park and Mee-Young Cho, Seoul, South Korea.

수치

Table 3 reports the results of unit root tests. All the test equations were tested by the least squares method
Table 4. Results of Johansen Cointegration Test Number of
Table 5 reports the results of Granger causality tests using vector error correction models

참조

관련 문서

Fourth, as the information technology is developed due to the fourth industrial revolution and the proportion of information technology in the commercial

• Select one of the elemental technologies of Smart City and describe the current level of this technology, the direction of future technology development, and the urban space to

The result of empirical analysis and case studies imply that the demand for the technology may change with the technological field and technology life-cycle. Originality

adio Frequency Identification Tech- nology (RFID) is the state-of-the-art information and communication tech- nology(ICT) that uses radio waves for

Common corporate digital crimes include piracy, financial fraud, espionage, and theft of services.. _______________________________________ such as

Ministry of Economic Affairs, R.O.C. Innovation and Incubation Center, National Kaohsiung University of Science and Technology 、 Institute For Information

It considers the energy use of the different components that are involved in the distribution and viewing of video content: data centres and content delivery networks

1 John Owen, Justification by Faith Alone, in The Works of John Owen, ed. John Bolt, trans. Scott Clark, &#34;Do This and Live: Christ's Active Obedience as the