Print ISSN: 2288-4637 / Online ISSN 2288-4645 doi:10.13106/jafeb.2021.vol8.no1.071
Static or Dynamic Capital Structure Policy Behavior: Empirical Evidence from Indonesia
Elok Sri UTAMI
1, Tatang Ary GUMANTI
2, Bambang SUBROTO
3, Umrotul KHASANAH
4Received: September 30, 2020 Revised: November 22, 2020 Accepted: December 05, 2020
Abstract
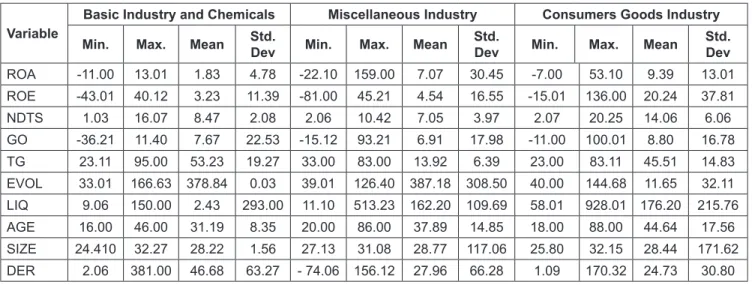
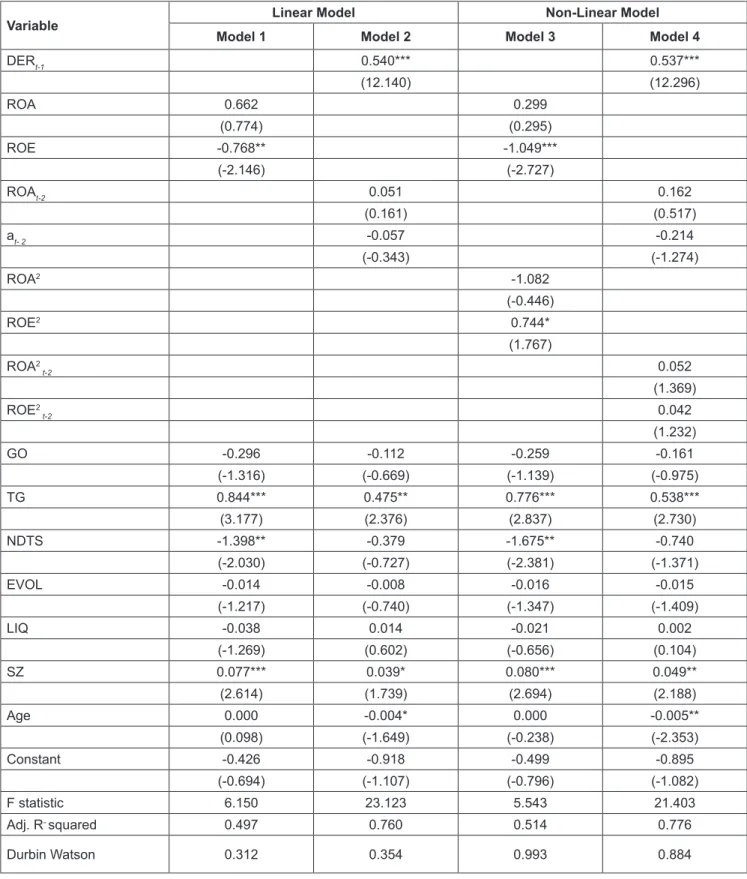
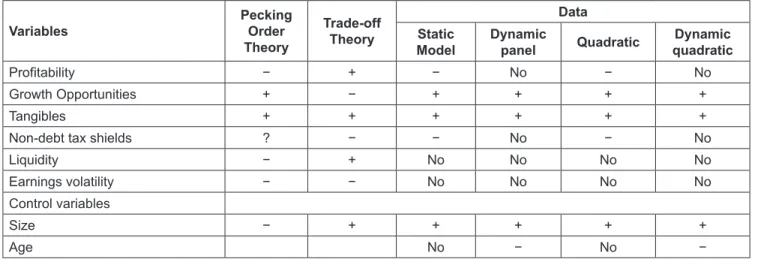
This study investigates the capital structure policy among Indonesian public companies. Previous studies suggest that capital structure policy could follow either static or dynamic behavior. The sample data used in this study was companies in the manufacturing sector, divided into three sub-sectors: the basic and chemical industry, miscellaneous industry, and the consumer goods industry. This study uses panel data from 2010 to 2018, with the Generalized Least Square (GLS) method and compared whether the fixed effect model is better than the common effect model. The results show that the dynamic and non-linear model tests can explain the capital structure determinants than the static and linear models. The dynamic model shows that the capital structure of a certain year is influenced by the capital structure of the previous year. The findings indicate that the company performs some adjustments in its capital structure policy by referring to the previous debt ratio, which implies support to the trade-off theory (TOT). The study also shows that profitability, tangible assets, size, and age explain the variation of capital structure policy. The patterns on the dynamic and non-linear confirm that capital structure runs in a non- linear pattern, based on the sector, company condition, and the dynamic environment.
Keywords: Capital Structure, Static, Dynamic, Linear, Non-Linear JEL Classification Code: G30, G32, O16
value while minimizing its capital cost. The source of funding can be fulfilled from the internal source such as retained earnings and external sources in the form of debt and equity. Each of the funding sources causes burdens, where the retained earnings and equity burdens are equal to the opportunity costs while the debts cause burdens in the form of interest which can be protected by tax saving. The literature suggests that two major theories explain the capital structure - the pecking order theory (POT) and the trade-off theory (TOT).
POT states that the cost of financing increases with asymmetric information. This theory states that a company should finance itself first internally through ‘retained earnings’. If this source of financing is unavailable, a company should then finance itself through ‘debt’. Finally, and as a last resort, a company should finance itself through the ‘issuing of new equity’ (Myers & Majluf, 1984). TOT states that the company chooses its source of funding based on the targeted capital structure or optimum capital structure, by balancing the benefit and risk. That is, the TOT of capital structure is the idea that a company chooses how much debt finance and how much equity finance to use by balancing the costs and benefits. Therefore the company will consciously
1
First Author and Corresponding Author. Associate Professor, Department of Management, Faculty of Economics and Business, Universitas Jember, Indonesia [Postal Address: Kampus Tegalboto, Jl. Kalimantan No.37, Kabupaten Jember, Jawa Timur 68121, Indonesia] Email: [email protected]
2
Professor, Department of Management, Faculty of Economics and Business, Universitas Bhayangkara Jakarta Raya, Indonesia.
Email: [email protected]
3
Professor, Department of Accounting, Faculty of Economics and Business, Universitas Brawijaya, Indonesia. Email: [email protected]
4
Associate Professor, Department of Management, Faculty of Economics, Universitas Islam Negeri (UIN) Maulana Malik Ibrahim Malang, Indonesia. Email: [email protected]
© Copyright: The Author(s)
This is an Open Access article distributed under the terms of the Creative Commons Attribution Non-Commercial License (https://creativecommons.org/licenses/by-nc/4.0/) which permits unrestricted non-commercial use, distribution, and reproduction in any medium, provided the original work is properly cited.
1. Introduction
Funding policy or often called capital structure policy plays an important role in creating company value and determining the long-term debt composition and equity. The
‘optimal capital structure’ of a firm is the best combination
of debt and equity financing that maximizes a firm’s market
maintain the optimum capital structure which can maximize the company value.
Since the mid-’90s, there have been many studies testing the leverage determinants with a proxy for leverage, such as the influence of profitability, liquidity, collateral in the form of fixed assets, growth probability, tax, and risk factors (income volatility). Other determinants are treated as control variables since this factor can also trigger the fixed cost (FC) and the macro-economic factor which can also be considered within the funding policy.
Previous studies examining capital structure show inconsistent results either in developed or developing countries. There have been several studies conducted on the capital structure that considered the influence of different factors such as management, industrial dynamics, capital market condition, economy, government regulation, and social trend on the capital structure of a company. Based on previous related studies, this study tries to re-test the capital structure determinants by focusing on companies in the manufacturing sector in Indonesia. This sector plays an important role in driving economic development in Indonesia because it has the maximum number of companies listed on the Indonesian Stock Exchange (IDX) and is the biggest contribution to the GDP and income tax in Indonesia.
As per the report of the United Nations Statistics Division (UNSD), the Indonesian manufacturing sector was placed fourth among 15 countries in the world and contributed to more than 10 percent of Gross Domestic Product (GDP) in the year 2016. GDP is the standard measure of the value- added created through the production of goods and services in a country during a certain period. Indonesia contributed 22 percent of the country’s GDP after South Korea with 29 percent, China 27 percent, and Germany 23 percent.
However, in 2018 there was a decline in the manufacturing sector’s contribution to GDP from 22 percent to 19.86 percent or IDR 2,950 trillion (www.kemenperin.go.id).
Besides being the biggest contributor to the national GDP, the manufacturing industry is also the highest corporate taxpayer with a contribution of IDR 596.89 trillion (www.
ekonomi.kompas.com, 2018)
The manufacturing industry also has stable growth as per the Purchasing Manager Index (PMI) indicator. Based on the annual report of Bank Indonesia in 2018, the manufacturing industry was in the expansion phase and data showed that the manufacturing PMI was 51.2 points, surpassing market expectations of 50 points. This shows that the manufacturing company is expanding driven by the domestic or export market demands. Considering the rapid expansion condu- cted by a company and the higher competitiveness in incre- asing the company’s value, a company will surely need an additional source of funding which causes new problems related to the funding. The needs of funding can be fulfilled by the internal source in the form of retained earnings or
the external source in the form of creditors, investors, and issuing debt or equity.
Based on the conditions above, this study has two aims.
First, it investigates the determinants of capital structure.
Second, it tests the dynamic model to answer whether the capital structure decision is influenced by profitability, non- debt tax shields, liquidity, earnings volatility, tangible assets, company growth, and the control variables. The findings of this research indicate that the determinants of the capital structure of manufacturing companies in Indonesia move dynamically. This is evident since the level of debt in the previous year affected the current level of debt. Capital structure is also influenced by profitability and non-debt tax shields, company size, and market capitalization.
The paper is structured as follows. Section two discusses the literature on the issue of the dynamism of the capital structure and hypotheses development. Section three presents the research methodology with econometric models and data. Section four explains the results of the analysis and discussion. The final section concludes this paper.
2. Literature Review and Hypotheses
The empirical studies on capital structure with a proxy for the level of debt have been done by examining the level of debt in a company, which will lead to optimal debt (Booth et al., 2001; De Jong, Kabir, & Nguyen, 2008; Rajan
& Zingales, 1995). In the framework of the static capital structure concept, there are weaknesses because the use of debt as optimal debt is not always the case. The level of debt will vary from time to time; therefore, there is a dynamic level of debt. The capital structure may not exactly correspond to the target. The theory states that the capital structure behaves dynamically and will adjust to debt targets in the long run, with a certain speed of adjustment (Jalilvand
& Harris, 1984).
Three major theories emerged over the years following the assumption of the perfect capital market of capital structure irrelevance model. TOT assumes that firms have one optimal debt ratio and the firm trades off the benefit and cost of debt and equity financing. POT assumes that firms following a financing hierarchy minimizes the problem of information asymmetry. However, neither of these two theories provide a complete description of why some firms prefer debt and others prefer equity finance under different circumstances (Myers, 1984)
Gaud et al. (2005) analyzed the determinants of the capital structure for a panel of 104 Swiss companies listed in the Swiss stock exchange. They found that the companies’
size, the significance of tangible assets, and business risk
are positively related to leverage, while profitability and
growth are negatively related to leverage. This indicates that
both the POT and TOT explain the capital structure of the
companies, though more evidence exists to validate the latter theory. Their analysis also showed that firms adjust toward a target debt ratio; however, the adjustment process is much slower than in most other countries.
Flannery and Rangan (2006) considered a new aspect in the literature on the capital structure that relates financial constraints to the speed of adjustment to a target debt ratio.
They examined the speed of capital structure adjustment toward the target level and finds the costs and benefits of rebalancing are significant determinants of the observed adjustment process. They presented a theory of capital structure adjustment speed and model the main factors in this process with a modified partial adjustment model.
Getzmann, Lang, and Spremann (2014) tested relationships that are typical of the TOT and the POT and analyzed the speed of adjustment toward target capital structures for companies from different industrial sectors and listed on the Asian stock exchanges. They found evidence that companies in Asia pursue target capital structures, as predicted by the TOT. Only in one respect does the POT demonstrate superior explanatory power. They further showed that the convergence to target capital structures is consistent with international evidence, estimated at an annual adjustment speed of 24–45% of original leverage levels.
2.1. Profitability and Capital Structure
POT states that higher profitability of the company means higher the retained earnings potential to be the internal source of funding such that the company debts will be lower (Baskin, 1989; Nguyen & Tran, 2020; Rajan
& Zingales, 1995; Rani, Yadav, & Tripathy, 2019; Titman
& Wessels, 1988; Vu et al., 2020). On the other hand, the TOT states that higher company profit means higher debts with tax-saving which could be enjoyed by the company.
Several studies found the positive influence of profitability on the leverage level (Bradley, Jarrell, & Kim, 1984). The profitability variable is measured using Return on Assets (ROA) and Return on Equity (ROE). According to the POT, profit has a negative influence on debt, while according to the TOT, profit has a positive influence on debt. Thus, the following hypothesis is proposed.
H1: Profitability influences debt.
2.2. Non-Debt Tax Shields (NDTS) and Capital Structure
TOT predicts the negative relationship between NDTS and leverage (Bradley et al., 1984; Cortez & Susanto, 2012; De Jong, Kabir, & Nguyen, 2008; Memon, Rus, &
Ghazali, 2015; Rani et al., 2019). Titman and Wessels (1988) presented a model of optimal capital structure that
integrates the influence of corporate and personal taxes and NDTS. They argued that tax deductions for investment tax credits and depreciation are substitutes for the tax benefits of debt financing. Therefore, a firm with large NDTS compared with their expected cash flow include less debt in its capital structure. Indonesia provides tax reduction facility to the company as stated in Article 6 Law no. 36 of 2008, concerning the costs which can reduce the gross income such as reduced cost expense (for the tangible property) or amortization (for the intangible property) on the asset which has a more than one year of useful life. A company with a higher NDTS amount will reduce the external source of funding from debt. Indicators of NDTS include the ratios of investment tax credits over total assets, depreciation over total assets (D/TA), and a direct estimate of NDTS over total assets. Several researchers used the depreciation over total assets ratio to measure NDTS. Consistent with the expectation, the proposed hypothesis is:
H2: Non-Debt Tax Shield has a negative influence on debt 2.3. Liquidity (LIQ) and Capital Structure
POT explains that a company with high liquid assets will probably use the assets to fund the investment such that the higher liquidity means the lower debt (Ozkan, 2011). On other hand, the TOT states that a company with a higher liquidity ratio will choose a higher debt ratio due to its ability to pay short-term liabilities. Liquidity ratios measure a company’s ability to pay short-term obligations of one year or less. This variable is measured by dividing the liquid assets and liquid debt (LIQ) (Handoo & Sharma, 2014). According to the POT, liquidity has a negative influence on debt, while according to the TOT, liquidity has a positive influence on debt. Accordingly, the following hypothesis is tested:
H3: Liquidity influences debt
2.4. Earnings Volatility (EVOL) and Capital Structure
The POT and TOT suggest that earnings volatility has
a negative relationship with debt. The higher earnings
volatility (profit or income) means the higher uncertainty of
cash flow on investment. Earnings volatility can be defined
as a business risk. The higher business risk means a higher
desire of the company not to use the debt since the use of
debts will cause interest which causes financial distress
even the possibility of bankruptcy. Several studies found a
negative relationship between earnings volatility and debt
such as Bradley et al. (1984), De Jong, Kabir, and Nguyen
(2008), and Koksal and Orman (2015). This variable, that is,
the effect of earnings volatility is measured by the standard
deviation of earnings before interest, taxes, depreciation, and amortization (EBITDA) on the cost of debt. The proposed hypothesis is:
H4: Earnings volatility has a negative influence on debt.
2.5. Tangible Assets (TA) and Capital Structure Both the POT and TOT argue that tangible assets have a positive influence on debts. Higher tangible assets mean it is easier for the company to obtain external fund loans since the tangible assets can be used as collateral (TG) (Kabeer & Rafique, 2018; Nguyen & Tran, 2020; Rehman, Wang, & Yu, 2016). Several studies used this measurement (Carpentier & Suret, 1999). This variable is measured as the ratio of tangible assets (plant and equipment, property) in the t period with tangible assets of the t-1 period.
H5: The tangible assets has a positive influence on capital structure
2.6. The Relationship of Company Growth (GO) and Capital Structure
POT advocates that a company with higher growth will have a higher debt to fund growth. It means company growth has a positive influence on debt (Dinh & Pham, 2020;
Nguyen & Tran, 2020; Vu et al., 2020). On the other hand, the TOT argued that a company with higher growth will have lower debt to avoid the possibility of financial distress. There are several ways to measure company growth. Growth is the ratio of total assets change in period t with total assets t-1 (Titman & Wessels, 1988). The idea above leads to propose the following hypothesis:
H6: Company growth influences debt 2.7. Control Variables
This study uses several control variables which will possibly explain the relationship with the dependent variable.
Size is to see how the company provides collateral to their use of debts (Koksal & Orman, 2015; Memon et al., 2015).
The size of the company is measured by 1n. total assets.
The age of the company is used as the company’s ability to sustain.
3. Research Methods and Materials 3.1. Econometric Model
This study used two econometric approaches; Linear and Non-Linear to explain the capital structure determinant. Data used was the panel data, to make the estimation result becomes
Best Linear Unbiased Estimation (BLUE). “Best” refers to the minimum variance or the narrowest sampling distribution.
Gauss–Markov theorem states that the ordinary least squares (OLS) estimator has the lowest sampling variance within the class of linear unbiased estimators, if the errors in the linear regression model are uncorrelated, have equal variances, and the expectation value of zero. Autocorrelation refers to the degree of correlation between the values of the same variables across different observations in the data.
Autocorrelation occurs when the Gauss-Markov assumption of uncorrelated error terms is violated. Several researchers stated that if the number of companies is smaller than the amount of observation time, (time series) the random effect model is more suitable to use. Research conducted by Gaud et al. (2005) (2005) shows that capital structure is a dynamic process since the capital structure is the reflection of the funding policy which can be fulfilled through the previous year’s retained earnings and the previously existing debt. Model 1 Approach is the linear model.
Equation Model 1:
DERijt = α + b
1ROA
ijt+b
2ROE
ijt+ b
3GO
ijt+ b
4TG
ijt+ b
5NDTS
ijt+ b
6EVOL
ijt+ b
7LIQ
ijt+ b
8SZ
ijt+ b
9Age
ijt+ e
it(1)
Where DER
ijtis capital structure measured by the debt to equity ratio sector I, company j, at the time t, profitability by using two sizes, they are ROA
ijtand ROE
ijt, GO
ijtis growth opportunities, TG
ijtis collaterals, NDTS
ijtis the non-debt shield, EVOL
ijtis the earnings volatility, LIQ
ijtis liquidity, SZ
ijtis the natural algorithm of total assets, Age
ijtis the amount of year, and MC
ijtis Market Capitalization.
Equation Model 2. is the dynamic model equation to solve that static model with the fixed and random effect panel can still be biased since residual is correlated to the previous variable.
DER
ijt= α + b
1DER
ijt-1+ b
1ROA
ijt-2+b
3ROE
ijt-2+ b
4GO
ijt+ b
5TG
ijt+ b
6NDTS
ijt+ b
7EVOL
ijt+ b
8LIQ
ijt+ b
9SZ
ijt+ b
10Age
ijt+ e
it(2) Equation Model 3 is the non-linear approach with quadratic regression to test the relationship between profitability and debt.
1 2 3 2
4 2 5 6
7 8 9
10 11
ijt ijt ijt ijt
ijt ijt ijt
ijt ijt ijt
ijt ijt it
DER b ROA b ROE b ROA b ROE b GO b TG b NDTS b EVOL b LIQ b SZ b Age e
α
= + + +
+ + +
+ + +
+ + + (3)
Equation Model 4 is the non-linear (quadratic regression) with a dynamic concept.
1 1 1 2 3 2
2 2
4 5 6 7
8 9 10
11 11
ijt ijt ijt ijt
ijt ijt ijt ijt
ijt ijt ijt
ijt ijt it