Change in Fish Assemblage Inhabiting Around Dae Island in Gwangyang Bay, Korea
Seok-Nam Kwak
*․Sung-Hoi Huh
**․Ha-Won Kim
***†*, *** Environ-Ecological Engineering Institute Co., Ltd., 110-54 Millak-Dong, Suyeong-gu, Busan, 613-827 Korea.
** Department of Oceanography, Pukyong National University, Busan, 608-737, Korea
광양만 대도 주변에 서식하는 어류군집의 변화
곽석남
*․허성회
**․김하원
*†*, *** 환경생태공학연구원, ** 부경대학교
Abstract : Changes of fish assemblage inhabiting around Dae Island in Gwangyang Bay, Korea were investigated using a small beam trawl monthly from March 2009 to February 2010. These data were compared with those obtained in previous studies(1990∼1991 and 1995
∼1996) at our study sites. A total of 8,133 fish belonging to 74 species in 38 families were collected. Leiognathus nuchalis, Argyrosomus argentatus, Acentrogobius pellidebilis, Sillago japonica, Apogon lineatus, Thryssa hamiltoni, Repomucenus richardsonii, Pholis nebulosa, Pleuronichthys cornutus, Hexagrammos otakii, and Limanda yokohamae dominated, and these were responsible for 89.5 % and 58.9 % in the number of individuals and in biomass, respectively. These were primarily small species or early juveniles of larger species. Seasonal variation in both species composition and abundance was large: the peak number of fish species occurred in May and October 2009, whilst both number of individuals and biomass were the highest in May 2009. Fish numbers as well as biomass was lowest in January and February 2010. Seasonal changes in the abundance of fishes corresponded with temperature. Compared with the previous studies, the total number of individuals and biomass per unit area(m2) were higher, and the predominance of L. nuchalis occurred while abundances of Liparis tanakai were significant decreased. These results seemed to be change of species composition in fish assemblage which was due to variation of annual environmental characteristics in Gwangyang Bay.
Key Words : Change in fish assemblage, Leiognathus nuchalis, Liparis tanakai, Gwangyang Bay, Cluster analysis
요 약 :광양만 대도주변에 서식하는 어류군집의 변화를 파악하기 위해서 2009년 3월부터 2010년 2월까지 소형 빔트롤을 이용하였으며, 동일 해역에서 실시된 이전 연구결과(1990∼1991, 1995∼1996)와 비교, 고찰하였다. 조사기간 동안 총 74종, 8,133개체가 출현하였다. 우점종은 주둥치, 보구치, 점줄망둑, 청보리멸, 열동가리돔, 풀반지, 돛양태, 베도라치, 도다리, 쥐노래미, 문치가자미 순으로 나타났다. 이들 11어종은 전체 개체수 의 89.5 %, 총 생체량의 58.9 %를 차지하였다. 우점종이었던 개체들은 주로 작은 크기의 어종과 대형 어류의 치어였다. 종조성 및 출현량은 계절 에 따라서 크게 변하였다. 2009년 5월과 10월에 가장 많은 종수가 출현하였으며, 2009년 5월에 개체수와 생체량이 가장 높았다. 출현 개체수 및 생체량은 모두 2010년 1월과 2월에 가장 낮았다. 어류군집의 계절변동은 수온변화와 연관이 있었다. 이전 연구결과와 비교하였을 때, 단위면적 당 전체 개체수와 생체량은 더 높았으며, 주둥치의 출현량은 급격히 증가한 반면에 꼼치의 출현량은 감소하는 양상이었다. 어류군집의 종조성 변화는 광양만내의 전반적인 해양환경 특성의 연간변화에 기인하였다.
핵심용어 : 어류군집 변화, 주둥치, 꼼치, 광양만, 군집분석
1)
1. Introduction
The coastal areas have been well known to support a greater diversity and abundance of fish, and larger numbers of juveniles on a world-wide scale. Many fish species use
* First author : [email protected], 051-757-0097
†Corresponding author : [email protected], 051-757-0097
coastal areas as feeding and nursery grounds, including many economically important fishes(Jenkins and Wheatley, 1998; Lazzari et al., 1999; Guidetti, 2000; Paperno et al., 2001; Kwak and Klumpp, 2004; Kwak and Huh, 2007).
Especially higher diversities of habitat for fishes and shellfishes have been in the southern sea, and fisheries production have been developed until now.
Gwangyang Bay located on the middle part of the
southern sea of Korean peninsula which was characterized by semi-enclosed estuarine embayment, being encompassed by Yeosu and Namhae Island. The major source of freshwater input into the bay is Seomjin River at the northern end of the bay, and a few streams including Sueocheon and Dongcheon provide additional freshwater and nutrients input to the bay(Huh and Kwak, 1997a; Huh et al., 1998). A variety of coastal fisheries and farming have been prevalence in the most part of Gwangyang Bay, however, environmental disturbances have predicted every year due to the construction of Gwangyang Steel Mill Company(POSCO) in 1980’s, Hadong Power Plant and industrial complex since 1993. To date the studies of fish assemblage in Gwangyang Bay have been confined to describe species composition and seasonal variation at particular periods around Dae Island(Choo, 1997; Huh et al., 1998), western part of Gwangyang Bay(Cha and Park, 1997;
Oh, 2003), and eelgrass bed(Huh and Kwak, 1997a). Far less is known about the studies on variation of fish assemblages with long-term periods despite of higher occurrence of human impacts in Gwangyang Bay.
The objective of this study was to examine the seasonal variation in species composition and abundance of fishes inhabiting around Dae Island in Gwangyang Bay, Korea and to compare fish assemblages between our study(2009∼
2010) and previous studies(1991∼1992 and 1995∼1996) in order to determine the change in fish assemblage with environmental disturbance. It may be useful as a good information for ensure fish resources sustainability in the coastal areas.
2. Materials and Methods
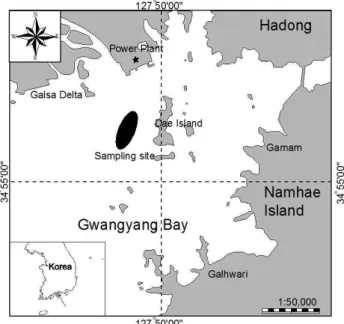
The coastal water off Dae Island in Gwangyang Bay has been highly productive and characterized by fisheries and farming area nearby eelgrass bed, intertidal flat, and Hadong Power Plant(Fig. 1). Fish samples were collected monthly by 5-m trawl(1.9-cm mesh wing and body). Four 30-min tows in each sampling time were carried out from March 2009 to February 2010. Specimens were preserved immediately in 10 % formalin after capture and later transferred to 70 % isopropanol. These samples were identified according to Masuda et al.(1984), Yoon(2002), and Nakabo et al.(1993), and weighed to the nearest gram in wet weight. Specimens were measured to the nearest mm(Total length TL). Surface water temperature(by thermometer) and salinity(by salinometer) were monitored monthly on each sampling occasion.
Fig. 1. Location of the study area(the black area).
The fish data was analysed to obtain the following community variables. Diversity H’(Shannon and Weaver, 1949) was calculated as:
′
log
(1)where n is the number of individuals of each i species in a sample and N is the total number of individuals.
Association of fish species, Pianka’s similarity index (Pianka, 1973), Aij was calculated as:
(2)
where Aijis the similarity of species j on species i; pih is the proportion of individuals of a species i in a particular month h; pjh is the proportion of individuals of a species j in a particular month h. Values for the similarity index may vary between 0, if no similarity occurs, and 1 for complete similarity. The Pianka’s similarity index was subjected to an average linkage cluster analysis.
For comparison of fish assemblages between our study (2009∼2010) and previous studies(1990∼1991(Huh et al., 1998) and 1995∼1996(Choo, 1997)) at our study sites, the total number of individuals of fish species was described as percentage. Abundances of fishes were transformed with per unit area(m2) at each sampling periods.
Fig. 2. Monthly variations of temperature and salinity in the coastal waters off Dae Island in Gwangyang Bay.
Species Total
Species Total
N % B % N % B %
Leiognathus nuchalis 5,066 62.9 23,103.8 27.3 Takifugu niphobles 5 * 182.7 0.2
Pennahia argentatus 580 7.2 4,578.0 5.4 Tridentiger trigonocephalus 5 * 19.0 *
Acentrogobius pellidebilis 402 5.0 531.7 0.6 Lepidotrigla japonica 4 * 270.5 0.3
Sillago japonica 266 3.3 2,019.3 2.4 Cynoglossus robustus 4 * 191.3 0.2
Apogon lineatus 262 3.3 1,055.8 1.2 Hippoglossoides pinetorum 4 * 89.4 0.1
Thryssa hamiltoni 194 2.4 2,304.8 2.7 Rudrius ercodes 4 * 6.9 *
Repomucenus curvicornis 118 1.5 478.8 0.6 Hexagrammos agrammus 3 * 193.5 0.2
Pholis nebulosa 117 1.5 4,882.9 5.8 Inegocia japonica 3 * 151.9 0.2
Pleuronichthys cornutus 103 1.3 3,295.3 3.9 Saurida elongata 3 * 121.1 0.1
Hexagrammos otakii 87 1.1 6,340.5 7.5 Paraplagusia japonica 3 * 20.9 *
Pleuronectes yokohamae 86 1.1 2,911.9 3.4 Ctenotrypauchen microcephalus 3 * 16.0 *
Thryssa adelae 77 1.0 584.7 0.7 Hypodytes rubripinnis 3 * 14.0 *
Repomucenus lunatus 73 0.9 206.3 0.2 Cociella crocodila 2 * 257.5 0.3
Cynoglossus joyneri 63 0.8 1,593.3 1.9 Pseudorhombus pentophthalmus 2 * 75.9 *
Pholis fangi 54 0.7 371.5 0.4 Ditrema temmincki 2 * 43.7 *
Trachurus japonicus 54 0.7 139.7 0.2 Trachinocephalus myops 2 * 16.1 *
Cryptocentrus filifer 47 0.6 307.9 0.4 Leiognathus elongatus 2 * 7.5 *
Liparis tanakai 44 0.5 6,426.0 7.6 Hippocampus takakurae 2 * 2.3 *
Acanthopagrus schlegeli 43 0.5 1,320.1 1.6 Champsodon snyderi 2 * 1.8 *
Okamejei kenojei 39 0.5 11,999.3 14.2 Hippocampus japonicus 2 * 1.7 *
Amblychaeturichthys hexanema 32 0.4 221.4 0.3 Okamejei boesemani 1 * 736.9 0.9
Johnius grypotus 28 0.3 955.3 1.1 Ophisurus macrorhynchus 1 * 131.0 0.2
Engraulis japonicus 27 0.3 83.5 0.1 Sphyraena pinguis 1 * 118.6 0.1
Sebastes inermis 23 0.3 642.6 0.8 Pleuronichthys sp. 1 * 65.0 *
Muraenesox cinereus 20 0.2 2,036.1 2.4 Cynoglossus semilaevis 1 * 52.5 *
Repomucenus valenciennei 19 0.2 33.3 * Zebrias fasciatus 1 * 27.3 *
Upeneus japonicus 18 0.2 200.1 0.2 Minous monodactylus 1 * 24.4 *
Zoarces gillii 16 0.2 41.2 * Pseudaesopia japonica 1 * 18.7 *
Thryssa kammalensis 13 0.2 102.4 0.1 Konosirus punctatus 1 * 17.8 *
Repomucenus spp. 13 0.2 49.5 * Clupea pallasii 1 * 10.1 *
Parapercis sexfasciatus 12 0.1 343.2 0.4 Repomucenus koreanus 1 * 5.1 *
Erisphex pottii 12 0.1 25.3 * Leiognathus rivulatus 1 * 2.8 *
Platycephalus indicus 11 0.1 1,578.5 1.9 Hapalogenys mucronatus 1 * 2.4 *
Acanthogobius flavimanus 9 0.1 302.8 0.4 Acropoma japonocum 1 * 2.3 *
Lateolabrax japonicus 9 0.1 259.7 0.3 Favonigobius gymnauchen 1 * 1.8 *
Conger myriaster 8 0.1 467.1 0.6 Bathycallionymus kaianus 1 * 0.7 *
Hemitripterus villosus 7 * 2,164.8 2.6 Total 8,057 84,603
Paralichthys olivaceus 5 * 644.4 0.8 Number of species 74
N : Number of individuals, B : Biomass(g), * : Less than 0.1 %
Table 1. Total number of individuals and biomass of fish species collected using a beam trawl in the coastal waters off Dae Island in Gwangyang Bay from March 2009 to February 2010
3. Results
3.1 Temperature and salinity
Temperature at the study site ranged from 9.6 ℃ to 24.3
℃ and varied significantly with months. The peak of temperature was around August and September 2009, a decline in October 2009 and a minimum during winter (January 2010)(Fig. 2). Salinity ranged from 22.3 psu to 33.7 psu and did not vary significantly between months with displayed a similar pattern except in July 2009 when it dropped(about 22.3 psu)(Fig. 2).
Fig. 3. Size–distribution of principal fishes collected using a beam trawl in the coastal waters off Dae Island in Gwangyang Bay from March 2009 to February 2010.
3.2 Species composition
A total of 8,057 fish belonging to 74 species in 38 families were collected around Dae Island in Gwangyang Bay(Table 1). Numerically dominant fish were
Leiognathus nuchalis
(62.9 %),Argyrosomus argentatus
(7.2 %),Acentrogobius pellidebilis
(5.0 %),Sillago japonica
(3.3 %),Apogon lineatus
(3.3 %),Thryssa hamiltoni
(2.4 %),Repomucenus richardsonii
(1.5 %),Pholis nebulosa
(1.5 %),Pleuronichthys cornutus
(1.3%),
Hexagrammos otakii
(1.1 %) andPleuronectes yokohamae
(1.1 %), together accounting for 89.5 % of the catch. The numerically dominant fish species made up 58.9 % of biomass. For biomass,L. nuchalis
(27.3 %),Okamejei kenojei
(14.2 %),Liparis tanakai
(7.6 %),H. otakii
(7.5 %),P.
nebulosa
(5.8 %) andA
.argentatus
(5.4 %) were higher than those of other fish species.The size distributions of principal fishes were differed (Fig. 3). The size range of
L. nuchalis
was 3.3∼11.3 cm TLwith peak numbers in 5.0∼7.9 cm TL. The number of
A.
argentatus
was higher in 3.0∼4.9 cm TL which were ranged from 1.3 to 24.2 cm TL. TheA. pellidebilis
occurred in size ranged from 3.1∼10.2 cm TL, however,S. japonicus
in 3.3∼19.4 cm TL with high numbers in 6.0∼7.9 cm TL. The peak numbers of
A. lineatus
was from 5.0 to 6.9 cm TL, and those ofT. hamiltoni
was about 10 cm TL.3.3 Seasonal variation in abundance of fish
The number of fish species(9∼30 species) varied with months. Fish species was abundant in April 2009 and October 2009(Fig. 4(a)). Number of individuals remarkably varied with months(Fig. 4(b)). Fish numbers were most abundant May 2009 when
L. nuchalis
andA. argentatus
which were ranged in 3.2∼8.6 cm TL and 6.4∼15.3 cm TL were dominant. Fish numbers was the lowest in February 2010. The fish biomass differed substantially betweendifferent months(Fig. 4(c)). Highest biomass was also in May 2009 when many large common fish species such as
L. nuchalis
,A. argentatus
, andS. japonicus
were present.The range of diversity index(H’) was 0.71∼2.31, and higher value was in October 2009 and February 2010(Fig. 4(d)).
Fig. 4. Monthly variations in number of species (a), number of individual (b), biomass (c), and species diversity index (d) of fish collected using a beam trawl in the coastal waters off Dae Island in Gwangyang Bay from March 2009 to February 2010.
The dendrogram shows six clusters which identify the fish species, and one fish species(Fig. 5). The first group was composed of
P. nebulosa
,H. otakii
,L. yokohamae
,Pholis fangi
,Amblychaeturichthys hexanema
,A. lineatus
,P.
cornutus
,A. pellidebilis
,R
,richardsonii
,A. argentatus
andT. hamiltoni
with occurring predominantly over study periods. The second group containsRepomucenus lunatus
,Cryptocentrus fillifer
,Cynoglossus joyneri
,C. robustus
,Upeneus japonicus
andPlatycephalus indicus
. This group was high numbers during summer, especially August 2009 and September 2009, while numbers of them were few in other periods. The third group was composed ofConger myriaster
,Takifugu niphobles
,Repomucenus valencienneii
,R. kenojei
andRepomucenus
sp. which were peak numbers from late summer to fall. The fourth group was consisted ofS. japonicus
,Acanthopagrus schlegeli
,Engraulis japonicus
,Acanthogobius flavimanus
,Parapercis sexfasciatus
with occurrence from late fall to winter. The fifth group was composed ofParalichthys olivaceus
,Hemitripterus villosus
,Tridentiger trigonocephalus
,L.
tanakai
, andZoarces gilli
with occurrence from winter to March 2010, however, the sixth group wasJohnius belengerii
,Muraenesox cinereus
andTrachurus japonocus
which were only present March, April and May 2009. The last one species wasL. nuchalis
with higher numbers at each sampling occasion during study periods.Fig. 5. Dendrogram illustrating the species associations of fishes collected using a beam trawl in the coastal waters off Dae Island in Gwangyang Bay from March 2009 to February 2010.
Species Our study Previous studies
Species Our study Previous studies
2009∼2010 1995∼1996 1990∼1991 2009∼2010 1995∼1996 1990∼1991
Leiognathus nuchalis 62.29 27.16 26.08 Cynoglossus semilaevis 0.01 - -
Pennahia argentatus 7.13 0.92 5.21 Favonigobius gymnauchen 0.01 1.10 0.01
Acentrogobius pellidebilis 4.94 8.31 2.20 Hapalogenys mucronatus 0.01 0.01 -
Sillage japonica 3.27 4.25 0.24 Konosirus punctatus 0.01 - 1.00
Apogon lineatus 3.22 0.01 - Leiognathus rivulatus 0.01 - -
Thryssa hamiltoni 2.39 - - Minous monodactylus 0.01 - -
Repomucenus richardsoni 1.45 0.31 0.49 Ophisurus macrorhynchus 0.01 - -
Pholis nebulosa 1.44 1.79 3.53 Pleuronichthyssp. 0.01 - -
Pleuronichthys cornutus 1.27 0.19 0.08 Pseudaesopia japonicus 0.01 0.09 0.44
Hexagrammos otakii 1.07 1.21 0.39 Raja boesemani 0.01 - -
pleuronectes yokohamae 1.06 3.44 2.23 Repomucenus koreanus 0.01 - -
Thryssa purava 0.95 - - Sphyraena pinguis 0.01 0.05 0.31
Repomucenus lunatus 0.90 0.21 0.56 Zebrias fasciatus 0.01 - -
Cynoglossus joyneri 0.77 0.08 1.02 Acanthogobius hasta - 0.01 0.01
Pholis fangi 0.66 5.37 0.48 Amblychaeturichthys sciistius - 0.15 -
Trachurus japonicus 0.66 - 0.24 Apogon semilineatus - 0.01 -
Cryptocentrus filifer 0.58 0.48 0.31 Callogobiussp. - - 0.03
Liparis tanakai 0.54 26.59 15.49 Chaenogobius castanea - 0.01 -
Acanthopagrus schlegeli 0.53 0.08 - Chaenogobius heptacanthus - 0.03 -
Okamejei kenojei 0.48 - - Amblychaeturichthys stigmatias - - 0.06
Amblychaeturichthys hexanema 0.39 0.17 1.21 Chirolophis japonicus - - 0.16
Johnius belengerii 0.34 3.37 11.56 Chirolophis wui - 0.01 -
Engraulis japonicus 0.33 2.51 0.71 Clidoderma asperrimum - 0.11 0.39
Sebastes inermis 0.28 0.01 0.02 Coelorinchus multispinulosus - 0.01 -
Muraenesox cinereus 0.25 0.46 0.12 Cynoglossus interruptus - 0.10 0.32
Upeneus japonicus 0.23 - - Epinephelus septemfasciatus - 0.01 -
Repomucenus valenciennei 0.22 4.28 4.08 Evynnis japonica - 0.01 -
Zoarces gilli 0.20 1.33 - Gasterosteus aculeatus aculeatus - 0.01 -
Parapercis sexfasciata 0.16 0.07 1.94 Gnathagnus elongatus - - 0.01
Thryssa kammalensis 0.16 1.16 6.77 Hapalogenys nitens - - 0.01
Erisphex potti 0.15 0.19 0.02 Inimicus japonicus - 0.11 0.12
Repomucenussp. 0.15 - - Kareius bicoloratus - 0.10 -
Platycephalus indicus 0.14 0.30 0.71 Limandasp. - 0.33 -
Conger myriaster 0.11 0.85 1.46 Myctophum affine - 0.02 -
Lateolabrax japonicus 0.11 0.22 0.28 Oplegnathus fasciatus - - 0.01
Acanthogobius flavimanus 0.10 0.20 0.43 Pagrus major - 0.01 -
Hemitripterus villosus 0.09 0.08 - Pampus argenteus - 0.25 -
Paralichthys olivaceus 0.06 0.01 - Pampus echinogaster - 0.24 0.12
Takifugu niphobles 0.06 0.10 0.62 Pholis crassispina - 0.07 -
Tridentiger trigonocephalus 0.06 0.14 0.03 Priacanthus macracanthus - 0.01 0.03
Cleisthenes pinetorum 0.05 - - Pseudoblennius cottides - 0.63 0.02
Cynoglossus robustus 0.05 0.01 0.01 Pseudoblennius percoides - 0.01 -
Lepidotrigla japonica 0.05 - - Pseudosciaena crocea - - 0.08
Rudrius ercodes 0.05 0.03 - Pterogobius elapoides - - 0.01
Ctenotrypauchen microcephalus 0.04 0.02 - Raja kenojei - - 0.03
Hexagrammos agrammus 0.04 - - Sardinella zunasi - 0.01 0.07
Hypodytes rubripinnis 0.04 - 0.15 Saurida undosquamis - 0.01 -
Inegocia japonica 0.04 - - Scombrops boops - 0.01 -
Paraplagusia japonica 0.04 - 0.01 Sebastes schlegeli - 0.02 -
Saurida elongata 0.04 - - Stephanolepis cirrhifer - - 0.07
Champsodon snyderi 0.02 0.01 - Syngnathus schlegeli - 0.12 0.02
Cociella crocodila 0.02 - 0.01 Thamnaconus modestus - 0.01 -
Ditrema temminicki 0.02 0.07 - Thryssa adelae - 0.04 7.26
Hippocampus japonicus 0.02 0.06 - Triaenopogon barbatus - 0.01 -
Hippocampus takakurae 0.02 - - Trichiurus lepturus - 0.04 0.07
Leiognathus elongatus 0.02 - - Upeneus bensasi - 0.15 0.17
Pseudorhombus pentophthalmus 0.02 0.09 0.23 Verasper variegatus - - 0.14
Trachinocephalus myops 0.02 - - Zebrias zebra - 0.02 0.06
Acropoma japonicum 0.01 0.02 -
Bathycallionymus kaianus 0.01 - - Total 100 100 100
Clupea pallasii 0.01 - - Number of species 74 80 63
Table 2. Comparison in percentage numbers of fish species between our study and previous studies in the coastal waters off Dae Island in Gwangyang Bay
3.4 Comparison between our study(2009∼2010) and previous studies(1990∼1991 and 1995∼1996) The percentage of total number of individuals was differed with each sampling periods(Table 2). For example, the percentage numbers of
L. nuchalis
increased significantly (62.29 % in 2009∼2010, 27.16 % in 1995∼1996 and 26.08 %in 1990∼1991) with sampling periods. The
A. argentatus
(7.13 %),R. richardsonii
(1.45 %),P. cornutus
(1.27 %),R.
lunatus
(0.90 %) were also increased, andA. lineatus
(3.22 %) andT. hamiltoni
(2.39 %) almost occurred only in 2009∼2010.On the other hand, those of
L. tanakai
andJ. benegerii
were significant decreased(0.54 % and 0.34 % in 2009∼2010,26.59 % and 3.37 % in 1995∼1996, and 15.49 % and 11.56 % in 1990∼1991). The
A. pellidebilis
(4.94 %),P. nebulosa
(1.44 %),L. yokohamae
(1.06 %),P. fangi
(0.66 %),R. valenciennei
(0.22 %),T. Kammalensis
(0.16 %) andC. myriaster
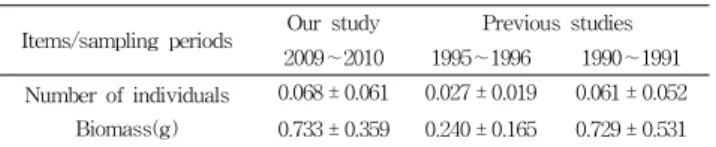
(0.11 %) were also decreased gradually in 2009∼2010.For total number of individuals and biomass per m2 (Table 3), the number of individuals and biomass were higher(0.068 ± 0.061, 0.733 ± 0.359) in 2009∼2010 than those of in 1995∼1996(0.027 ± 0.019, 0.240 ± 0.165) and 1990∼
1991(0.060 ± 0.052, 0.729 ± 0.531).
Items/sampling periods Our study Previous studies 2009∼2010 1995∼1996 1990∼1991 Number of individuals
Biomass(g)
0.068 ± 0.061 0.027 ± 0.019 0.061 ± 0.052 0.733 ± 0.359 0.240 ± 0.165 0.729 ± 0.531
* 1995∼1996 : Choo(1997), 1990∼1991 : Huh et al.(1998)
Table 3. Comparison in average and standard deviation of total number of individuals and biomass per m2 of fish species between our study and previous studies in the coastal waters off Dae Island in Gwangyang Bay
4. Discussion
A total of 74 fish species was recorded from the coastal waters off Dae Island in Gwangyang Bay and
L. nuchalis
,A. argentatus
,A. pellidebilis
,S. japonica
,A. lineatus
,T.
hamiltoni
,R. richardsoni
,P. nebulosa
,P. cornutus
,H.
otakii
andL. yokohamae
were numerically dominant. Most of fish species have been known as coastal fish species around Korea, and some of them are of commercial and recreational importance. For example,H. otakii
,P. cornutus
andL. japonicus
are valued as live fish in the southern sea, Korea, andP. nebulosa
,A. argentatus
andT. hamiltoni
harvested as a food fish(Yoon, 2002; Kim and Kang, 1993).Broad-scale surveys of fish communities from other regions nearby our study sites suggest a similar community structure.
L. nuchalis
was also dominated the fish community in the western part of Gwangyang Bay(Cha and Park, 1997;Oh, 2003),
A. pellidebilis
,S. japonica
,H. otakii
andL.
yokohamae
in an eelgrass bed of Gwangyang bay and coastal waters off Namhae Island with generaAcentrogobius
,Thryssa
andRepomucenus
groups(Huh and Kwak, 1997a; Kwak et al., 2008). Fish collected from the coastal waters off Dae Island in Gwangyang Bay appeared to be dominated by small fishes and juveniles of most species. This indicated that the coastal waters off Dae Island in Gwangyang Bay function as nursery areas. Suchconclusions are in general agreement with previous studies of fish assemblage at our study sites(Choo, 1997; Huh et al., 1998; Huh and Kwak, 1998a). For example, the size distribution of common fish species were similar to those of fish species nearby our study area.
The predomination of
L. nucahlis
exhibited distinct occurrence pattern except March 2009, January 2010 and February 2010 at our study sites. The range of percent numbers ofL. nuchalis
were from July 2009(56.1 %) to May 2009(86.9 %) during study periods, and those ofA.
pellidebilis
andL. tanakai
were higher in March 2009, andH. otakii
andP. nebulosa
in January and February 2010.These results have shown different patterns with other studies of fish assemblage. For example, dominant fish species occurred their own distinct seasonal patterns and different time of peak abundances(Choo, 1997; Cha and Park, 1997; Huh et al., 1998; Huh and Kwak, 1998a; Huh and Kwak, 1998b; Oh, 2003; Kwak et al., 2008). Thus fish assemblage of our study area might be influenced by environmental characteristics.
Seasonal variation in both species composition and abundance of fish species appear to be considerable for fish assemblages. The number of individuals and biomass of fish species in the study area were higher in May 2009 when higher temperature was in temperate area, whereas those of were the lowest value in January and February 2010. Compared with previous studies of fish assemblage at our study sites, higher numbers and biomass of fish species were in spring but those of were lower in winter regardless of sampling periods(Choo, 1997; Huh et al., 1998). The higher number of eelgrass fishes was also corresponded with higher temperature in an eelgrass bed around Dae Island(Huh and Kwak, 1997a). Several other studies have demonstrated a positive correlation between temperature and fish abundances(Huh and Kwak, 1998a;
Huh and Kwak, 1998b; Lazzari et al., 1999; Paperno et al., 2001; Huh and An, 2002; An and Huh, 2002; An and Huh, 2003; Oh, 2003; Hwang, 2007; Kwak et al., 2006; Kwak et al., 2008; Kwak and Huh, 2007). Prey availability may also be an important factor influencing fish abundance at our study sites. Most of dominant species(e. g.,
L. nuchalis
,S.
japonica
,H. otakii
, andL. yokohamae
) fed mainly on small-sized zooplankton and crustaceans such as amphipods and isopods in Gwangyang Bay(Huh and Kwak, 1997b;Kwak et al., 2004; Kwak and Huh, 2003; Kwak et al., 2005). Seasonal variation in abundance of these prey animals coincided with those of dominant fishes during the study period(Kwak et al., unpublished; Soh and Suh, 1993).
Other studies of fish assemblage have reported similar correlated seasonal variation in abundance of small sized animals such as crustacean and fish occurrence in the southern sea(Huh and Kwak 1997a; Kwak et al., 2008).
The fish assemblages have been seemed remarkable to change with long term periods at our study sites. The abundances of
L. nuchalis
was predominately occurred with more half of total numbers, whereas those ofL. tanakai
were decreased sharply in 2009∼2010. Especially numbers ofL. nuchalis
were increased in the southern sea, Korea.For example, 1,564 individuals were around Shinsu Island in 1986∼1987(Kim and Kang, 1991), 2,235 individuals in Nakdong river estuary in 1987∼1988(Huh and Chung, 1999), 916 individuals around Namhae Island, and 39,740 individuals in the western part of Gwangyang Bay 1998∼
2002(Huh and Kwak, 1998a; Huh and Kwak, 1998b; Oh, 2003). A significantly greater abundance of
L. nuchalis
were in the southern sea including our study sites confirmed that this species were likely to be dependent on natural environmental changes such as temperature, sediment characteristics, current and food availability etc.(Huh and Kwak, 1998a; Oh, 2003). It was assumed that human impacts were also one of environmental factors for variation ofL.
nuchalis
numbers. Diana(2004) have demonstrated that higher dominance of one or two fish species have been resulted in the lower diversity of fish assemblages at unstable condition in marine ecosystems.On the other hand, abundances of
L. tanakai
varied with spawning and recruitments periods which were due to temperature and prey availability. Higher number of juvenileL. tanakai
were due to largely recruitment after spawned in the coastal area nearby our study sites from March to May in 1990∼1991(Choo, 1997) and 1995∼1996(Huh et al., 1998), while those ofL. tanakai
were few in 2009∼2010.L.
tanakai
have been spawned large numbers of egg on the blade of eelgrass with attachments, and higher numbers occurred from February to May in an eelgrass beds around Dae Island as small sized juveniles(Chyung, 1977; Huh and Kwak, 1997a). In Gwangyang Bay, large intertidal flat including delta and eelgrass beds became to reduce gradually with human impact such as the construction of Gwangyang Steel Mill Company(POSCO), Hadong Power Plant and industrial complex since 1993(Yoon, 2006). These results indicated lower numbers ofL. tanakai
may be corresponded with lower eelgrass biomass nearby our study sites with periods. Other studies were similar patterns which change in species composition and lower diversity have been occurred with higher human development in the coastalarea and beach(John, 1997; Diana, 2004). Hence we suggested that changes in species composition and abundances of fish species were influenced by natural environmental factors such as temperature and prey availability, and human impacts indirectly.
Acknowledgements
We are grateful to Bong Jung, Sung and Jung Yun, Kim of Department of Oceanography, Pukyong University for assistance with sampling and data analysis. We thank Dr.
David W Klumpp(AIMS) for his constructive comments in structure of English, and some anonymous referees for their constructive criticism.
References
[1] An, Y. R. and S. H. Huh(2002), Species composition and seasonal variation of fish assemblage in the coastal water off Gadeok-do, Korea, 3. Fishes collected by crab pots, Journal of the Korean Fisheries Society, Vol. 35, No. 6, pp. 715-722.
[2] An, Y. R. and S. H. Huh(2003), Species composition and seasonal variation of fish assemblage in the coastal water off Gadeok-do, Korea, 4. Fishes collected by bottom gill nets, Journal of the Korean Fisheries Society, Vol. 36, No. 6, pp. 686-694.
[3] Cha, S. S. and K. J. Park(1997), Seasonal changes in species composition of fishes collected with a bottom trawl in Kwangyang Bay, Korea, Korean Journal of Ichthyology, Vol. 9, No. 2, pp. 235-243.
[4] Choo, H. G.(1997), Change of fish composition near Daedo island in the Kwangyang Bay, M. S. Thesis, Pukyong National University, Pusan, Korea, p. 59.
[5] Chyung, M. K.(1977), The Fishes of Korea, Ilji-sa, Seoul, p. 361.
[6] Diana, J. S.(2004), Biology and Ecology of Fishes, 2nd Edition, Biological Sciences Press, p. 498.
[7] Guidetti, P.(2000), Differences among fish assemblages associated with nearshore Posidonia oceanica seagrass beds, rocky-algal reefs and unvegetated sand habitats in the Adriatic Sea, Estuarine Coastal and Shelf Science, Vol. 50, No. 4, pp. 515-529.
[8] Huh, S. H., N. U. Kim and H. G. Choo(1998), Seasonal variation in species composition and abundance of fishes collected by an otter trawl around Daedo Island in Kwangyang, Bulletin of the Korean of Society of
Fisheries Technology, Vol. 34, pp. 419-432.
[9] Huh, S. H. and S. G. Chung(1999), Seasonal variation in species composition and abundance of fishes collected by an otter trawl in Nakdong River Estuary, Bulletin of the Korean of Society of Fisheries Technology, Vol. 35, pp. 178-195.
[10] Huh, S. H. and S. N. Kwak(1997a), Species Composition and Seasonal Variations of Fishes in Eelgrass (
Zostera marina
) Bed in Kwangyang Bay, Korean Journal of Ichthyology, Vol. 9, pp. 202-220.[11] Huh, S. H. and S. N. Kwak(1997b), Feeding Habits of
Leiognathus nuchalis
in Eelgrass (Zostera marina
) Bed in Kwangyang Bay, Korean Journal of Ichthyology, Vol. 9, pp. 221-227.[12] Huh, S. H. and S. N. Kwak(1998a), Seasonal variations in species composition of fishes collected by an otter trawl in the coastal water off Namhae Island, Korean Journal of Ichthyology, Vol. 10, pp. 11-23.
[13] Huh, S. H. and S. N. Kwak(1998b), Species composition and seasonal variations of fishes collected by winged stow nets on anchors off Namhae Island, Bulletin of the Korean of Society of Fisheries Technology, Vol.
34, pp. 309-319.
[14] Huh, S. H. and Y. R. An(2002), Species composition and seasonal variation of fish assemblage in the coastal water off Gadeok-do, Korea, 2, Fishes collected by three sides fyke nets, Journal of the Korean Fisheries Society, Vol. 35, pp. 366-379.
[15] Hwang, W. J.(2007), Species composition and seasonal variations in fishes in the eelgrass (
Zostera marina
) bed in Aenggang Bay, Korea, Ms. Thesis, Pukyong National University, Pusan, Korea, p. 63.[16] Jenkins, G. P. and M. J. Wheatley(1998), The influence of habitat structure on nearshore fish assemblages in a southern Australian embayment: comparison of shallow seagrass, reef-algal and unvegetated sand habitat, with emphasis on their importance to recruitment, Journal of Experimental Marine Biology and Ecology, Vol. 221, pp.
148-172.
[17] John, C. B.(1997), Regional, habitat, and human development influences on coastal wetland and beach fish assemblages in Green Bay, Lake Michigan, Journal of Great Lakes Research, Vol. 23, pp. 36-51.
[18] Kim, C. K. and Y. J. Kang(1991), Fish assemblage collected by gill net in the coastal shallow water off Shinsudo, Samchonpo, Bulletin of the Korean Fisheries Society, Vol. 24, pp. 99-110.
[19] Kim, I. S. and Y. J. Kang(1993), Coloured Fishes of
Korea, Academy Publishing Co, Seoul, p. 478.
[20] Kwak, S. N. and D. W. Klumpp(2004), Temporal variation in species composition and abundance of fish and decapods in Cockle Bay, North Queensland, Australia, Aquat. Bot., 78, pp. 119-134.
[21] Kwak, S. N., G. W. Baeck and D. W. Klumpp(2005), Comparative feeding ecology of two sympatric greenling species,
Hexagrammos otakii
andHexagrammos agrammus
in eelgrassZostera marina
beds, Environmental Biology of Fishes, Vol. 74, pp. 129-140.[22] Kwak, S. N., G. W. Baeck and S. H. Huh(2004), Feeding habits of
Sillago japonica
in an eelgrass (Zostera maina
) bed, Journal of Fisheries Science and Technology, Vol. 7, pp. 84-89.[23] Kwak, S. N., S. H. Hoi and H. W. Kim(2008), Seasonal variation in species composition and abundance of fish assemblage in the coastal water off Namhae Island, Korean Journal of Ichthyology, Vol. 20, pp. 303-312.
[24] Kwak, S. N. and S. H. Huh(2003), Changes in species composition of fishes in the Nakdong River Estuary, Journal of the Korean Fisheries Society, Vol. 36, pp.
129-135.
[25] Kwak, S. N. and S. H. Huh(2007), Temporal Variation in Species Composition and Abundance of Fish Assemblages in Masan Bay, Korean Journal of Ichthyology, Vol. 19, pp. 132-141.
[26] Kwak, S. N., S. H. Huh and C. G. Choi(2006), Comparison of fish assemblages associated with eelgrass and adjacent unvegetated habitats in Jindong Bay, Korean Journal of Ichthyology, Vol. 18, pp.
119-128.
[27] Lazzari, M. A., S. Sherman, C. S. Brown, J. King, B.
J. Joule, S. B. Chenoweth and R. W. Langton(1999), Seasonal and annual variations in abundance and species composition of two nearshore fish communities in Maine, Estuaries, 22, pp. 636-647.
[28] Masuda, H., K. Amaoka, C. Arago, T. Ueno and T.
Yoshino(eds.)(1984), The fishes of the Japanese Archipelago, Plates, 370 pls, Text, p. 437.
[29] Nakabo, T., M. Aizawa, Y. Aonuma, Akihitio, Y. Ikeda, K. Sakamoto, K. Shimada, H. Senou, K. Hatookka, M.
Hayashi, K. Hosoya, U. Yamada and T. Yoshino(1993), Fishes of Japan with pictorial keys to the species, Tokai University, press, p. 1162.
[30] Oh, S. H.(2003), Species composition and community sturcture of fishes in Kwangyang Bay, Korea, Ph. D.
Thesis, Yeosu National University, Yeosu, Korea, p.
220.
[31] Paperno, R., K. J. Mille and E. Kadison(2001), Patterns in species composition of fish and selected invertebrate assemblages in estuarine subregions near Ponce de Leon Inlet, Florida, Estuarine, Coastal and Shelf Science, Vol. 52, pp. 117-130.
[32] Pianka, E. R.(1973), The structure of lizard communities, Annual Review of Ecology, Evolution, and Systematics, Vol. 4, pp. 53-74.
[33] Shannon, C. E. and W. Weaver(1949), The Mathematical Theory of Communication, Illinois Univ. Press, Urbana, p.
117.
[34] Soh, H. Y. and H. L. Suh(1993), Seasonal Fluctuation of the Abundance of the Planktonic Copepods in Kwangyang Bay, Korean Journal of Environmental Biology, Vol. 11, pp. 26-34.
[35] Yoon C. H.(2002), Fishes of Korea with pictorial key and systematic list. Academy Publisher Co. Seoul, p.
747.
[36] Yoon, S. P.(2006), The eelgrass,
Zostera marina
and its associated macroinvertebrate communities in Gwangyang Bay, Korea, Ph. D. Thesis, Inha University, Incheon, Korea, p. 237.Received : 2012. 03. 19.
Revised : 2012. 04. 23. (1st) : 2012. 05. 07. (2nd) Accepted : 2012. 06. 25.