A Novel Single Nucleotide Polymorphism of the Leptin Receptor Gene Associated with Backfat Thickness in Duroc Pigs
Kyung-Tai Lee
1†, Hae-Young Lee
1†, Bong-Hwan Choi
1, Jong-Joo Kim
2and Tae-Hun Kim
1*
1
Animal Genomics and Bioinformatics Division, National Institute of Animal Science, Rural Development Administration, Wanju 565-851, Korea
2
School of Biotechnology, Yeungnam University, Gyeongsan 712-749, Korea
Received July 23, 2015 /Revised September 13, 2015 /Accepted September 21, 2015
Fatness is one of the most important economic traits in pigs. The leptin receptor (LEPR) gene may be a potential candidate for the fatness quantitative trait locus (QTL) on porcine chromosome 6, due to its position and physiological role. Thus, this study was carried out to evaluate the associations between structural variants in the LEPR gene and economic traits in pigs. We obtained an approx- imately 114-kb sequence containing the complete genomic DNA of the porcine LEPR gene, using shot- gun sequencing of a bacterial artificial chromosome clone. We report the complete genomic structure of the porcine LEPR gene. Dozens of transcription factor-binding sites were found in the 1.2 kb up- stream region from the transcription start point. An association study was performed with 550 Duroc pigs for 24 single-nucleotide polymorphisms (SNPs), including 6 SNPs within exons and 18 SNPs within the putative 5‘ regulatory region of the porcine LEPR gene. Among them, one SNP (-790C/G) was significantly associated with backfat thickness and lean meat percentage, whereas the others, in- cluding two SNPs with missense polymorphisms, had no effect on any phenotype. These results sug- gest that SNP -790C/G may be a useful marker for genetic improvements of fatness and leanness in Duroc pigs.
Key words : Economic trait, leptin receptor, pig, single nucleotide polymorphism
†
Authors contributed equally.
*Corresponding author
*Tel : +82-63-238-7300, Fax : +82-63-238-7347
*E-mail : [email protected]
This is an Open-Access article distributed under the terms of the Creative Commons Attribution Non-Commercial License (http://creativecommons.org/licenses/by-nc/3.0) which permits unrestricted non-commercial use, distribution, and reproduction in any medium, provided the original work is properly cited.
Journal of Life Science 2016 Vol. 26. No. 1. 1~7 DOI : http://dx.doi.org/10.5352/JLS.2016.26.1.1
Introduction
Quantitative trait locus (QTL) mapping has been per- formed to detect chromosomal regions that are associated with production and meat quality traits by crossing pheno- typically divergent breeds. To date, more than 6,800 QTLs representing 585 overlapping phenotypic traits have been deposited in pig QTLdb (http://www.animalgenome.org/
cgi-bin/QTLdb/SS/index). Moreover, several QTLs for growth and fat deposition traits have been identified in a similar region of swine chromosome (SSC) 6 [3, 6, 8, 11, 13, 17, 18, 25]. Subsequently, great efforts have been made to find causal mutations controlling the QTLs through fine mapping or positional candidate gene approaches. However, definite conclusions have not yet been drawn based on those results [1, 12, 19, 20, 25]. The leptin receptor (LEPR) gene
is well known a potential positional candidate gene control- ling QTL for growth and fatness traits in the long arm of SSC6 because of its position and biological function.
Leptin, produced primarily in adipose tissue, is involved in the regulation of feed intake, energy balance, and re- production in mammals [5]. Leptin signaling is mediated via the LEPR, which belongs to the class I cytokine family [23].
Leptin and LEPR genetic variants are associated with obese phenotypes in humans and mice, and the two genes are ex- pected to influence fat deposition in pigs [4]. Associations between LEPR variants and reproductive [2] and fatness traits [12] have been reported in pigs. Ovilo et al. (2005) found a significant association between LEPR alleles and backfat thickness in a narrow region (130–132 cM) of chro- mosome 6 [20]. In recent, Uemoto et al. (2012) detected a significant SNP (c.2002C>T) in exon 14 on fatness traits [24].
All association studies on LEPR have been performed be- tween exonic or intronic mutations and phenotypes in pigs.
A few cDNA sequences and partial sequences of the porcine LEPR have been deposited in GenBank (e.g., AF092422), but the complete genomic organization has not been charac- terized. Moreover, the 5′ regulatory region of the porcine LEPR gene sequence has not been published.
Therefore, this study was carried out to evaluate the por-
cine LEPR gene as a positional candidate controlling the QTL for growth and fat deposition traits on SSC6. In addition, we report the complete genomic structure containing the 5′
regulatory region of the porcine LEPR gene.
Materials and Methods
Ethics statement
The study protocol and standard operating procedures were reviewed and approved by the Institutional Animal Care and Use Committee of the National Institute of Animal Science (No. 2009-077, C-grade).
Isolation of a bacterial artificial chromosome clone containing the porcine LEPR gene
A bacterial artificial chromosome (BAC) clone containing the LEPR gene was obtained from the Korean native pig (KNP) BAC library [10] using a polymerase chain reaction (PCR) screening method. A BAC clone containing the LEPR gene was screened with LEPR-CA STS (UniSTS: 253565, Forward: 5‘-TTCCAGAAACATAAGACACGCG-3‘, Reverse:
5’- GACCAATTCTAAATTTCAACCAGAGG-3‘). A shotgun library of the screened BAC clone, KNP_645H8, was con- structed using the pUC19 plasmid vector (Qbiogene, Irvine, CA, USA). The sequence was obtained using an ABI PRISM BigDye Terminator Cycle Sequencing Kit (Applied Biosys- tems, Foster City, CA, USA) and an ABI PRISM3730 Genetic Analyzer (AppliedBiosystems). The DNA sequences were assembled with Phred and Phrap software (University of Washington). The assembled sequence was deposited into GenBank of NCBI (FN673752).
Structural analysis of the porcine LEPR gene Exon-intron boundaries of the LEPR gene on the sequence of BAC clone were determined by comparing with the por- cine mRNA sequence (AF092422). Potential transcription fac- tor-binding sites in the 5‘ upstream region were predicted using the TRANSFAC 8.4 professional program. The puta- tive promoter sequence of the porcine LEPR gene was aligned with the human (AC097063) and mouse (AL929373) sequences using the ClustalW2 program (http://www.ebi.
ac.uk/Tools/msa/clustalw2/) to investigate consensus se- quences within the promoter regions among species.
Single nucleotide polymorphism discovery
Single nucleotide polymorphisms (SNPs) within exons
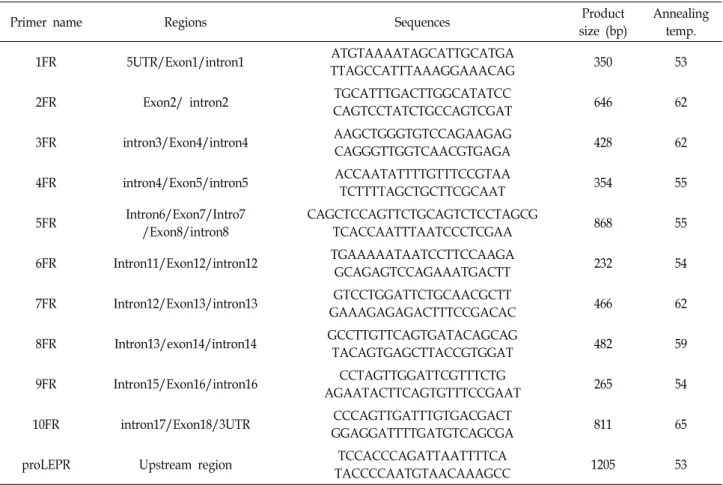
and a putative promoter region were detected by direct se- quencing of the samples pooled from five different breeds, including the Korean native pig, Berkshire, Duroc, Landrace, and Yorkshire. Eleven pairs of primers covering 1.2 kb up- stream and 11 exon regions were designed based on the BAC clone sequence obtained (Table 1). The PCR reaction was performed in a 50 μL final volume containing 50 ng template DNA, 50 mM KCl, 10 mM Tris-HCl (pH 8.3), 0.5 mM MgCl
2, 0.2 μM each primer, 100 µM each dNTP, and one unit Taq DNA polymerase (GeNet Bio, Korea). Reaction profiles in- cluded a 5 min denaturation step at 94°C followed by 35 cycles each consisting of 30 s at 94°C, 30 s at the annealing temperature (Table 1), 1 min at 72°C, and then a final 10 min extension step at 72°C using a PTC-225 Peltier Thermal Cycler (MJ Research, Waltham MA, USA).
The PCR products were cleaned up with a QIAquick PCR purification Kit (Qiagen, Hilden, Germany) and sequenced with the respective PCR primers using BigDye Terminator Cycle Sequencing Kit version 3.2(Applied Biosystems, USA) and an 3730XL DNA Analyzer (AppliedBiosystems). SNPs were identified by multiple alignments of sequence chroma- tograms generated with each primer pair using SeqMan pro- gram of Lasergene package (DNASTAR, USA).
Genotyping and phenotypes
In total 1,014 pigs from nine different breeds including
western breeds (Berkshire, Duroc, Landrace, and Large
White), the Korean native pig, the Korean wild pig, and
Chinese breeds (Xiang, Min, and Wuzhishan pig) were used
to investigate the allelic frequencies of SNPs. The traits ana-
lyzed in this study were average daily weight gain, feed effi-
ciency, backfat thickness, and lean meat percentage. Blood
samples were collected from 550 Duroc pigs at the Pig
Breeding Stock Evaluation Center of the Korean Swine
Association in Korea for the association test. Genomic DNAs
were extracted with the Wizard Genomic DNA Purification
Kit (Promega, Madison, WI, USA). PCR reactions were per-
formed in a 25 μl final volume containing 25 ng template
DNA, 50 mM KCl, 10 mM Tris-HCl (pH 8.3), 0.5 mM MgCl
2,
0.2 μM each primer, 100 μM each dNTP, and one unit Taq
DNA polymerase (GeNet Bio) for genotyping of the 18 SNPs
in the promoter region and the 6 SNPs in the exon region
(Table 2). Thermal cycling parameters were defined as fol-
lows: pre-denaturation at 95°C for 5 min, followed by 35
cycles of 95°C for 30 s, annealing temperature for 30 s (Table
1), 72°C for 1 min, and then a final step at 72°C for 10 min
Table 1. List of primer sequences used to amplify the porcine LEPR gene
Primer name Regions Sequences Product
size (bp)
Annealing temp.
1FR 5UTR/Exon1/intron1 ATGTAAAATAGCATTGCATGA
TTAGCCATTTAAAGGAAACAG 350 53
2FR Exon2/ intron2 TGCATTTGACTTGGCATATCC
CAGTCCTATCTGCCAGTCGAT 646 62
3FR intron3/Exon4/intron4 AAGCTGGGTGTCCAGAAGAG
CAGGGTTGGTCAACGTGAGA 428 62
4FR intron4/Exon5/intron5 ACCAATATTTTGTTTCCGTAA
TCTTTTAGCTGCTTCGCAAT 354 55
5FR Intron6/Exon7/Intro7
/Exon8/intron8
CAGCTCCAGTTCTGCAGTCTCCTAGCG
TCACCAATTTAATCCCTCGAA 868 55
6FR Intron11/Exon12/intron12 TGAAAAATAATCCTTCCAAGA
GCAGAGTCCAGAAATGACTT 232 54
7FR Intron12/Exon13/intron13 GTCCTGGATTCTGCAACGCTT
GAAAGAGAGACTTTCCGACAC 466 62
8FR Intron13/exon14/intron14 GCCTTGTTCAGTGATACAGCAG
TACAGTGAGCTTACCGTGGAT 482 59
9FR Intron15/Exon16/intron16 CCTAGTTGGATTCGTTTCTG
AGAATACTTCAGTGTTTCCGAAT 265 54
10FR intron17/Exon18/3UTR CCCAGTTGATTTGTGACGACT
GGAGGATTTTGATGTCAGCGA 811 65
proLEPR Upstream region TCCACCCAGATTAATTTTCA
TACCCCAATGTAACAAAGCC 1205 53
Table 2. Exon-intron organization of the porcine LEPR gene
Exon cDNA
(AF092422)
Exon size
(bp) Intron Intron size
(kb) Exon cDNA
(AF092422)
Exon size
(bp) Intron Intron size (kb) 1
2 3 4 5 6 7 8 9
1-55 56-385 386-509 510-718 719-8864 864-1009 1010-1300 1301-1418 1419-1618
55 330 124 209 146 145 291 118 200
1 2 3 4 5 6 7 8 9
5.084 1.878 7.174 4.291 2.573 5.874 0.166 2.627 3.427
10 11 12 13 14 15 16 17 18
1619-1767 1768-1927 1928-2010 2011-2227 2228-2410 2411-2506 2507-2609 2610-2685 2686-4032
149 160 83 217 183 96 103
76 1347
10 11 12 13 14 15 16 17
1.114 0.615 3.355 1.956 1.667 1.579 1.455 13.974
using a PTC 225 Peltier Thermal Cycler (MJ Research).
Genotypes of 550 samples were determined by PCR-re- striction fragment length polymorphism (PCR-RFLP) analy- ses using Tsp509I, HpycH4III, NdeI, AciI, DraIII, and Sau3AI (Table 2) for exonic mutations and direct sequencing for SNPs within the upstream region.
Statistical analysis
Data were analyzed with the general linear model proce- dure using SAS (SAS Institute, Cary, NC, USA) to test the
effect of each genotype on performance traits. Mean differ-
ences were established based on the least squares means
comparison. A p-value <0.05 was considered significant. The
formula for analyzing traits was Y=Xβ+M+e, where Y is the
phenotype vector; X and β are the design matrix and sol-
ution vector for fixed effects including year/season of birth
and gender and the performance testing period (days) co-
variate, respectively; M is a 3×1 vector of the genotype ef-
fects; and e is a residuals vector.
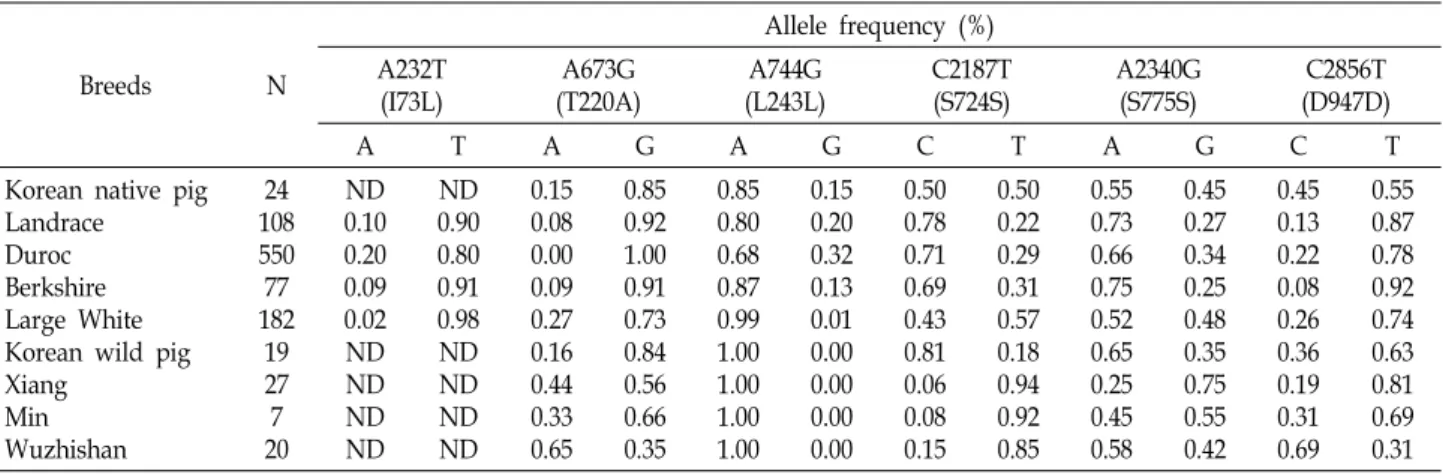
Table 3. Allelic frequencies of the porcine LEPR exonic variations in nine pig breeds ND: Not determined
Breeds N
Allele frequency (%) A232T
(I73L)
A673G (T220A)
A744G (L243L)
C2187T (S724S)
A2340G (S775S)
C2856T (D947D)
A T A G A G C T A G C T
Korean native pig Landrace
Duroc Berkshire Large White Korean wild pig Xiang
Min Wuzhishan
24 108 550 77 182
19 27 7 20
ND 0.10 0.20 0.09 0.02 ND ND ND ND
ND 0.90 0.80 0.91 0.98 ND ND ND ND
0.15 0.08 0.00 0.09 0.27 0.16 0.44 0.33 0.65
0.85 0.92 1.00 0.91 0.73 0.84 0.56 0.66 0.35
0.85 0.80 0.68 0.87 0.99 1.00 1.00 1.00 1.00
0.15 0.20 0.32 0.13 0.01 0.00 0.00 0.00 0.00
0.50 0.78 0.71 0.69 0.43 0.81 0.06 0.08 0.15
0.50 0.22 0.29 0.31 0.57 0.18 0.94 0.92 0.85
0.55 0.73 0.66 0.75 0.52 0.65 0.25 0.45 0.58
0.45 0.27 0.34 0.25 0.48 0.35 0.75 0.55 0.42
0.45 0.13 0.22 0.08 0.26 0.36 0.19 0.31 0.69
0.55 0.87 0.78 0.92 0.74 0.63 0.81 0.69 0.31
Results and Discussion
Positional and biological candidate gene studies may help identify genes responsible for phenotypic variation. In par- ticular, positional candidate gene analyses are intended to evaluate whether a positional candidate gene is effective on some QTL or closely linked to the QTL. Association studies yield significant results when an SNP within a candidate gene is a causal variation or in linkage disequilibrium with it [20]. This study was conducted to evaluate the influence of variations in the porcine LEPR gene on production traits in pigs. This is the first report providing evidence for the effect of one SNP in the 5' regulatory region on production traits in a Duroc population. Moreover, we revealed the complete genomic sequences including the 5' regulatory re- gion in the porcine LEPR gene.
Genomic structure of the porcine LEPR gene We screened a BAC clone (KNP_645H8) containing the LEPR-CA microsatellite marker and obtained an approx- imate 114 kb sequence (GenBank acc. no. FN673752) using the shotgun sequencing method. The complete genomic structure of the LEPR gene including a putative promoter region was revealed by comparison with the porcine cDNA sequence (AF092422). As shown in Table 2, the porcine LEPR gene was organized with 18 exons spanning approximately 63 kb of genomic DNA. Exon 18 was the longest, represent- ing 1,347 bp. The intron sizes of the LEPR gene were in the range of 166 bp to approximately 14 kb. The translation ini- tiation codon was located in exon 1. In addition, all exon/in- tron boundary sequences followed the GT-AG rule for splice-donor and acceptor sites reported by Jacob and Gallinaro (1989) [9]. The putative transcriptional factor bid-
ing sites included activating protein-1, CCAAT-enhancer- binding protein (C/EBP)-α, peroxisome proliferator-acti- vated receptor (PPAR)-α, retinoid X receptor-α, and nuclear factor (NF)-kB (data not shown). Multiple potential tran- scription factor-binding sites were also identified in the por- cine LEPR promoter region and might be responsible for transcriptional regulation of the porcine LEPR gene. The TATA box (CTTATATATA) was predicted in the region 52 bp upstream from the transcription initiation start point by the WebGene program.
Discovery of SNPs
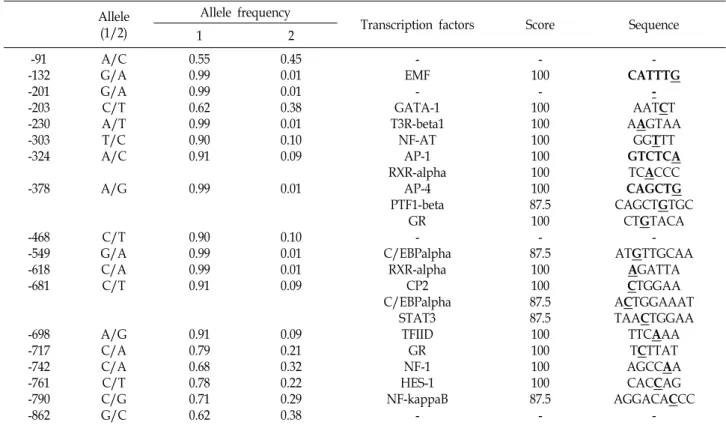
A total of eleven primer sets were used to amplify ten exonic regions and the upstream region of exon1 of the por- cine LEPR gene (Table 1). Thirty six SNPs were identified by direct sequencing. Within 1,345 amino acids of the CDS of the porcine LEPR gene (AF092422), two nonsynonymous (I73L and T220A) and four synonymous (L243L, S724S, S775S, and D947D) mutations were found within the exon region (Table 3). Eighteen SNPs were polymorphic in the 5' regulatory region of the Duroc population. Thirty SNPs were initially discovered in the 5' regulatory region, of which only 18 loci were polymorphic in the Duroc breed (Table 4). Furthermore, most of the SNP sites were involved in a putative transcription factor-binding sequence (Table 4).
The causal mutation in the regulatory region is critical for regulating gene expression, because transcriptional control is mediated mainly through the interactions of regulatory transcription factors with their cognate enhancer elements Novina & Roy, 1996).
Several studies for the effect of LEPR gene variants on
phenotypes in pigs have been performed [2, 12, 15, 16, 19,
20]. Ovilo et al. (2005) reported that a missense mutation
Table 4. SNPs position, allele frequencies and transcription factor binding sites of 5’ regulatory region of the porcine LEPR gene in Duroc breed
Allele (1/2)
Allele frequency
Transcription factors Score Sequence
1 2
-91 -132 -201 -203 -230 -303 -324 -378
-468 -549 -618 -681
-698 -717 -742 -761 -790 -862
A/C G/A G/A C/T A/T T/C A/C A/G
C/T G/A C/A C/T
A/G C/A C/A C/T C/G G/C
0.55 0.99 0.99 0.62 0.99 0.90 0.91 0.99
0.90 0.99 0.99 0.91
0.91 0.79 0.68 0.78 0.71 0.62
0.45 0.01 0.01 0.38 0.01 0.10 0.09 0.01
0.10 0.01 0.01 0.09
0.09 0.21 0.32 0.22 0.29 0.38
- EMF
- GATA-1 T3R-beta1
NF-AT AP-1 RXR-alpha
AP-4 PTF1-beta
GR - C/EBPalpha
RXR-alpha CP2 C/EBPalpha
STAT3 TFIID
GR NF-1 HES-1 NF-kappaB
-
- 100
- 100 100 100 100 100 100 87.5 100 - 87.5
100 100 87.5 87.5 100 100 100 100 87.5 -
- CATTTG
- AATCT AAGTAA
GGTTT GTCTCA TCACCC CAGCTG CAGCTGTGC
CTGTACA - ATGTTGCAA
AGATTA CTGGAA ACTGGAAAT TAACTGGAA
TTCAAA TCTTAT AGCCAA CACCAG AGGACACCC
-
(L663F) for the backfat thickness trait in exon 14 of the LEPR gene is significantly associated in multiple generations of an Iberian × Landrace intercross [20]. Mackowski et al. (2005) reported that three SNPs in exon 4 have no direct effect on fatness traits in Polish Landrace and the 990 synthetic line but that the A allele at locus 232T/A is significantly asso- ciated with thicker backfat over the shoulder in Polish Landrace [12]. Chen et al. (2004) reported that synonymous mutations of P300P in exon 6 and D947D in exon 18 are significantly associated with backfat thickness (p<0.05) in Landrace and Yorkshire, respectively, and that the effect of the SNP in exon 18 is significant for feed efficiency in Duroc [2]. However, no significant effect of the SNP variants on average daily weight gain was observed in the present study. Chen et al. (2004) reported that the associations among intron 2 and exons 2 and 18 polymorphisms and re- productive traits were significant in Duroc and Yorkshire [2]. In recently, a SNP (c.987C>T) of the porcine LEPR gene was significantly associated with feed intake, growth and fatness traits in pigs [15]. However, we did not find any effects of the exonic mutations on phenotypes. These incon- sistent results might be due to the different samples used in this and previous studies.
Allelic frequencies and association analysis Allelic frequencies of these exonic polymorphisms were investigated in nine different pig breeds (Table 3). These polymorphisms were present in almost all breeds, except for the T220A polymorphism in Duroc and the L243L poly- morphism in the Korean wild pig and the Chinese breeds.
The allelic frequency of each locus showed different patterns among the pig breeds. Half of all SNPs in the 5' regulatory region were not informative in Duroc (Table 4). Dozens of transcription factor-binding sites were predicted in the 5' regulatory region of the porcine LEPR gene. Among them, specificity protein 1 and C/EBP sites have been found in the human leptin gene promoter [7], and C/EBPa and PPARg modulate the expression of the human leptin gene [14, 21]. In addition, the transcription factors NFkB, liver X receptor, and hepatocyte nuclear factor-4α play important roles regulating gene expression of lipid metabolism [22].
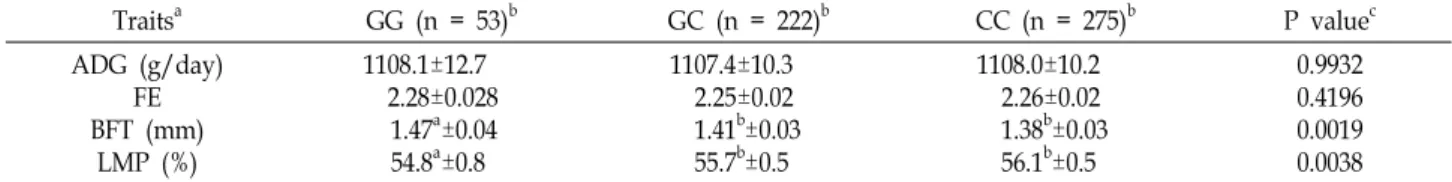
A total of 550 pure Duroc pigs were genotyped on 24
SNPs including 6 SNPs on the exonic regions and 18 SNPs
in the regulatory region for the association study. Only one
SNP at the -790C/G polymorphism on the regulatory region
in the LEPR gene was significantly associated with pro-
duction traits such as backfat thickness (p<0.001) and lean
Table 5. Effect of the mutation (-790C/G) on productive traits in Duroc breed
Traits
aGG (n = 53)
bGC (n = 222)
bCC (n = 275)
bP value
cADG (g/day) FE BFT (mm)
LMP (%)
1108.1±12.7 2.28±0.028 1.47
a±0.04 54.8
a±0.8
1107.4±10.3 2.25±0.02 1.41
b±0.03 55.7
b±0.5
1108.0±10.2 2.26±0.02 1.38
b±0.03 56.1
b±0.5
0.9932 0.4196 0.0019 0.0038
a
ADG; average daily gain, FE; feed efficiency, BFT; back fat thickness, LMP; lean meat percentage
b
Least square means with different letters indicate were different with statistical significance (p<0.05)
c