© 2014 The Korean Ophthalmological Society
This is an Open Access article distributed under the terms of the Creative Commons Attribution Non-Commercial License (http://creativecommons.org/licenses /by-nc/3.0/) which permits unrestricted non-commercial use, distribution, and reproduction in any medium, provided the original work is properly cited.
Original Article
Depth and Area of Retinal Nerve Fiber Layer Damage and Visual Field Correlation Analysis
Wool Suh1, Jung Min Lee2, Changwon Kee3
1Department of Ophthalmology, Dongtan Hallym University Sacred Heart Hospital, Hallym University College of Medicine, Hwaseong, Korea
2Kong Eye Clinic, Seoul, Korea
3Department of Ophthalmology, Samsung Medical Center, Sungkyunkwan University School of Medicine, Seoul, Korea
Purpose: To evaluate the relationship between the structural damage as assessed by time-domain optical co- herence tomography (OCT) and functional changes in glaucoma.
Methods: In total, 190 patients with normal tension glaucoma or primary open angle glaucoma were included in this study. The thickness of retinal nerve fiber layer (RNFL) around the optic disc and the area of RNFL defect were determined using OCT scans. The relationships between the RNFL thickness or area of the defect and visual field (VF) indices were assessed using the Lowess function, regression analysis and partial Spearman correlation. The differences between these associations depending on the stage of VF damage were further analyzed. Age, optic disc size, refraction, central corneal thickness and the presence of systemic disease were corrected for in order to exclude confounding factors.
Results: A logarithmic scale of RNFL thickness showed a negative linear relationship with VF indices. The area of the RNFL defect showed a weak correlation with the pattern of standard deviation, whereas the remnant RNFL thickness was moderately correlated with the pattern of standard deviation (partial Spearman correlation coefficient, 0.39, -0.47, respectively; p < 0.0001). Many outliers were detected in the Lowess-plotted graphs.
Multiplication of the area and the inverted RNFL thickness showed a moderately correlated logarithmic relation- ship with the VF indices (partial Spearman correlation coefficient, 0.46; 95% confidence interval, 0.34 to 0.57; p
< 0.0001). In the severe stage of VF damage, correlation between the area of the RNFL defect and mean devi- ation was significantly greater than in other stages (partial Spearman correlation coefficient, -0.66; p = 0.02).
Conclusions: The thickness of the RNFL had a negative logarithmic correlation with the VF indices and was more relevant to the VF indices than the area of the RNFL defect, as measured by OCT.
Key Words: Glaucoma, Retinal nerve fiber layer, Visual fields
Glaucoma is a progressive optic neuropathy characterized by structural changes of the optic nerve and retina that are
associated with visual functional defects [1]. However, as Hood and Kardon [1] mentioned, there is no consensus re- garding the relationship between the functional loss of sensitivity to light and the structural loss of retinal gangli- on cell axons. Many studies have reported various results for this topic, depending on the imaging techniques and statistical methods used, as well as the subject groups in- vestigated and other factors. Leung et al. [2] reported that
Received: October 23, 2013 Accepted: December 20, 2013
Corresponding Author: Changwon Kee, MD, PhD. Department of Oph- thalmology, Samsung Medical Center, Sungkyunkwan University School of Medicine, #81 Irwon-ro, Gangnam-gu, Seoul 135-710, Korea. Tel: 82-2- 3410-3564, Fax: 82-2-3410-0074, E-mail: [email protected]
the coefficient of correlation between visual field (VF) mean deviation (MD) and average retinal nerve fiber layer (RNFL) thickness was 0.79 and that this structure-function relationship was primarily investigated using linear regres- sion analysis. However, a nonlinear function for describing the structure-function relationship was suggested to be better than linear functions, using a confocal laser oph- thalmoscope and time-domain (TD) optical coherence to- mography (OCT) to quantify the structures [3]. Gar- way-Heath et al. [4] reported a curvilinear relationship between the decibel differential light sensitivity and both the pattern electroretinogram amplitude and neuroretinal rim area, as well as a linear relationship between 1/Lam- bert differential light sensitivity and the pattern electro- retinogram amplitude and neuroretinal rim area. Another previous study reported that the structure-function rela- tionship is linear when the decibel scale from the VF is converted to a linear (1/Lambert) scale [1,4].
We sometimes encounter patients with similar retinal nerve fiber defect lesions who show different functional deficits, or those who show a clinical discrepancy between the structural damage and the VF defect. In order to ac- count for these inconsistencies, initial quantitative RNFL defect-VF damage analysis is needed. An RNFL defect le- sion has a three-dimensional structure, but most studies focused on the RNFL thickness only. Therefore, we divid- ed the concept of the ‘RNFL defect lesion’ into two com- ponents, the depth and the area of the RNFL defect, and then analyzed the structure-function relationship via the two components.
Materials and Methods
This study was conducted in compliance with the tenets of the Declaration of Helsinki for the use of human sub- jects in biomedical research, and institutional review board approval was obtained. The medical records of patients with primary open angle glaucoma or normal tension glau- coma were reviewed. All patients underwent full ophthal- mic examinations including assessment of the visual acui- ty, refraction and slit-lamp biomicroscopy, intraocular pressure with Goldmann applanation tonometry, goniosco- py, binocular optic disc evaluation, fundus photography, ultrasonic pachymetry (Humphrey ultrasonic pachometer model 850; Humphrey Instruments, San Leandro, CA,
USA), Heidelberg retina tomography (HRT II; Heidelberg Engineering, Heidelberg, Germany), TD-OCT and a VF test (Humphrey Visual Field Analyzer [Carl Zeiss, Dublin, CA, USA] using the Swedish interactive thresholding algorithm standard 30-2 perimetry). Accompanying sys- temic diseases were evaluated in all patients using a ques- tionnaire. The diagnostic criteria for glaucoma were as fol- lows: open angle, glaucomatous optic disc damage and an abnormal VF test result consisting of a pattern of standard deviation (PSD) of <5%, glaucoma hemifield test results that were outside the normal limits, or both of these find- ings in at least two consecutive, reliable examinations. Pa- tients under 18 years of age or with best corrected visual acuity of <20 / 40, inflammatory eye disease, exfoliation or pigment dispersion syndrome, ocular trauma, disease involving the retina and choroid or non-glaucomatous optic neuropathy or VF loss were excluded.
Optic disc size was measured using the HRT II. The depth of the RNFL defect was substituted with the rem- nant RNFL thickness measured with OCT, taking into consideration that the generally remnant thickness is sus- pected to be reciprocally related to the depth. The real depth of the RNFL defect is calculated by subtraction from the normal RNFL thickness and getting the remnant RNFL thickness. However, the normal RNFL thickness varies individually, and the use of the average RNFL value in previous studies could be one of the confounding factors in this study. The area of the RNFL defect was recorded by the clock hour unit from the OCT results. The perime- try and OCT examinations were performed within a maxi- mum period of 1 month. Statistical analysis was executed using SAS ver. 9.1.3 (SAS Institute, Cary, NC, USA) and R 2.13.2 (Lucent Technologies, Vienna, Austria; http://www.
R-project.org). The relationship between the VF indices and the area of the RNFL/RNFL thickness/multiplication of the area and inverted RNFL thickness were plotted us- ing the Lowess function, respectively. Multiplication of the area and inverted thickness was hypothesized to reflect the cube of the RNFL defect. The point of the RNFL thick- ness or area that showed a rapid change in the slope was calculated. We further analyzed these correlations depend- ing on the stage of the VF defect according to the Hodapp-Parrish-Anderson classifications [5]. Partial Spear- man correlation analysis with 95% confidence intervals (CIs) calculated using Fisher’s z transformation and the z-test were used to assess whether the extent of correlation
showed a difference according to the stage of the VF de- fect. Multiple linear regression tests were conducted, cor- recting for optic disc size, age, sex, refractive error, central corneal thickness and systemic disease. When the normali- ty test was not satisfied, the residuals plot was reconfirmed, and we calculated the partial Spearman correlation. A p-value was corrected by Bonferroni’s method due to mul- tiple testing and a p-value of less than 0.05 was considered statistically significant.
Results
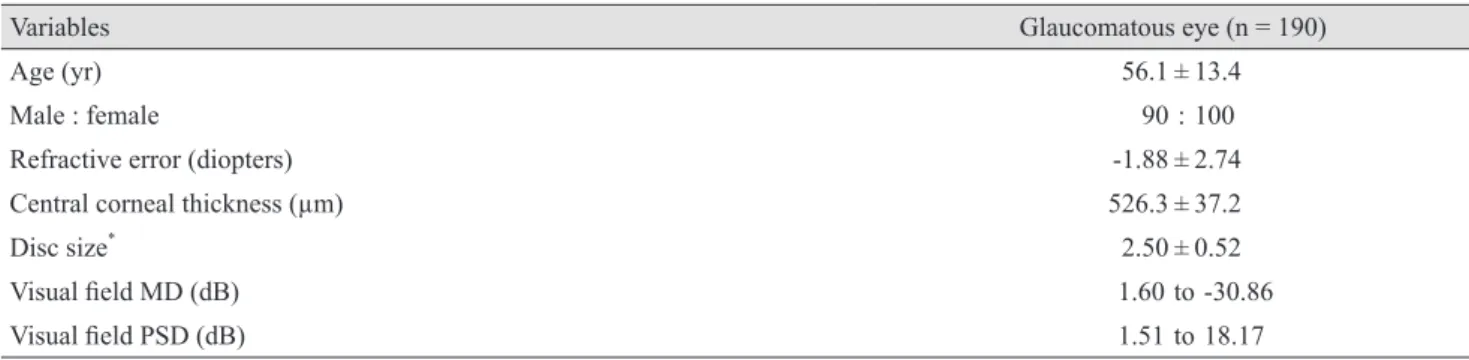
A total of one hundred and ninety patients with primary open angle glaucoma (n = 81) and normal tension glauco- ma (109) were enrolled in the study (Table 1). The clinical findings of the subjects were as follows (average ± stan- dard deviation): age, 56.16 ± 13.44 years; refractive error, -1.88 ± 2.74 diopters; central corneal thickness, 526.36 ± 37.29 μm; disc size, 2.50 ± 0.52; and the rate of accompa- nying systemic disease, 25.79%. The average RNFL thick- ness was 62.86 ± 13.99 and the average area of the RNFL defect was 3.65 ± 2.48. The MD index of the VF ranged from 1.6 to -30.86, and the PSD from 1.51 to 18.17. In the classification of the stage, seventy-eight eyes had early de- fects, forty-nine eyes had moderate defects and sixty-three eyes had severe defects.
Retinal nerve fiber layer thickness-visual field index correlation analysis
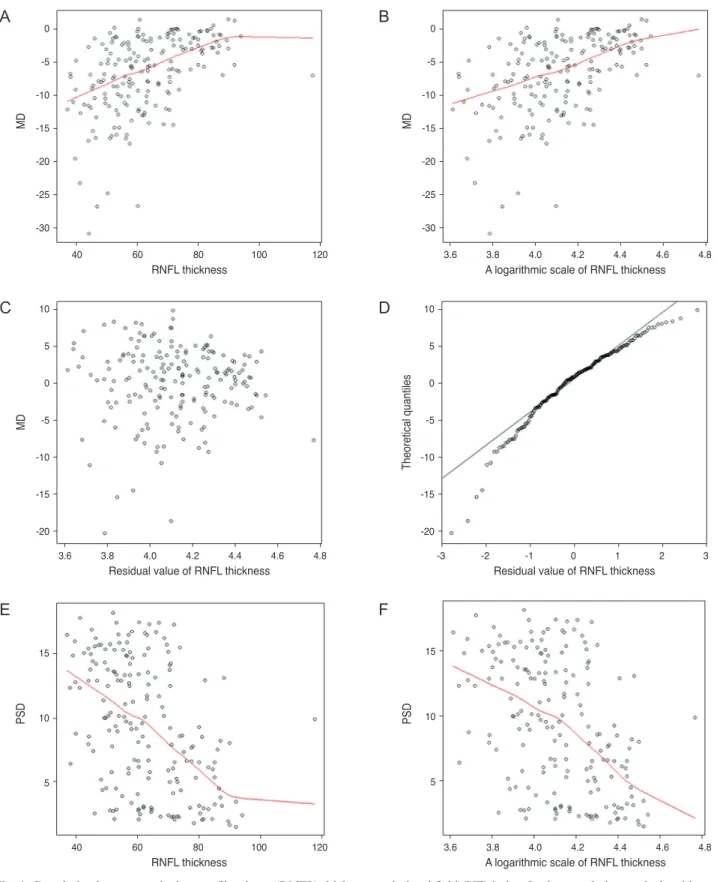
In the correlation analysis with MD, the slope of the RNFL thickness rapidly changed around the numerical value of
81 (Fig. 1A). A logarithmic scale of the RNFL thickness showed a negative linear relationship with the MD index of VF (Fig. 1B). When the residual RNFL thickness was plot- ted, normality was not satisfied and many outliers were found (Fig. 1C and 1D). RNFL thickness and MD were moderately correlated (partial Spearman correlation coeffi- cient, 0.52015; 95% CI, 0.4048 to 0.6175; p < 0.0001). The correlation between RNFL thickness and MD was not sig- nificantly different depending on the stage of the VF defect (adjusted p-value of early vs. moderate, early vs. severe and moderate vs. severe stages = 1, 1 and 0.82, respectively).
The slope of the line changed rapidly at the point when the RNFL thickness was 84.25 (Fig. 1E) and was moder- ately correlated (partial Spearman correlation coefficient, -0.47312; 95% CI, -0.577342 to -0.351454; p < 0.0001). The Lowess plot of the RNFL thickness and PSD suggested a logarithmic relationship (Fig. 1F). The correlation between RNFL thickness and PSD was also not significantly differ- ent depending on the stage of the VF defect (adjusted p-value of early vs. moderate, early vs. severe and moder- ate vs. severe stages = 0.99, 1 and 0.90, respectively).
Area of retinal nerve fiber layer defect-visual field index correlation analysis
The area of the RNFL defect showed a negative linear relationship with the MD and this correlation was moder- ate (partial Spearman correlation coefficient, -0.50897;
95% CI, -0.60793 to -0.392089; p < 0.0001) (Fig. 2A). How- ever, in the relationship with the PSD, the area of the RNFL defect showed a weakly logarithmic scale correla- tion, as shown by the Lowess plot (partial Spearman cor- relation coefficient, 0.39766; 95% CI, 0.267438 to 0.512024;
Table 1. Clinical characteristics of the study participants
Variables Glaucomatous eye (n = 190)
Age (yr) 56.1 ± 13.4
Male : female 90 : 100
Refractive error (diopters) -1.88 ± 2.74
Central corneal thickness (µm) 526.3 ± 37.2
Disc size* 2.50 ± 0.52
Visual field MD (dB) 1.60 to -30.86
Visual field PSD (dB) 1.51 to 18.17
MD = mean deviation; dB = decibel; PSD = pattern standard deviation.
*Disc size was measured by Heidelberg retina tomography (HRT II).
Fig. 1. Correlation between retinal nerve fiber layer (RNFL) thickness and visual field (VF) index. In the correlation analysis with mean deviation (MD), the slope of RNFL thickness changed rapidly around the numerical value of 81 (A). A logarithmic scale of the RNFL thickness showed a negative linear relationship with the MD index of the VF (B). When the residual of the RNFL thickness was plotted, the normality was not satisfied and many outliers were present (C,D). The slope of the pattern of standard deviation (PSD) line changed rapidly at the point when the RNFL thickness was 84.25 (E). The Lowess plot of the RNFL thickness and PSD suggested a logarithmic relationship (F).
40 -30 -25 -20
MD -15
RNFL thickness -10
-5 0
60 80 100 120 3.6 3.8 4.0 4.2 4.4 4.6 4.8
-30 -25 -20
MD -15
A logarithmic scale of RNFL thickness -10
-5 0
3.6 3.8 4.0 4.2 4.4 4.6 4.8
-20 -15 -10 -5 0 5 10
MD
Residual value of RNFL thickness
-20 -15 -10 -5 0 5 10
Theoretical quantiles
-3 -2 -1 0 1 2 3
Residual value of RNFL thickness
40 5 10 15
PSD
RNFL thickness
60 80 100 120 3.6 3.8 4.0 4.2 4.4 4.6 4.8
5 10 15
PSD
A logarithmic scale of RNFL thickness 40
-30 -25 -20
MD -15
RNFL thickness -10
-5 0
60 80 100 120 3.6 3.8 4.0 4.2 4.4 4.6 4.8
-30 -25 -20
MD -15
A logarithmic scale of RNFL thickness -10
-5 0
3.6 3.8 4.0 4.2 4.4 4.6 4.8
-20 -15 -10 -5 0 5 10
MD
Residual value of RNFL thickness
-20 -15 -10 -5 0 5 10
Theoretical quantiles
-3 -2 -1 0 1 2 3
Residual value of RNFL thickness
40 5 10 15
PSD
RNFL thickness
60 80 100 120 3.6 3.8 4.0 4.2 4.4 4.6 4.8
5 10 15
PSD
A logarithmic scale of RNFL thickness
A
C
E
B
D
F
p < 0.0001) (Fig. 2B and 2C). The slope of the line became stable after the area of the RNFL defect lesion passed 6 o’clock. In the glaucomatous stages, the RNFL defect area in the severe stage was more negatively correlated with the MD index than in the moderate stage (partial Spearman correlation coefficient, -0.66; adjusted p-value, 0.02). There was no significant difference in the correlation between the early and moderate stages (adjusted p-value, 1). The correlation between the area of the RNFL defect and PSD was not significantly different compared to the glaucoma- tous stage (adjusted p-value of early vs. moderate, early vs.
severe and moderate vs. severe stages = 0.99, 1 and 0.99, respectively).
Multiplication of the area and inverted retinal nerve fi- ber layer thickness-visual field index correlation analysis
The multiplication values showed a logarithmic relation- ship with MD and were moderately correlated (partial Spearman correlation coefficient, 0.56314; 95% CI, -0.653602 to -0.4543712; p < 0.0001). When calculated with PSD, the multiplication value also showed a logarithmic relationship and a moderate correlation (partial Spearman correlation coefficient, 0.46729; 95% CI, 0.344899 to 0.572344; p < 0.0001).
Discussion
In the glaucoma field, there is no absolute agreement concerning which models, linear or nonlinear, yield the best correlation between structural and functional damage.
The structure-function relationship has been evaluated in various ways, including confocal scanning laser ophthal- moscopy, scanning laser polarimetry, OCT and histologic studies [6-8]. The onset timing of RNFL defect and VF de- fects is still controversial. Several studies determined that the structural alterations appeared before the development of VF defects [9,10]. However, as the disease progresses, functional measures may prove more sensitive for detect- ing progressive damage because alterations in the structure of the optic disc approach a state of absolute cupping, which, when reached, indicates the end stage of the disease [11]. The concept of ‘structure and functional correlation’
is vague since it may simply reflect the correlation itself, the relationship between the preceding and the forwarding Fig. 2. Correlation between retinal nerve fiber layer (RNFL) defect
range and visual field index. The area of the RNFL defect showed a negative linear relationship with the mean deviation (MD) (A).
However, in the relationship with pattern of standard deviation (PSD), the area of the RNFL defect showed a logarithmic scale correlation, as shown by a Lowess plot (B,C).
2 4 6 8 10 12
-30 -25 -20
MD -15
Area of RNFL defect -10
5 0
2 4 6 8 10 12
5 10 15
PSD
Area of RNFL thickness defect
0.0 5 10 15
PSD
A logarithmic scale of the RNFL thickness defect range
0.5 1.0 1.5 2.0 2.5
2 4 6 8 10 12
-30 -25 -20
MD -15
Area of RNFL defect -10
5 0
2 4 6 8 10 12
5 10 15
PSD
Area of RNFL thickness defect
0.0 5 10 15
PSD
A logarithmic scale of the RNFL thickness defect range
0.5 1.0 1.5 2.0 2.5
2 4 6 8 10 12
-30 -25 -20
MD -15
Area of RNFL defect -10
5 0
2 4 6 8 10 12
5 10 15
PSD
Area of RNFL thickness defect
0.0 5 10 15
PSD
A logarithmic scale of the RNFL thickness defect range
0.5 1.0 1.5 2.0 2.5
A
B
C
or a mathematical correlation.
In our study, the authors divided the concept of the
‘RNFL defect’ into two aspects, RNFL thickness and the area of the RNFL defect. We detected a moderately cor- related logarithmic relationship between the RNFL thick- ness and the VF indices, when corrected for age, central corneal thickness, refractive error, optic disc size and sys- temic disease. Additionally, the PSD index was more strongly correlated with the RNFL thickness than with the area of the RNFL defect, even when considering the scale difference between the thickness and area. The multiplica- tion value also demonstrated a moderately correlated loga- rithmic relationship with the VF indices. When analyzing these correlations according to glaucomatous stages, the correlation between the area of the RNFL defect and MD was significantly stronger in the severe stage than in the mild and moderate stages, whereas the correlation between RNFL thickness and MD did not differ according to glau- comatous stage. Kanamori et al. [12] reported a significant relationship between the MD and RNFL thickness in all parameters excluding the 3-o’clock area. Recently, Leite et al. [13] reported that the relationship was strongest for su- perotemporal RNFL thickness and inferonasal sensitivity (R2 = 0.314, p < 0.001), using the cirrus spectral domain (SD) OCT. In addition, Lee et al. [14] reported no correla- tion between retinal mean sensitivity (MS) and RNFL thickness in normal, glaucoma suspects. However, in glau- comatous eyes, the association with TD-OCT and the cor- relation of superior RNFL thickness with inferior MS was significantly better with SD-OCT than with TD-OCT in both linear and logarithmic regression models. In this study, the slope of MD more rapidly dropped at an RNFL thickness of 81, and PSD slope became stable after the RNFL thickness decreased below 84.25, implying that an RNFL thickness of around 80 was a meaningful value.
There are some limitations to this study: the cross-sec- tional study design and the small number of the popula- tions involved. In addition, the RNFL thickness in the OCT results did not exactly reflect the changes in the pure RNFL because the OCT thickness was the sum of the thickness of the RNFL and the thickness of other tissues, such as blood vessels and glial tissue [1]. Moreover, at- tempting to correct this can result in other confounding factors, and the RNFL thickness measured using OCT has been known to be useful in accurately and objectively de- tecting glaucoma, even in its early stages [15]. The multi-
plication value also did not reflect the real value of the cube of the RNFL defect. In this study, however, we fo- cused on the concept of the ‘three-dimensional RNFL de- fect’ and compared the influence of the depth and area of the RNFL defect alone. Both primary open angle glauco- ma and normal tension glaucoma patients were enrolled in this study. It will be difficult to determine any difference between these two groups in correlation analysis because the position or pattern of retinal nerve fiber damage has been suggested to be different in the two groups. Patients with normal tension glaucoma appear to have deeper, more localized scotomas, even though there have been conflict- ing reports [16].
Interestingly, we detected many outliers on a Lowess plot. There are some possible reasons for this: 1) the num- ber of study subjects, 2) OCT measurement error, 3) indi- vidual variation of RNFL thickness, 4) the characteristic that VF damage may present later in subjects with a thick RNFL than in those with a thin RNFL, and 5) selection bias. Based on these results, caution should be exercised because more patients with an RNFL-VF discrepancy may exist than expected in the clinical setting; further research regarding the RNFL-VF discrepancy is necessary. Most studies that have evaluated the structure-functional rela- tionship in glaucoma were cross-sectional comparative studies, but longitudinal studies are needed to define the relationship, considering the disease characteristics.
In conclusion, RNFL thickness had a negative logarith- mic correlation with the VF indices, and was more strong- ly correlated with the VF indices than the area of the RNFL defect, as measured by OCT. An RNFL thickness of around 80 microns was the point at which the slope of the MD and PSD changed. In addition, there existed many outliers in the structure-function relationship graphs.
Conflict of Interest
No potential conflict of interest relevant to this article- was reported.
References
1. Hood DC, Kardon RH. A framework for comparing struc- tural and functional measures of glaucomatous damage.
Prog Retin Eye Res 2007;26:688-710.
2. Leung CK, Chan WM, Hui YL, et al. Analysis of retinal nerve fiber layer and optic nerve head in glaucoma with different reference plane offsets, using optical coherence tomography. Invest Ophthalmol Vis Sci 2005;46:891-9.
3. Leung CK, Chong KK, Chan WM, et al. Comparative study of retinal nerve fiber layer measurement by Stratu- sOCT and GDx VCC, II: structure/function regression analysis in glaucoma. Invest Ophthalmol Vis Sci 2005;46:
3702-11.
4. Garway-Heath DF, Holder GE, Fitzke FW, Hitchings RA.
Relationship between electrophysiological, psychophysical, and anatomical measurements in glaucoma. Invest Oph- thalmol Vis Sci 2002;43:2213-20.
5. Hodapp E, Parrish RK, Anderson DR. Clinical decisions in glaucoma. St Louis: Mosby; 1993. p. 84-126.
6. Chauhan BC, Blanchard JW, Hamilton DC, LeBlanc RP.
Technique for detecting serial topographic changes in the optic disc and peripapillary retina using scanning laser to- mography. Invest Ophthalmol Vis Sci 2000;41:775-82.
7. Harwerth RS, Carter-Dawson L, Shen F, et al. Ganglion cell losses underlying visual field defects from experimen- tal glaucoma. Invest Ophthalmol Vis Sci 1999;40:2242-50.
8. Bellezza AJ, Rintalan CJ, Thompson HW, et al. Deforma- tion of the lamina cribrosa and anterior scleral canal wall in early experimental glaucoma. Invest Ophthalmol Vis Sci 2003;44:623-37.
9. Sommer A, Katz J, Quigley HA, et al. Clinically detectable nerve fiber atrophy precedes the onset of glaucomatous field loss. Arch Ophthalmol 1991;109:77-83.
10. Quigley HA, Katz J, Derick RJ, et al. An evaluation of op- tic disc and nerve fiber layer examinations in monitoring progression of early glaucoma damage. Ophthalmology 1992;99:19-28.
11. Cioffi GA, Liebmann JM, Johnson CA, Weinreb RN.
Structural-functional relationships of the optic nerve in glaucoma. J Glaucoma 2000;9:3-4.
12. Kanamori A, Nakamura M, Escano MF, et al. Evaluation of the glaucomatous damage on retinal nerve fiber layer thickness measured by optical coherence tomography. Am J Ophthalmol 2003;135:513-20.
13. Leite MT, Zangwill LM, Weinreb RN, et al. Struc- ture-function relationships using the Cirrus spectral do- main optical coherence tomograph and standard automated perimetry. J Glaucoma 2012;21:49-54.
14. Lee JR, Jeoung JW, Choi J, et al. Structure-function rela- tionships in normal and glaucomatous eyes determined by time- and spectral-domain optical coherence tomography.
Invest Ophthalmol Vis Sci 2010;51:6424-30.
15. Sihota R, Sony P, Gupta V, et al. Diagnostic capability of optical coherence tomography in evaluating the degree of glaucomatous retinal nerve fiber damage. Invest Ophthal- mol Vis Sci 2006;47:2006-10.
16. Gramer E, Althaus G, Leydhecker W. Site and depth of glaucomatous visual field defects in relation to the size of the neuroretinal edge zone of the optic disk in glaucoma without hypertension, simple glaucoma, pigmentary glau- coma. A clinical study with the Octopus perimeter 201 and the optic nerve head analyzer. Klin Monbl Augenheilkd 1986;189:190-8.