INTRODUCTION
Metabolic syndrome (MS) refers to a cluster of interrelated risk
factors that include hypertension, obesity, hyperglycemia, and dyslipidemia.1 Evidence suggests that MS can increase the risks for cardiovascular disease, type 2 diabetes, and all- cause mortality.2,3 At present, there are approximately 1/3 adults in the United States4 and 1/5 adults in China5 with MS.
with the increasing prevalence of sedentary behavior6 and obesity,7 the prevalence of MS will continue to increase. The prevention and treatment of MS had become urgent.
Serum alanine aminotransferase (ALT) is a marker of liver injury and is commonly used to identify non-alcoholic fatty liver disease, which is considered as a hepatic component of MS.8 The relationship between ALT and MS was studied by a number of researchers.9,10 Some epidemiological studies sug- gested that elevated ALT levels can increase the risk of MS and
Dose-Response Relationship between Alanine Aminotransferase Levels within the Reference
Interval and Metabolic Syndrome in Chinese Adults
Peipei Wu
1*, Qicai Chen
2*, Lili Chen
3, Pengpeng Zhang
4, Juan Xiao
1, Xiaoxiao Chen
5, Meng Liu
1, and Shumei Wang
11Department of Epidemiology, School of Public Health, Shandong University, Jinan;
2Department of Prevention and Health Care, Dongying Shengli Oilfield Central Hospital, Dongying;
3Department of Nutrition and Food Safety, Zhejiang Center for Disease Control and Prevention, Hangzhou;
4Tianjin Entry-Exit Inspection and Quarantine Bureau, Tianjin;
5Department of Medical Records and Statistics, Zhejiang Hospital, Hangzhou, China.
Purpose: Elevation in serum alanine aminotransferase (ALT) levels is a biomarker for metabolic syndrome (MS); however, the re- lationship has not been fully investigated within the reference interval of ALT levels. Our objective was to explore the relationship between serum ALT levels within the reference interval and MS in Chinese adults.
Materials and Methods: This cross-sectional study included 16028 adults, who attended routine health check-ups at Shengli Oil- field Central Hospital from January 2006 to March 2012. The reference interval of serum ALT level was defined as less than 40 U/L.
Logistic regression models and restricted cubic spline were used to evaluate the association of ALT with MS.
Results: The prevalence of MS in the total population was 13.7% (6.4% for females and 18.4% for males). Multiple logistic regres- sion showed that ALT levels were positively associated with MS after adjustment for potential confounding factors. The odds ratio of MS in the top quartile was 4.830 [95% confidence interval (CI): 2.980–7.829] in females and 3.168 (95% CI: 2.649–3.790) in males, compared with the ALT levels in the bottom quartile. The restricted cubic spline models revealed a positive non-linear dose-response relationship between ALT levels and the risk of MS in women (p for nonlinearity was 0.0327), but a positive linear dose-response relationship in men (p for nonlinearity was 0.0659).
Conclusion: Serum ALT levels within the reference interval are positively associated with MS in a dose-response manner. Elevat- ed ALT levels, even within the reference interval, may reflect early dysmetabolic changes.
Key Words: Alanine aminotransferase, metabolic syndrome, restricted cubic spline
pISSN: 0513-5796 · eISSN: 1976-2437
Received: March 10, 2016 Revised: May 19, 2016 Accepted: June 15, 2016
Corresponding author: Dr. Shumei Wang, Department of Epidemiology, School of Public Health, Shandong University, 44 Wenhua West Road, Jinan 250012, Shandong, China.
Tel: 86-0531-88382141-8804, Fax: 86-0531-88382533, E-mail: [email protected]
*Peipei Wu and Qicai Chen contributed equally to this work.
•The authors have no financial conflicts of interest.
© Copyright: Yonsei University College of Medicine 2017
This is an Open Access article distributed under the terms of the Creative Com- mons Attribution Non-Commercial License (http://creativecommons.org/licenses/
by-nc/3.0) which permits unrestricted non-commercial use, distribution, and repro- duction in any medium, provided the original work is properly cited.
Yonsei Med J 2017 Jan;58(1):158-164 https://doi.org/10.3349/ymj.2017.58.1.158
its related diseases, such as cardiovascular disease and diabe- tes.8,9 On the other hand, Janicˇko, et al.10 showed that people with elevated ALT are not at an increased risk of MS and its components, compared with people with normal ALT. The up- per normal limit of serum ALT level is set on 40 U/L on average, ranging from 30–50 U/L, which is used to discriminate people with diseased liver from general people.11 However, there are some people with nonalcoholic fatty liver disease or/and MS, whose ALT levels are still within the reference interval.10 Sev- eral studies have reported that elevation of ALT level within the reference interval is associated with a higher prevalence of
MS;12,13 however the association between ALT and MS might
differ by ethnicity and gender.14,15 Little is known, meanwhile, of the detailed dose-response relationship of ALT levels within the reference interval and MS in different genders. Studies to test whether a linear dose-response relationship or a thresh- old effect is present are warranted.
Accordingly, we conducted logistic regression analyses and restricted cubic spline models to evaluate the association of ALT levels within the reference interval with MS and dose-re- sponse relationships in different genders to provide some evi- dence for prevention and control of MS.
MATERIALS AND METHODS
Study population
Subjects for this study were selected from who attended rou- tine health check-ups at the Health Management Center of Shengli Oilfield Central Hospital in Dongying City, located in eastern China, from January 2006 to March 2012. A total of 16621 subjects who met all the following conditions were in- cluded in our study: 1) aged 18 years or more; 2) serum ALT levels in the reference interval (≤40 U/L); and 3) clinical data on measurements of ALT level and related indicators to diag- nose MS. If a person attended two or more health check-ups during the 6 years, we used the latest health examination data in this cross-sectional study.
Subjects were excluded from analysis if they had a positive test for hepatitis B virus surface antigen or hepatitis C virus an- tibody. Those with a history of virus hepatitis, liver cirrhosis, liver carcinoma, or autoimmune liver disease were also exclud- ed from this study. Additionally, we further excluded people with serious disease, such as renal failure, heart failure, and ma- lignancy. Finally, 16028 people (6372 women and 9656 men) were included in our study. This study was approved by the Ethics Committee of School of Public Health, Shandong Uni- versity, and informed oral consent was obtained from each participant.
Measurements
All subjects underwent a standardized interview, anthropomet- ric measurements, and blood biochemical analysis. The stan-
dardized interview obtained information on age, medical his- tory, and lifestyle behaviors (including smoking and drinking).
The medical history included diseases of hypertension, diabe- tes, liver disease, and cancer. Smoking was defined as smoking any tobacco product continuously or cumulatively for more than 6 months during their lifetime and at least once within the past 30 days.16 Drinking was defined as consumption of any kind of alcohol beverage averagely once a week, but excluding occasionally drinking during festivals.17
The anthropometric measurements evaluated weight, height, body mass index (BMI), and blood pressure. Height and weight were measured on subjects with light clothing and no shoes.
BMI was calculated by dividing weight (kg) by the height (m) squared. Blood pressure was measured twice from the right arm by a calibrated mercury sphygmomanometer after at least 5 minutes of rest in a comfortable sitting position.
Blood samples were collected under at least 12 hours fast- ing conditions. Blood biochemical tests to determined serum levels of ALT, fasting blood-glucose (FPG), triglyceride (TG), total cholesterol (T-CH), high density lipoprotein cholesterol (HDL-C), serum creatinine (Cr), uric acid (UA), and total biliru- bin (TBIL) were performed using an automatic analyzer (Hit- achi 7170; Hitachi, Tokyo, Japan). White blood cell counts (WBC) were measured by a CELL-DYN 3700 SL analyzer (Abbott Di- agnostics, Chicago, IL, USA). In addition, hepatitis B virus sur- face antigen and hepatitis C virus antibody were tested by the enzyme-linked immunosorbent assay (ELISA).
Definition of metabolic syndrome
In this study, MS was defined according to the criteria proposed by China Diabetes Society (CDS).18 The criteria for MS were three or more of the following risk factors: 1) overweight or obe- sity, BMI ≥25.0 kg/m2; 2) hypertension, systolic blood pressure (SBP) ≥140 mm Hg, or diastolic blood pressure (DBP) ≥90 mm Hg, or previous diagnosis of hypertension; 3) dyslipidemia, TG ≥1.7 mmol/L, or low HDL-C (<0.9 mmol/L in men, <1.0 mmol/L in women); 4) hyperglycemia, FPG ≥6.1 mmol/L (110 mg/dL), or 2 h post-meal glucose (PG) ≥7.8 mmol/L (140 mg/
dL), or previous diagnosis with hyperglycemia.
Statistical analysis
Data are presented as means±standard deviation (SD) for nor- mally distributed continuous variables and as proportions for categorical variables. According to variable distributions using histograms, skewed variables are expressed as medians (inter- quartile range). To compare differences in general character- istics between the quartiles of ALT, One-Way Analysis of Vari- ance or Kruskal-Wills H test was used for continuous variables, and Pearson χ2 test was used for categorical variables. Linear regression analysis was used to test for trend across the four groups of ALT levels. Logistic regression analyses were used to compute the odds ratios (OR) for MS and its components in higher quartiles, compared with the lowest quartile of ALT lev-
els. Considering biological mechanisms and the habits of sta- tistical analysis, regular analysis variables and variables with p less than 0.10 in univariate analysis were entered into the mul- tiple analysis. The dose-response relationship between ALT and MS was explored by restricted cubic spline analyses with 5 knots at percentiles 5%, 25%, 50%, 75%, and 95% of the distri- bution, and percentile 25% was the reference ALT level.19 Re- stricted cubic spline analyses were performed by SAS 9.3 (SAS Institute, Cary, NC, USA)19 and all other statistical analyses were conducted using SPSS 18.0 (SPSS Inc., Chicago, IL, USA).
Two-sided p<0.05 was considered statically significant.
RESULTS
General characteristics
This study included 16028 subjects, with 6372 females and 9656 males, aged 18–85 years old. The prevalence of MS in the total population was 13.7% (6.4% for females and 18.4% for males).
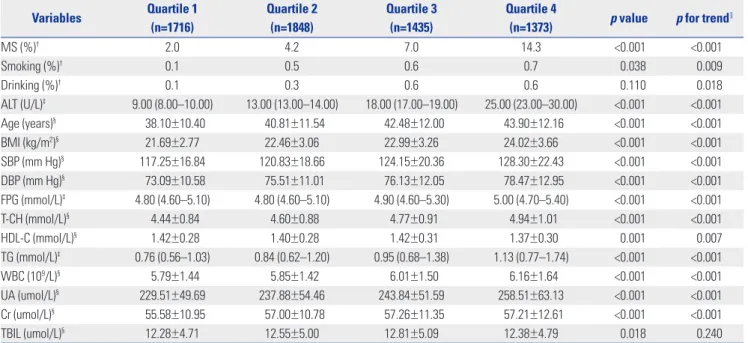
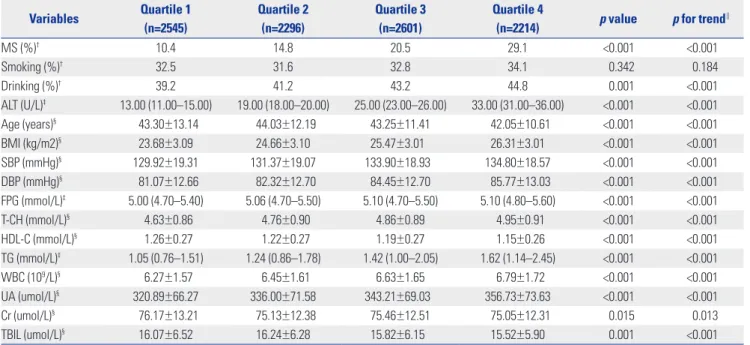
Compared with females, males had higher levels of ALT and a higher prevalence of MS (p<0.001). The general characteris- tics of participants stratified by ALT quartiles in different gen- ders are presented in Table 1 and Table 2. Subjects in the higher ALT quartile groups tended to have higher levels of diagnostic indexes of MS in both genders, except for HDL-C which de- creased with increasing ALT level.
Risk of MS and its components by ALT
Table 3 and Table 4 list results of logistic regression analyses for the presence of MS and its components in relation to the quar- tiles of ALT level in different genders. Higher ALT level was as- sociated with higher prevalence of MS and its three compo- nents (hypertension overweight/obesity and dyslipidemia) in both sexes. The OR of MS increased to 4.830 for women and 3.168 for men in the highest quartile, compared with the ALT levels in the lowest quartile, after adjustment for multiple con- founders. However, the risk of hyperglycemia was positively associated with ALT level in women, but not in men.
Dose-response association between ALT and MS Restricted cubic spline analyses, with/without adjustment for the same variables in multiple logistic regression analyses, in- dicated a positive dose-response relationship between the risk of MS and ALT level in women and men, and all tests for overall association were significant. The estimated shapes of the associations are shown (Figs. 1-4). In univariate analyses, a non-linear relationship of the risk of MS with ALT level was found in both genders (p for nonlinearity was less than 0.0001 in women and 0.0072 in men). In multivariable analyses, the re- lationship between the risk of MS and ALT level was nonlinear in women (p for nonlinearity=0.0327), but linear in men (p for nonlinearity= 0.0659).
Table 1. General Characteristics Stratified by ALT Quartiles in Women*
Variables Quartile 1
(n=1716)
Quartile 2 (n=1848)
Quartile 3 (n=1435)
Quartile 4
(n=1373) p value p for trend∥
MS (%)† 2.0 4.2 7.0 14.3 <0.001 <0.001
Smoking (%)† 0.1 0.5 0.6 0.7 0.038 0.009
Drinking (%)† 0.1 0.3 0.6 0.6 0.110 0.018
ALT (U/L)‡ 9.00 (8.00–10.00) 13.00 (13.00–14.00) 18.00 (17.00–19.00) 25.00 (23.00–30.00) <0.001 <0.001
Age (years)§ 38.10±10.40 40.81±11.54 42.48±12.00 43.90±12.16 <0.001 <0.001
BMI (kg/m2)§ 21.69±2.77 22.46±3.06 22.99±3.26 24.02±3.66 <0.001 <0.001
SBP (mm Hg)§ 117.25±16.84 120.83±18.66 124.15±20.36 128.30±22.43 <0.001 <0.001
DBP (mm Hg)§ 73.09±10.58 75.51±11.01 76.13±12.05 78.47±12.95 <0.001 <0.001
FPG (mmol/L)‡ 4.80 (4.60–5.10) 4.80 (4.60–5.10) 4.90 (4.60–5.30) 5.00 (4.70–5.40) <0.001 <0.001
T-CH (mmol/L)§ 4.44±0.84 4.60±0.88 4.77±0.91 4.94±1.01 <0.001 <0.001
HDL-C (mmol/L)§ 1.42±0.28 1.40±0.28 1.42±0.31 1.37±0.30 0.001 0.007
TG (mmol/L)‡ 0.76 (0.56–1.03) 0.84 (0.62–1.20) 0.95 (0.68–1.38) 1.13 (0.77–1.74) <0.001 <0.001
WBC (109/L)§ 5.79±1.44 5.85±1.42 6.01±1.50 6.16±1.64 <0.001 <0.001
UA (umol/L)§ 229.51±49.69 237.88±54.46 243.84±51.59 258.51±63.13 <0.001 <0.001
Cr (umol/L)§ 55.58±10.95 57.00±10.78 57.26±11.35 57.21±12.61 <0.001 <0.001
TBIL (umol/L)§ 12.28±4.71 12.55±5.00 12.81±5.09 12.38±4.79 0.018 0.240
MS, metabolic syndrome; ALT, alanine aminotransferase; BMI, body mass index; SBP, systolic blood pressure; DBP, diastolic blood pressure; FPG, fasting blood- glucose; T-CH, total cholesterol; HDL-C, high density lipoprotein cholesterol; TG, triglyceride; WBC, white blood cell count; UA, uric acid; Cr, serum creatinine;
TBIL, total bilirubin.
*ALT quartiles in women were as follows: ≤11.0 U/L, 11.1–15.0 U/L, 15.1–20.0 U/L, 20.1–40.0 U/L, †Categorical variable expressed as percentages. Pearson χ2 test was used to test the difference between four groups, ‡Skewed variable expressed as median (interquartile range). Kruskal-Wills H test was used, §Normally distributed continuous variable expressed as means±SD. One-Way Analysis of Variance was used, ∥Linear regression analysis was used to test for the trend across the four groups.
DISCUSSION
In this study, we conducted a cross-sectional study to explore the relationship between ALT levels within the reference inter- val (<40U/L) and MS in a large-scale adult Chinese population.
We found a positive relationship between ALT levels within the reference interval and the prevalence of MS and most of its components in both sexes, after adjustment for potentially con- founders. The OR of MS monotonously increased with increas- ing levels of ALT in both genders, although the relationship had several differences in women and men.
ALT is a specific liver enzyme and a marker of liver damage, restricted to the cytoplasm of hepatocytes.9 A few studies of Korean12 and Israeli populations13 found that increased ALT levels within the reference interval are associated with an in-
creased risk of MS. The present study in Chinese adults is in accordance with these articles. Compared with ALT levels in the lowest quartile, the OR of MS in the highest ALT groups increased to 4.830 and 3.168 in women and men, respectively.
Our study supports that elevated ALT level even within the ref- erence interval can increase the risk of MS.
Different from previous studies, this paper analyzed the dose-response relationship between ALT levels within the ref- erence interval and MS in different genders. This study found that elevated ALT levels among the reference interval are posi- tively and monotonously associated with an increased risk of MS in both genders. The detail dose-response curve was posi- tive and linear in men, but positive and non-linear in women.
The reason for the difference is not clear. Menopause status may be an explanation. Polotsky reported that the incidence Table 2. General Characteristics Stratified by ALT Quartiles in Men*
Variables Quartile 1 (n=2545)
Quartile 2 (n=2296)
Quartile 3 (n=2601)
Quartile 4
(n=2214) p value p for trend∥
MS (%)† 10.4 14.8 20.5 29.1 <0.001 <0.001
Smoking (%)† 32.5 31.6 32.8 34.1 0.342 0.184
Drinking (%)† 39.2 41.2 43.2 44.8 0.001 <0.001
ALT (U/L)‡ 13.00 (11.00–15.00) 19.00 (18.00–20.00) 25.00 (23.00–26.00) 33.00 (31.00–36.00) <0.001 <0.001
Age (years)§ 43.30±13.14 44.03±12.19 43.25±11.41 42.05±10.61 <0.001 <0.001
BMI (kg/m2)§ 23.68±3.09 24.66±3.10 25.47±3.01 26.31±3.01 <0.001 <0.001
SBP (mmHg)§ 129.92±19.31 131.37±19.07 133.90±18.93 134.80±18.57 <0.001 <0.001
DBP (mmHg)§ 81.07±12.66 82.32±12.70 84.45±12.70 85.77±13.03 <0.001 <0.001
FPG (mmol/L)‡ 5.00 (4.70–5.40) 5.06 (4.70–5.50) 5.10 (4.70–5.50) 5.10 (4.80–5.60) <0.001 <0.001
T-CH (mmol/L)§ 4.63±0.86 4.76±0.90 4.86±0.89 4.95±0.91 <0.001 <0.001
HDL-C (mmol/L)§ 1.26±0.27 1.22±0.27 1.19±0.27 1.15±0.26 <0.001 <0.001
TG (mmol/L)‡ 1.05 (0.76–1.51) 1.24 (0.86–1.78) 1.42 (1.00–2.05) 1.62 (1.14–2.45) <0.001 <0.001
WBC (109/L)§ 6.27±1.57 6.45±1.61 6.63±1.65 6.79±1.72 <0.001 <0.001
UA (umol/L)§ 320.89±66.27 336.00±71.58 343.21±69.03 356.73±73.63 <0.001 <0.001
Cr (umol/L)§ 76.17±13.21 75.13±12.38 75.46±12.51 75.05±12.31 0.015 0.013
TBIL (umol/L)§ 16.07±6.52 16.24±6.28 15.82±6.15 15.52±5.90 0.001 <0.001
MS, metabolic syndrome; ALT, alanine aminotransferase; BMI, body mass index; SBP, systolic blood pressure; DBP, diastolic blood pressure; FPG, fasting blood- glucose; T-CH, total cholesterol; HDL-C, high density lipoprotein cholesterol; TG, triglyceride; WBC, white blood cell count; UA, uric acid; Cr, serum creatinine;
TBIL, total bilirubin.
*ALT quartiles in men were as follows: ≤16.0 U/L, 16.1–21.0 U/L, 21.1–28.0 U/L, 28.1–40.0 U/L, †Categorical variable expressed as percentages. Pearson χ2 test was used to test the difference between four groups, ‡Skewed variable expressed as medians (interquartile range). Kruskal-Wills H test was used, §Normal- ly distributed continuous variable expressed as means±SD. One-way analysis of Variance was used, ∥Linear regression analysis was used to test for the trend across the four groups.
Table 3. Logistic Regression for the Presence of MS in Relation to ALT Quartiles
ALT quartiles* OR (95% CI) for MS in women OR (95% CI) for MS in men
Unadjusted Adjusted† Unadjusted Adjusted†
Quartile 1 1.000 1.000 1.000 1.000
Quartile 2 2.151 (1.429–3.238)‡ 1.451 (0.847–2.488) 1.490 (1.255–1.770)‡ 1.306 (1.078–1.583)‡ Quartile 3 3.746 (2.523–5.561)‡ 2.817 (1.699–4.670)‡ 2.218 (1.892–2.599)‡ 1.975 (1.651–2.362)‡ Quartile 4 8.287 (5.715–12.016)‡ 4.830 (2.980–7.829)‡ 3.529 (3.017–4.128)‡ 3.168 (2.649–3.790)‡ MS, metabolic syndrome; ALT, alanine aminotransferase; OR, odds ratio; CI, confidence interval; WBC, white blood cell count; UA, uric acid; Cr, serum creatinine;
TBIL, total bilirubin.
*Gender-specific quartiles of ALT: women (≤11.0, 11.1–15.0, 15.1–20.0, 20.1–40.0 U/L), men (≤16.0, 16.1–21.0, 21.1–28.0, 28.1–40.0 U/L), †Adjusted for age, smoking, drinking, WBC, UA, Cr and TBIL, ‡The value of OR was statically significant, p<0.05.
of MS increases markedly during perimenopause and early menopause. Metabolic changes are associated with meno- pausal transition.20 Lacking information on menopausal sta- tus in our study, we stress that this speculation needs confir- mation in future research.
Additionally, our results revealed that the relationship of ALT with MS, hypertension, and hyperglycemia was stronger in women than in men. Liu, et al.15 also reported that women are more susceptive to the occurrence of MS to the same degree with elevation of ALT. Murphy, et al.21 have shown that, com- pared with boys, girls are 33% more insulin resistant, which is closely related to ALT and MS. These findings suggest that women are inherently more prone to insulin resistance, be- cause impaired glucose homeostasis has been related to X- chromosomal loci.21,22
The mechanism underlying the association between MS and ALT has not been fully clarified. Kim, et al.11 indicated that non-alcoholic fatty liver disease may be the most probable ex- planation for the relationship. Unexplained ALT elevation com- monly is caused by non-alcoholic fatty liver disease.23 Mean- while, non-alcoholic fatty liver disease, which is associated with insulin resistance and obesity, is commonly considered as the hepatic component of MS.24,25 However, Sookoian and Pirola26 argued that glutamine-cycling pathway may be in- volved in the development of MS. ALT is an important enzyme in this cycling. Researchers have speculated that abnormal ALT levels might reflect the risk of MS before the liver becomes fat- ty. Insulin resistance may be another mechanism. Recent stud- ies have indicated that insulin resistance, a major risk factor of MS, was associated with ALT.27 In addition, by inflammation and oxidative stress, elevated ALT levels also contribute to the development of MS.28,29
Assay for ALT is simple, cheap, sensitive, and specific for liv- er injury. The current upper normal limit of ALT level is 40U/L.30 However, several studies have shown that there are many peo- ple with MS and non-alcoholic fatty liver disease in current reference interval of ALT level, and proposed reducing of the upper limit of normal.10,31 Prati and colleagues recommended that the revised upper normal limits of ALT levels should be 19 U/L for women and 30 U/L for men.32 Updating the upper limit could help improve the identification of subjects with subclinical liver disease and at high risk of developing some metabolic diseases, such as MS. However, several researchers suggested that reducing the upper limit of ALT levels may in- crease the healthcare expenditures and even cause undue stress.33 Our results indicate that the risk of MS increases with increasing ALT levels within the reference interval. Thus, ele- vated ALT level, even in the reference interval, may reflect early dysmetabolic changes and greater risk of MS.
We used CDS criteria to diagnose MS instead of international criteria in our study. Compared to Americans and Europeans, Chinese people have their own body shape characteristics. Th- erefore, Chinese diabetes society developed CDS criteria that Table 4. Multiple Logistic Regression for the Presence of the Components of MS in Relation to ALT Quartiles ALT quartiles*
OR (95% CI) in women†OR (95% CI) in men† HypertensionOverweight/obesityHyperglycemiaDyslipidemiaHypertensionOverweight/obesityHyperglycemiaDyslipidemia Quartile 11.0001.0001.0001.0001.0001.0001.0001.000 Quartile 21.277 (0.996–1.637)1.277 (1.013–1.609)‡1.412 (0.874–2.282)1.247 (0.942–1.649)0.881 (0.765–1.015)1.576 (1.376–1.803)‡1.031 (0.830–1.281)1.408 (1.211–1.637)‡ Quartile 31.483 (1.151–1.911)‡1.613 (1.275–2.041)‡1.739 (1.084–2.789)‡1.602 (1.211–2.120)‡1.191 (1.039–1.366)‡2.133 (1.870–2.434)‡1.014 (0.821–1.252)1.944 (1.685–2.244)‡ Quartile 41.972 (1.538–2.528)‡2.026 (1.607–2.554)‡2.098 (1.324–3.323)‡2.423 (1.853–3.168)‡1.345 (1.163–1.554)‡3.154 (2.736–3.635)‡1.185 (0.952–1.475)2.415 (2.080–2.802)‡ MS, metabolic syndrome; ALT, alanine aminotransferase; OR, odds ratio; CI, confidence interval; WBC, white blood cell count; UA, uric acid; Cr, serum creatinine; TBIL, total bilirubin. *Gender-specific quartiles of ALT: women (≤11.0, 11.1–15.0, 15.1–20.0, 20.1–40.0 U/L), men (≤16.0, 16.1–21.0, 21.1–28.0, 28.1–40.0 U/L), †Adjusted for age, smoking, drinking, WBC, UA, Cr, TBIL and the compo- nents of MS other than the analyzed component, ‡The value of OR was statically significant, p<0.05.
has been widely applied in other research.5,34 A previous study has reported that CDS criteria and IDF criteria are in good ac- cordance.35 Meanwhile, considering the fact that our database lacks waist circumference information, CDS criteria might make our estimation more precise. Although there may be a slight difference by using different criteria to diagnose MS, the difference would hardly change the noted dose-response trends in the relationship between ALT and MS.
There are some limitations in this study. First, the partici- pants of our study were enrolled from a hospital for routine health check-ups who mainly work in enterprises, institutions, factories, and for government. Therefore, there is a question as to whether the present findings could be applicable to other groups of people, such as farmers. Second, we had no detailed data on alcohol consumption, and thus, we could not exclude alcohol abusers. However, ALT levels among alcohol abusers are usually higher than 40 U/L, and our subjects only includ- ed ALT levels in the reference interval. Therefore, the influ- ence of alcohol abusers would be limited. Finally, this study
was a cross-sectional study, and could not delineate the tem- poral association of ALT with MS or identify a causal relation- ship. Prospective research and clinical trials are needed to validate the present results in the future.
In conclusion, we found a positive dose-response relation- ship between ALT levels within the reference interval and the risk of MS in both genders. Elevated ALT levels, even within the reference interval, may reflect early dysmetabolic changes and a greater risk for MS.
ACKNOWLEDGEMENTS
We are indebted to the members of the Health Management Center of Shengli Oilfield Central Hospital in Dongying City.
They have provided invaluable help with the data collection.
REFERENCES
1. Alberti KG, Eckel RH, Grundy SM, Zimmet PZ, Cleeman JI, Dona- Fig. 1. Unadjusted dose-response association between ALT and the risk of
MS in women. MS, metabolic syndrome; ALT, alanine aminotransferase;
OR: odds ratio.
3.00 2.13 1.25 0.38 -0.50 -1.38 -2.25 -3.13 -4.00
0 5 10 15 20 25 30 35 40 ALT (U/L)
Ln (OR) value
Estimation Confidence interval Knots
Fig. 3. Unadjusted dose-response association between ALT and the risk of MS in men. MS, metabolic syndrome; ALT, alanine aminotransferase; OR:
odds ratio.
2.0 1.5 1.0 0.5 0.0 -0.5 -1.0 -1.5 -2.0
0 5 10 15 20 25 30 35 40 ALT (U/L)
Ln (OR) value
Estimation Confidence interval Knots
Fig. 2. Adjusted dose-response association between ALT and the risk of MS in women. MS, metabolic syndrome; ALT, alanine aminotransferase;
OR: odds ratio.
3.00 2.25 1.50 0.75 0.00 -0.75 -1.50 -2.25 -3.00
0 5 10 15 20 25 30 35 40 ALT (U/L)
Ln (OR) value
Estimation Confidence interval Knots
Fig. 4. Adjusted dose-response association between ALT and the risk of MS in men. MS, metabolic syndrome; ALT, alanine aminotransferase; OR:
odds ratio.
2.0 1.5 1.0 0.5 0.0 -0.5 -1.0 -1.5 -2.0
0 5 10 15 20 25 30 35 40 ALT (U/L)
Ln (OR) value
Estimation Confidence interval Knots
to KA, et al. Harmonizing the metabolic syndrome: a joint interim statement of the International Diabetes Federation Task Force on Epidemiology and Prevention; National Heart, Lung, and Blood In- stitute; American Heart Association; World Heart Federation; In- ternational Atherosclerosis Society; and International Association for the Study of Obesity. Circulation 2009;120:1640-5.
2. Mottillo S, Filion KB, Genest J, Joseph L, Pilote L, Poirier P, et al. The metabolic syndrome and cardiovascular risk a systematic review and meta-analysis. J Am Coll Cardiol 2010;56:1113-32.
3. Khang YH, Cho SI, Kim HR. Risks for cardiovascular disease, stroke, ischaemic heart disease, and diabetes mellitus associated with the metabolic syndrome using the new harmonised definition: find- ings from nationally representative longitudinal data from an Asian population. Atherosclerosis 2010;213:579-85.
4. Mozumdar A, Liguori G. Persistent increase of prevalence of met- abolic syndrome among U.S. adults: NHANES III to NHANES 1999-2006. Diabetes Care 2011;34:216-9.
5. Xi B, He D, Hu Y, Zhou D. Prevalence of metabolic syndrome and its influencing factors among the Chinese adults: the China Health and Nutrition Survey in 2009. Prev Med 2013;57:867-71.
6. Owen N, Healy GN, Matthews CE, Dunstan DW. Too much sitting:
the population health science of sedentary behavior. Exerc Sport Sci Rev 2010;38:105-13.
7. James PT. Obesity: the worldwide epidemic. Clin Dermatol 2004;
22:276-80.
8. Schindhelm RK, Diamant M, Dekker JM, Tushuizen ME, Teerlink T, Heine RJ. Alanine aminotransferase as a marker of non-alcoholic fatty liver disease in relation to type 2 diabetes mellitus and car- diovascular disease. Diabetes Metab Res Rev 2006;22:437-43.
9. Goessling W, Massaro JM, Vasan RS, D’Agostino RB Sr, Ellison RC, Fox CS. Aminotransferase levels and 20-year risk of metabolic syn- drome, diabetes, and cardiovascular disease. Gastroenterology 2008;135:1935-44, 1944.e1.
10. Janicˇko M, Veselìny E, Orencˇák R, Hustˇak R, Fedacˇko J, Drazˇilová S, et al. Redefining the alanine aminotransferase upper limit of nor- mal improves the prediction of metabolic syndrome risk. Eur J Gastroenterol Hepatol 2015;27:405-11.
11. Kim HC, Choi KS, Jang YH, Shin HW, Kim DJ. Normal serum ami- notransferase levels and the metabolic syndrome: Korean National Health and Nutrition Examination Surveys. Yonsei Med J 2006;
47:542-50.
12. Suh SY, Choi SE, Ahn HY, Yang HM, Kim YI, Sung NJ. The associa- tion between normal alanine aminotransferase levels and the met- abolic syndrome: 2005 Korean National Health and Nutrition Ex- amination Survey. Metabolism 2009;58:1731-6.
13. Steinvil A, Shapira I, Ben-Bassat OK, Cohen M, Vered Y, Berliner S, et al. The association of higher levels of within-normal-limits liver enzymes and the prevalence of the metabolic syndrome. Cardio- vasc Diabetol 2010;9:30.
14. Bethel MA, Deedwania P, Levitt NS, Schmitz O, Huntsman-Labed A, Califf RM, et al. Metabolic syndrome and alanine aminotrans- ferase: a global perspective from the NAVIGATOR screening popu- lation. Diabet Med 2009;26:1204-11.
15. Liu Z, Que S, Ning H, Wang L, Peng T. Elevated alanine aminotrans- ferase is strongly associated with incident metabolic syndrome: a meta-analysis of prospective studies. PLoS One 2013;8:e80596.
16. WHO. Guidelines for controlling and monitoring the tobacco epi- demic. Geneva: World Health Organization; 1998.
17. Ma G, Zhu D, Hu X, Luan D, Kong L, Yang X. [The drinking prac- tice of people in China]. Acta Nutrimenta Sinica 2005;27:362-65.
18. Wang X, Yang F, Bots ML, Guo WY, Zhao B, Hoes AW, et al. Preva- lence of the metabolic syndrome among employees in Northeast China. Chin Med J 2015;128:1989-93.
19. Desquilbet L, Mariotti F. Dose-response analyses using restricted cubic spline functions in public health research. Stat Med 2010;
29:1037-57.
20. Polotsky HN, Polotsky AJ. Metabolic implications of menopause.
Semin Reprod Med 2010;28:426-34.
21. Murphy MJ, Metcalf BS, Voss LD, Jeffery AN, Kirkby J, Mallam KM, et al. Girls at five are intrinsically more insulin resistant than boys:
The Programming Hypotheses Revisited--The EarlyBird Study (EarlyBird 6). Pediatrics 2004;113(1 Pt 1):82-6.
22. Ehm MG, Karnoub MC, Sakul H, Gottschalk K, Holt DC, Weber JL, et al. Genomewide search for type 2 diabetes susceptibility genes in four American populations. Am J Hum Genet 2000;66:1871-81.
23. Clark JM, Brancati FL, Diehl AM. The prevalence and etiology of elevated aminotransferase levels in the United States. Am J Gas- troenterol 2003;98:960-7.
24. Tarantino G, Finelli C. What about non-alcoholic fatty liver disease as a new criterion to define metabolic syndrome?. World J Gastro- enterol 2013;19:3375-84.
25. Gariani K, Philippe J, Jornayvaz FR. Non-alcoholic fatty liver dis- ease and insulin resistance: from bench to bedside. Diabetes Metab 2013;39:16-26.
26. Sookoian S, Pirola CJ. Alanine and aspartate aminotransferase and glutamine-cycling pathway: their roles in pathogenesis of met- abolic syndrome. World J Gastroenterol 2012;18:3775-81.
27. Hanley AJ, Wagenknecht LE, Festa A, D’Agostino RB Jr, Haffner SM.
Alanine aminotransferase and directly measured insulin sensitivity in a multiethnic cohort: the Insulin Resistance Atherosclerosis Study.
Diabetes Care 2007;30:1819-27.
28. Yamada J, Tomiyama H, Yambe M, Koji Y, Motobe K, Shiina K, et al.
Elevated serum levels of alanine aminotransferase and gamma glutamyltransferase are markers of inflammation and oxidative stress independent of the metabolic syndrome. Atherosclerosis 2006;189:198-205.
29. Lee SH, Kim KN, Kim KM, Joo NS. Irritable bowel syndrome may be associated with elevated alanine aminotransferase and meta- bolic syndrome. Yonsei Med J 2016;57:146-52.
30. Harrison SA. HCV therapy in 2006: down with ALT levels, in with awareness of co-existent metabolic syndrome. J Hepatol 2006;
44:624-6.
31. Wu WC, Wu CY, Wang YJ, Hung HH, Yang HI, Kao WY, et al. Updat- ed thresholds for serum alanine aminotransferase level in a large- scale population study composed of 34 346 subjects. Aliment Pharmacol Ther 2012;36:560-8.
32. Prati D, Taioli E, Zanella A, Della Torre E, Butelli S, Del Vecchio E, et al. Updated definitions of healthy ranges for serum alanine ami- notransferase levels. Ann Intern Med 2002;137:1-10.
33. Kunde SS, Lazenby AJ, Clements RH, Abrams GA. Spectrum of NAFLD and diagnostic implications of the proposed new normal range for serum ALT in obese women. Hepatology 2005;42:650-6.
34. Wei D, Chen T, Li J, Gao Y, Ren Y, Zhang X, et al. Association of se- rum gamma-glutamyl transferase and ferritin with the metabolic syndrome. J Diabetes Res 2015;2015:741731.
35. Lu YH, Lu JM, Wang SY, Li CL, Liu LS, Zheng RP, et al. [Comparison of the diagnostic criteria of metabolic syndrome by International Diabetes Federation and that by Chinese Medical Association Di- abetes Branch]. Zhonghua Yi Xue Za Zhi 2006;86:386-9.