INTRODUCTION
Compared to the past, hospital mortality of critically ill patients admitted to the intensive care unit (ICU) has continued to de- crease, owing to advances in critical medicine and patient man- agement.1-3 In other words, the number of ICU survivors is con- tinuing to increase. However, ICU survivors experience post- traumatic stress, depression, cognitive impairment, and physical
weakness; and are known to have poorer long-term survival outcomes compared to the general population.1,4,5 Therefore, improving the long-term outcomes of ICU survivors remains a very important issue today.6,7 Nevertheless, it is a very chal- lenging task which requires the efforts of individual patients, their guardians, and the society as a whole.8,9
Financial burden is one of the biggest and most common stress factors that ICU survivors face while experiencing critical ill- ness.10 This burden also impacts their caregivers, and is a serious problem that can cause psychological stress. A recent observa- tional study conducted in two academic hospitals in New York City reported that race or ethnicity was not associated with long- term mortality among ICU survivors, while insurance status was closely associated.11 In other words, the lack of insurance coverage was associated with increased mortality among ICU survivors, and thus this study has emphasized the need for the provision of appropriate financial coverage for ICU survivors.
However, it remains uncertain whether complete financial cov- erage through the insurance system can improve long-term mor-
Impacts of Financial Coverage on Long-Term Outcome of Intensive Care Unit Survivors in South Korea
Jun Kwon Cha1, Tak Kyu Oh2, and In-Ae Song2
1Department of Emergency Medicine, Hallym University Sacred Heart Hospital, Anyang;
2Department of Anesthesiology and Pain Medicine, Seoul National University Bundang Hospital, Seongnam, Korea.
Purpose: The objective of this study was to investigate whether financial coverage by the national insurance system for patients with lower economic conditions can improve their 1-year mortality after intensive care unit (ICU) discharge.
Materials and Methods: This study, conducted in a single tertiary hospital, used a retrospective cohort design to investigate dis- charged ICU survivors between January 2012 and December 2016. ICU survivors were classified into two groups according to the National Health Insurance (NHI) system in Korea: medical aid program (MAP) group, including people who have difficulty pay- ing their insurance premium or receive medical aid from the government due to a poor economic status; and NHI group consist- ing of people who receive government subsidy for approximately 2/3 of their medical expenses.
Results: After propensity score (PS) matching, a total of 2495 ICU survivors (1859 in NHI group and 636 in MAP group) were in- cluded in the analysis. Stratified Cox regression analysis of PS-matched cohorts showed that 1-year mortality was 1.31-fold higher in MAP group than in NHI group (hazard ratio: 1.31, 95% confidence interval, 1.06 to 1.61; p=0.012). According to Kaplan-Meir estimation, MAP group also showed significantly poorer survival probability than NHI group after PS matching (p=0.011).
Conclusion: This study showed that 1-year mortality was higher in ICU survivors with low economic status, even if financial cov- erage was provided by the government. Our result suggests the necessity of a more nuanced and multifaceted approach to policy for ICU survivors with low economic status.
Key Words: Critical care, intensive care units, insurance, mortality
pISSN: 0513-5796 · eISSN: 1976-2437
Received: May 2, 2019 Revised: August 8, 2019 Accepted: August 19, 2019
Corresponding author: Tak Kyu Oh, MD, Department of Anesthesiology and Pain Medicine, Seoul National University Bundang Hospital, 82 Gumi-ro 173beon-gil, Bundang-gu, Seongnam 13620, Korea.
Tel: 82-31-787-7499, Fax: 82-31-787-4063, E-mail: [email protected]
•The authors have no potential conflicts of interest to disclose.
© Copyright: Yonsei University College of Medicine 2019
This is an Open Access article distributed under the terms of the Creative Com- mons Attribution Non-Commercial License (https://creativecommons.org/licenses/
by-nc/4.0) which permits unrestricted non-commercial use, distribution, and repro- duction in any medium, provided the original work is properly cited.
Yonsei Med J 2019 Oct;60(10):976-983 https://doi.org/10.3349/ymj.2019.60.10.976
tality among patients with lower economic status, since there has been no study to date on this topic. Determining whether the long-term outcomes of ICU survivors with lower economic status can be sufficiently improved through financial support may be helpful in establishing suitable policies targeting these ICU survivors.
Accordingly, the objective of the present study was to inves- tigate whether complete financial coverage by the national in- surance system for patients with lower economic status is associ- ated with improvement of 1-year mortality after ICU discharge.
We hypothesized that ICU survivors with lower economic status, who receive complete financial coverage, will experience an improvement in 1-year mortality after ICU discharge, as com- pared to regular patients.
MATERIALS AND METHODS
Ethical statement, design, and setting
This retrospective cohort study was conducted with approval from the Institutional Review Board (IRB) of Seoul National University Bundang Hospital (SNUBH) (IRB approval number:
B-1902/522-105). Considering the nature of a retrospective co- hort study that involves analysis of medical records of patients who have already completed their treatment, the requirement for informed consent was waived by the IRB.
Data source
The present study used electronic health records stored in Seoul National University Bundang Hospital Electronic System for Total Care (BESTCare), which is the electronic medical record system of SNUBH, as the data source.12 Moreover, the date of death and cause of death of all patients, including follow-up loss patients, were collected from the database of Statistics Korea (http://kostat.go.kr/portal/eng). The causes of death were clas- sified according to the Korean standard classification of disease and cause of death (KCD) 7th edition supplied by Statistics Korea.
Study population
The study population in the present study consisted of discharged adult ICU survivors who were 18 years or older and had been ad- mitted to the ICU between January 2012 and December 2016.
Only the last ICU admission of patients who had been admitted to the ICU more than once was considered for analysis. Among the ICU survivors, foreign patients who were not enrolled in the insurance system of South Korea, patients admitted to the ICU with industrial accident compensation insurance or car insur- ance, as well as patients with incomplete or missing medical records, were excluded from the analysis.
Health insurance system in South Korea as an independent variable
Since 1989, all South Korean citizens have been required to en- roll in the National Health Insurance (NHI) system provided by the government.13 Most citizens pay a fixed rate of health insur- ance premium based on their income, with approximately 2/3 of their medical expenses subsidized by the government. In addition, foreigners who stay in South Korea for a certain peri- od (6 months or longer) may also enroll for NHI service. How- ever, patients who are too poor to pay their insurance premium or have difficulty in financially supporting themselves belong to the medical aid program (MAP), through which the govern- ment covers almost all medical expenses to reduce the burden of medial cost on these patients. Specifically, the patients in MAP were classified as type 1 MAP and type 2 MAP depending on their income, property, and other factors. Specifically, type 1 MAP patients included workers with inability to work, house- holds with rare incurable diseases, recipients of subsidized hous- ing, patients of national merit, and North Korea defectors. Type 2 MAP group included low-income people unable to live inde- pendently, but not meeting the type 1 MAP conditions. The gov- ernment pays for 100% of the medical costs for patients in type 1 MAP group, and 85% of costs for those in type 2 MAP group.
According to a recent Profile of National Cohort in South Korea, the percentage of males and females enrolled in the total MAP was 2.5% and 3.4%, respectively.14
Study endpoints
The primary endpoint in the present study was 1-year mortality after ICU discharge. The secondary endpoint was the cause of death (e.g., cardiovascular disease, cancer, neurological disease, injury, or trauma) related to the 1-year mortality after ICU dis- charge.
Covariates
Data collected included 1) physical characteristics [sex, age, and body mass index (BMI, kg/m2)]; 2) information regarding socioeconomic status [highest educational attainment (lower than high school/more than or equal to high school, lower than college/more than or equal to college) and marital status (un- married/married or living with someone/divorced or separat- ed/widowed)], 3) Acute Physiology and Chronic Health Eval- uation (APACHE) II; 4) comorbidities [hypertension, diabetes mellitus, history of coronary disease and cerebrovascular disease, liver disease (hepatitis, liver cirrhosis, and fatty liver), chronic obstructive lung disease, chronic kidney disease, and cancer];
and 5) admitting department (internal medicine or emergency medicine/neurologic center/cardiothoracic surgical depart- ment/other surgical department). For collection of comorbid- ity-related information, International Classification of Disease 10th Revision (ICD-10) diagnostic system was used in this study.
Statistical analysis
Baseline characteristics of the ICU survivors were presented as the mean with standard deviation or numbers with percent- age. First, we performed propensity score (PS) matching, which is known to minimize the influence of confounders in cohort studies.15 PS matching was performed using the nearest neigh- bor method with 1:3 ratio and no replacement by caliper 0.2.
Absolute value of standardized mean difference (ASD) was used to assess the balance between NHI and MAP groups before and after PS matching. All covariates (age, BMI, sex, highest edu- cational attainment, marital status, APACHE II, hypertension, diabetes mellitus, history of coronary artery disease and cere- brovascular disease, liver disease, chronic obstructive lung dis- ease, chronic kidney disease, cancer, admitting department, and year of ICU discharge) were included in PS model. Our goal was to match all confounders between the two groups to obtain an ASD of <0.1 through PS matching. After confirming a good balance between the two groups in the PS-matched cohort, we performed stratified Cox regression analysis for 1-year mortal- ity after ICU discharge for conditional Cox regression. We also performed a competing risk analysis to investigate differences in hazard between NHI and MAP groups, based on the four types of 1-year mortality according to the cause of death (death relat- ed to cardiovascular disease, cancer, neurologic disease, or in- jury or trauma) in the PS-matched cohort.
Next, we performed a multivariable Cox regression analysis on the entire cohort for the following two reasons: first, to de- termine whether the findings in the PS-matched cohort were generalizable for the entire cohort; and second, to determine the associations with 1-year mortality in the same context as all covariables without dividing the ICU survivors by insurance type. Additionally, we performed Cox regression analysis in both PS-matched cohort and entire cohort after multivariable adjust- ment by dividing the total MAP group into two groups (Type 1 MAP and Type 2 MAP) for sensitivity analysis. Finally, the over- all survival times after ICU discharge of MAP group and NHI group are presented as Kaplan-Meir curves generated from data before and after PS matching, and log-rank test was used to test statistical significance. All resulting values of the Cox regression models are presented as hazard ratios (HRs) and confidence intervals (CIs), and the log-minus-log plot function was used to determine whether each Cox proportional hazard model sat- isfied the central assumption. Concordance (C) statistics were used to identify the C-index of the multivariable Cox regression model. All analyses were performed using R software (version 3.6.0; R Foundation for Statistical Computing, Vienna, Aus- tria), and p<0.05 was considered statistically significant.
RESULTS
Between January 2012 and December 2016, there were 34245 total ICU admissions involving 25079 unique patients. After ex-
cluding multiple ICU admissions of the same patient (n=9166), the last episode of ICU admissions of 25079 patients were in- cluded in the analysis. From this patient population, the follow- ing patients were excluded: 4925 children aged under 18 years;
108 foreigners not covered by insurance; 300 patients admitted to the ICU with industrial accident compensation insurance or car insurance; 323 patients discharged from the ICU after December 2016; 1505 patients who died during their stay in the ICU; and 148 patients with incomplete or missing medical re- cords. As a result, 17770 ICU survivors were included in the analysis, with 17130 patients (96.4%) in NHI group and 640 pa- tients (3.6%) in MAP group. After performing PS matching to balance the two groups, a total PS matching of 2495 ICU survi- vors (NHI group: 1859; MAP group: 636) were included in the final analysis (Fig. 1). Comparison results of the characteristics of ICU survivors between NHI and MAP groups before and af- ter PS matching are shown in Table 1. After PS matching, two groups were well-balanced with ASD <0.1, while the distribu- tion of PS after PS matching was similar to that before PS match- ing (Supplementary Fig. 1, only online).
Survival analysis after PS adjustment
The analysis results of 1-year mortality among ICU survivors in PS-matched cohort are shown in Table 2. The results showed 1-year mortality of 289/1880 (15.5%) and 127/636 (20.0%) in NHI and MAP groups, respectively. In the stratified Cox regression model, MAP group showed 1.31-fold higher 1-year mortality than NHI group (HR: 1.31, 95% CI: 1.06 to 1.61; p=0.012). Ka- plan-Meir curves for 1-year mortality before (A) and after (B) PS matching are shown in Fig. 2, in which MAP group showed sig- nificantly poorer survival probability than NHI group both be- fore and after PS matching (Fig. 2A, p<0.001; and Fig. 2B, p=
0.011 by log-rank test). In sensitivity analysis in PS-matched co- hort, type 1 MAP group showed 1.36-fold higher 1-year mortal- ity (HR: 1.36, 95% CI: 1.10 to 1.68, p=0.004), while type 2 MAP group did not show significant 1-year mortality, compared to NHI group (p=0.168). A competing risk analysis using the PS- matched cohort showed that 1-year mortality rates after ICU discharge due to cardiovascular disease, cancer, neurological disease, and injury or trauma were not significantly different between the two groups (all p>0.05 in Table 2).
Survival analysis after multivariable adjustment in entire cohort
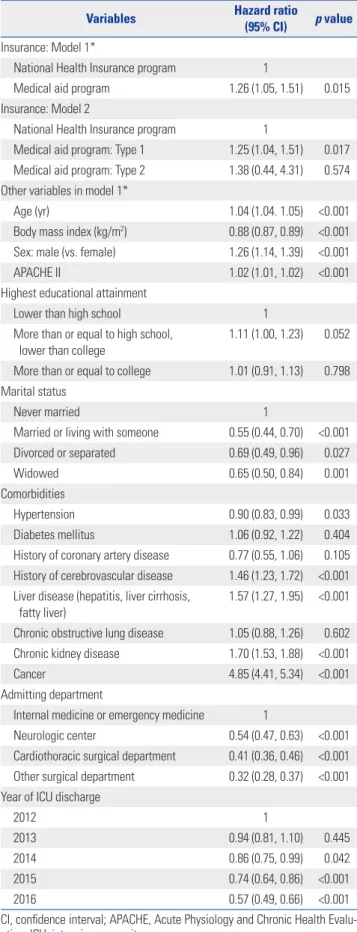
The results of sensitivity analysis using multivariable Cox regres- sion models for the entire cohort are presented in Table 3. MAP group showed 1.26-fold higher 1-year mortality than NHI group (HR: 1.26, 95% CI: 1.05 to 1.51, p=0.015). C-index of multivari- able model was 0.82 (95% CI: 0.81 to 0.83). In sensitivity analy- sis using the entire cohort, type 1 MAP group showed 1.25-fold higher 1-year mortality (HR: 1.25, 95% CI: 1.04 to 1.51, p=0.017), while type 2 MAP group did not show significant 1-year mor- tality compared to NHI group (p=0.574).
DISCUSSION
The findings in the present study showed that the ICU survivors in MAP group, who were poor but received financial coverage from the government for most of their medical expenses, expe- rienced higher 1-year mortality after ICU discharge compared to other ICU survivors in NHI group. Additionally, this associ- ation was more pronounced in type 1 MAP group, who might represent more difficult economic circumstances than type 2 MAP group. In other words, the findings in the present study showed that providing financial coverage alone cannot improve the long-term outcomes of ICU survivors with lower economic status, and that a more nuanced and multifaceted policy ap- proach is needed for such patients. A competing risk analysis re- vealed no significant difference in specific cause of death be- tween the two groups.
Despite sufficient financial coverage, the higher 1-year mor- tality among ICU survivors with lower economic status has many reasons. The first reason is the issue of frailty, which is the loss of physiologic or cognitive reserve. Recent reports have in- dicated that patients with lower socioeconomic status tend to be more frail.16,17 Pre-ICU admission frailty status is a scale that can predict the prognosis of ICU survivors,18 while increase in
such frailty is known to be associated with increase in long-term mortality.19 It is possible that pre-ICU admission frailty may have been more common among patients with lower economic sta- tus in the present study (MAP group), which may be associated with higher 1-year mortality among ICU survivors in MAP group.
Second, the utilization of healthcare source may have been different between MAP and NHI groups. According to the be- havioral model by Andersen,20 three major factors that trigger the utilization of health care source are individual needs, en- abling factors, and predisposing factors. In the present study, MAP group addressed the enabling factor by receiving finan- cial coverage; however, because marital status or final educa- tional attainment was matched through PS, predisposing factor did not have a significant influence on healthcare utilization.
Therefore, the possible source of problem in the present study may have been individual needs of the patients. ICU survivors commonly experience unplanned hospital readmissions after discharge;21 as a result, they often require continued health care utilization. In addition, strict compliance to prescribed medi- cation would be essential for improving long-term outcomes of ICU survivors. While additional studies may be needed on this topic, patients with lower economic status in MAP group may have had little need for treatment, despite having sufficient fi- January 2012–December 2016
25079 patients (34245 of ICU admissions)
Excluded (n=9166 cases of ICU admissions) : Multiple (≥2) ICU admissions of one patient
Excluded
: < age of 18 years old (n=4925 patients) : Foreigner without insurance (n=108)
: Industrial accident compensation insurance or car insurance (n=300)
Excluded
: ICU discharge after December 2016 (n=323) : Death in ICU (n=1505)
: Incomplete or missing medical record (n=148) 1st screened
25079 patients
Finally included 19746 adult patients
ICU survivor n=17770 adult patients
National Health Insurance program n=17130
Medical aid program n=640
National Health Insurance program n=1859
Medical aid program n=636 Propensity score matching
Fig. 1. Flow chart depicting patient selection. ICU, intensive care unit.
nancial coverage.
Another noteworthy finding was in the multivariable Cox re- gression models including all covariates. Overall, 1-year mor- tality increased independently in patients with comorbidities such as cancer, chronic kidney disease, cerebrovascular disease, or liver disease. Such finding was consistent with previous stud- ies reporting that preexisting comorbidity played an important role in the prognosis of ICU survivors.21 Moreover, the unmar- ried group in this study showed the association of independent- ly increased 1-year mortality compared to married group. This finding was consistent with previous studies reporting that the
role and burden of caregivers may be higher for ICU survivors;22 moreover, when the behavioral model by Andersen was ap- plied, family was found to be an important predisposing factor on the outcomes of ICU survivors.20 As a result, the significance of the present study is that it used PS matching to investigate the association between complete financial coverage for ICU survivors with very low economic status and 1-year mortality, and revealed factors associated with insurance status through multivariable Cox models including various variables.
Our study implies that insurance status, such as MAP or NHI, was not determinative of long-term mortality among ICU sur- Table 1. Characteristics of ICU Survivors before and after Propensity Score Matching
Variables Entire cohort (n=17770) PS-matched cohort (n=2495)
NHIP (n=17130) MAP (n=640) ASD NHIP (n=1859) MAP (n=636) ASD
Age (yr) [mean (standard deviation)] 62.8 (15.5) 66.0 (16.3) 0.196 23.1 (3.6) 23.0 (3.9) 0.005
Sex (male) 10229 (59.7) 315 (49.2) 0.209 943 (50.7) 315 (49.5) 0.026
BMI (kg m-2) [mean (standard deviation)] 23.8 (3.4) 23.0 (3.9) 0.195 23.1 (3.6) 23.0 (3.9) 0.004
Highest educational attainment 0.558 0.019
Lower than high school 6530 (38.1) 388 (60.6) 1109 (59.7) 384 (60.4)
More than or equal to high school, lower than college 4780 (27.9) 160 (25.0) 461 (24.8) 160 (25.1)
More than or equal to college 5820 (34.0) 92 (14.4) 289 (15.5) 92 (14.5)
Marital status 0.537 0.011
Never married 1067 (6.2) 81 (12.6) 219 (11.8) 79 (12.4)
Married or living with someone 14053 (82.0) 354 (55.3) 1072 (57.6) 354 (55.7)
Divorced or separated 420 (2.5) 81 (12.6) 200 (10.8) 79 (12.4)
Widowed 1590 (9.3) 124 (19.4) 368 (19.8) 124 (19.5)
APACHE II [mean (standard deviation)] 18.4 (9.9) 19.9 (9.7) 0.167 19.9 (10.1) 20.0 (9.7) 0.008
Comorbidities
Hypertension 7574 (44.2) 305 (47.7) 0.069 879 (47.3) 303 (47.6) 0.015
Diabetes mellitus 1466 (8.6) 72 (11.2) 0.014 203 (10.9) 72 (11.3) 0.009
History of coronary artery disease 286 (1.7) 12 (1.9) 0.001 33 (1.8) 12 (1.9) 0.012
History of cerebrovascular disease 703 (4.1) 36 (5.6) 0.008 101 (5.4) 35 (5.5) 0.007
Liver disease (hepatitis, liver cirrhosis, fatty liver) 434 (2.5) 23 (3.6) 0.057 77 (4.1) 23 (3.6) 0.035
Chronic obstructive lung disease 734 (4.3) 35 (5.5) 0.006 109 (5.9) 35 (5.5) 0.025
Chronic kidney disease 2197 (12.8) 152 (23.8) 0.257 416 (22.4) 150 (23.6) 0.016
Cancer 2914 (17.0) 120 (18.8) 0.045 365 (19.6) 118 (18.6) 0.030
Admitting department 0.214 0.031
Internal medicine or emergency medicine 3239 (18.9) 132 (20.6) 417 (22.4) 132 (20.8)
Neurologic center 3485 (20.4) 84 (13.1) 254 (13.7) 84 (13.2)
Cardiothoracic surgical department 6995 (40.8) 260 (40.6) 727 (39.1) 259 (40.7)
Other surgical department 3411 (19.9) 164 (25.7) 461 (24.8) 161 (25.3)
Year of ICU discharge 0.099 0.048
2012 2410 (14.1) 86 (13.4) 254 (13.7) 86 (13.5)
2013 2933 (17.1) 93 (14.5) 241 (13.0) 93 (14.6)
2014 3673 (21.4) 165 (25.8) 460 (24.7) 162 (25.5)
2015 3903 (22.8) 129 (20.2) 399 (21.5) 129 (20.3)
2016 4211 (24.6) 167 (26.1) 505 (27.1) 166 (26.1)
ICU, intensive care unit; PS, propensity score; ASD, absolute value of standardized mean difference; BMI, body mass index; APACHE, Acute Physiology and Chronic Health Evaluation.
Data are presented as number (percentage) or mean (standard deviation) unless otherwise indicated. Patients in the medical aid program (MAP) were those classified to have low income, and most of their hospital charges were paid by the government. Meanwhile, for patients in the National Health Insurance pro- gram (NHIP), approximately two-thirds of their hospital charges were covered by the government.
vivors, though it might reflect the patients’ level of frailty upon returning to community. As previous studies reported, insur- ance status reflects the level of frailty, especially when it is rep- resentative of economic status.23,24 Therefore, association be- tween MAP group and increased 1-year mortality after ICU discharge should be interpreted carefully in this context. Addi- tionally, our sensitivity analysis showed that type 1 MAP group, and not type 2 MAP group, was associated with higher 1-year mortality, despite receiving a higher level of financial coverage rate than type 2 MAP group. These results suggest that frailty
status upon ICU discharge has more predictive value than fi- nancial coverage.
The present study had some limitations. First, the limitation of using a retrospective cohort design may have caused some selection bias. Second, since this was a single-center, single- country study, the findings cannot be generalized. As South Ko- rea has relatively good insurance coverage for its citizens through its NHI service, direct comparisons with other countries would be difficult. Third, the proportion of patients with lower eco- nomic status belonging to MAP group was very small in the Table 2. Survival Analysis in the Propensity Score-Matched Cohort
Variables 1-year mortality [n/total n (%)] HR (95% CI) p value
Overall 1-year mortality
National Health Insurance program 289/1859 (15.5) 1
Medical aid program 127/636 (20.0) 1.31 (1.06, 1.61) 0.012
Sensitivity analysis: Overall 1-year mortality
National Health Insurance program 289/1859 (15.5) 1
Medical aid program: Type 1 124/600 (20.7) 1.36 (1.10, 1.68) 0.004
Medical aid program: Type 2 3/36 (8.3) 0.51 (0.16, 1.60) 0.247
Competing risk analysis Cardiovascular 1-year mortality
National Health Insurance program 37/1859 (2.0) 1
Medical aid program 17/636 (2.7) 1.36 (0.77, 2.42) 0.290
Cancer-related 1-year mortality
National Health Insurance program 122/1859 (6.6) 1
Medical aid program 52/636 (8.2) 1.27 (0.92, 1.76) 0.145
Neurologic disease related 1-year mortality
National Health Insurance program 22/1859 (1.2) 1
Medical aid program 13/636 (2.0) 1.75 (0.88, 3.48) 0.109
1-year mortality due to injury or trauma
National Health Insurance program 15/1859 (0.8) 1
Medical aid program 9/636 (1.4) 1.79 (0.78, 4.09) 0.168
HR, hazard ratio; CI, confidence interval.
100 90 80 70 60
100 90 80 70
60
360 360
270 270
180 180
Time (day) Time (day)
Overall survival after ICU discharge before propensity score matching Overall survival after ICU discharge after propensity score matching
National Health Insurance National Health Insurance
National Health Insurance National Health Insurance
p<0.001 p=0.011
Medical aid program Medical aid program
Medical aid program Medical aid program
17130 1859
640 636
16046 1699
576 572
15625 1640
548 544
15319 1604
532 528
15070 1571
514 511
90 90
0 0
Survival probability (%) Survival probability (%)
Fig. 2. Kaplan-Meir curve of overall survival after intensive care unit (ICU) discharge before (A) and after (B) propensity score matching.
A B
present study, and it was inevitable that a lot of samples were discarded through PS matching in this study. Fourth, we did not consider the difference in income levels of patients within NHI group, as specific and individual income level was not col- lected at our institution to protect the privacy of individual pa- tients. The spectrum of economic status represented by NHI group might be broad, which might affect our results. Lastly, since the two groups differed in economic status, the treatments received in the ICU might be different. For example, MAP group would not have received the same treatment as non-reimburs- able ones. Therefore, the lack of analysis of the treatment lev- els associated with insurance types was an important limitation of this study.
In conclusion, this retrospective cohort study showed that ICU survivors with low economic status experience higher 1-year mortality. Our results suggest the necessity of a more nuanced and multifaceted approach to policy for ICU survivors with low economic status.
AUTHOR CONTRIBUTIONS
Conceptualization: Tak Kyu Oh and Jun Kwon Cha. Data curation: In- Ae Song and Jun Kwon Cha. Formal analysis: Tak Kyu Oh. Funding acquisition: Jun Kwon Cha. Investigation: Tak Kyu Oh. Methodology:
Tak Kyu Oh and Jun Kwon Cha. Project administration: In-Ae Song.
Resources: Jun Kwon Cha. Software: Tak Kyu Oh. Supervision: Tak Kyu Oh. Validation: Tak Kyu Oh. Visualization: Jun Kwon Cha. Writ- ing—original draft: Jun Kwon Cha. Writing—review & editing: Tak Kyu Oh and In-Ae Song.
ORCID iDs
Jun Kwon Cha https://orcid.org/0000-0003-0646-3615 Tak Kyu Oh https://orcid.org/0000-0002-4027-4423 In-Ae Song https://orcid.org/0000-0002-7814-4253
REFERENCES
1. Brinkman S, de Jonge E, Abu-Hanna A, Arbous MS, de Lange DW, de Keizer NF. Mortality after hospital discharge in ICU pa- tients. Crit Care Med 2013;41:1229-36.
2. Goldhill DR, Sumner A. Outcome of intensive care patients in a group of British intensive care units. Crit Care Med 1998;26:1337-45.
3. Moreno R, Morais P. Outcome prediction in intensive care: results of a prospective, multicentre, Portuguese study. Intensive Care Med 1997;23:177-86.
4. Winters BD, Eberlein M, Leung J, Needham DM, Pronovost PJ, Sevransky JE. Long-term mortality and quality of life in sepsis: a systematic review. Crit Care Med 2010;38:1276-83.
5. Sukantarat KT, Williamson RC, Brett SJ. Psychological assessment of ICU survivors: a comparison between the Hospital Anxiety and Depression scale and the Depression, Anxiety and Stress scale.
Anaesthesia 2007;62:239-43.
6. Schofield-Robinson OJ, Lewis SR, Smith AF, McPeake J, Alderson P. Follow-up services for improving long-term outcomes in inten- sive care unit (ICU) survivors. Cochrane Database Syst Rev 2018;
11:CD012701.
Table 3. Multivariable Cox Regression Model for 1-Year Overall Mortal- ity in Entire Cohort
Variables Hazard ratio
(95% CI) p value Insurance: Model 1*
National Health Insurance program 1
Medical aid program 1.26 (1.05, 1.51) 0.015
Insurance: Model 2
National Health Insurance program 1
Medical aid program: Type 1 1.25 (1.04, 1.51) 0.017 Medical aid program: Type 2 1.38 (0.44, 4.31) 0.574 Other variables in model 1*
Age (yr) 1.04 (1.04. 1.05) <0.001
Body mass index (kg/m2) 0.88 (0.87, 0.89) <0.001 Sex: male (vs. female) 1.26 (1.14, 1.39) <0.001
APACHE II 1.02 (1.01, 1.02) <0.001
Highest educational attainment
Lower than high school 1
More than or equal to high school, lower than college
1.11 (1.00, 1.23) 0.052
More than or equal to college 1.01 (0.91, 1.13) 0.798 Marital status
Never married 1
Married or living with someone 0.55 (0.44, 0.70) <0.001
Divorced or separated 0.69 (0.49, 0.96) 0.027
Widowed 0.65 (0.50, 0.84) 0.001
Comorbidities
Hypertension 0.90 (0.83, 0.99) 0.033
Diabetes mellitus 1.06 (0.92, 1.22) 0.404
History of coronary artery disease 0.77 (0.55, 1.06) 0.105 History of cerebrovascular disease 1.46 (1.23, 1.72) <0.001 Liver disease (hepatitis, liver cirrhosis,
fatty liver)
1.57 (1.27, 1.95) <0.001
Chronic obstructive lung disease 1.05 (0.88, 1.26) 0.602 Chronic kidney disease 1.70 (1.53, 1.88) <0.001
Cancer 4.85 (4.41, 5.34) <0.001
Admitting department
Internal medicine or emergency medicine 1
Neurologic center 0.54 (0.47, 0.63) <0.001
Cardiothoracic surgical department 0.41 (0.36, 0.46) <0.001 Other surgical department 0.32 (0.28, 0.37) <0.001 Year of ICU discharge
2012 1
2013 0.94 (0.81, 1.10) 0.445
2014 0.86 (0.75, 0.99) 0.042
2015 0.74 (0.64, 0.86) <0.001
2016 0.57 (0.49, 0.66) <0.001
CI, confidence interval; APACHE, Acute Physiology and Chronic Health Evalu- ation; ICU, intensive care unit.
*C-index: 0.82 (95% CI: 0.81, 0.83).
7. Gayat E, Cariou A, Deye N, Vieillard-Baron A, Jaber S, Damoisel C, et al. Determinants of long-term outcome in ICU survivors: re- sults from the FROG-ICU study. Crit Care 2018;22:8.
8. Lone NI, Gillies MA, Haddow C, Dobbie R, Rowan KM, Wild SH, et al. Five-year mortality and hospital costs associated with surviv- ing intensive care. Am J Respir Crit Care Med 2016;194:198-208.
9. Garland A, Olafson K, Ramsey CD, Yogendran M, Fransoo R. A population-based observational study of intensive care unit-re- lated outcomes. With emphasis on post-hospital outcomes. Ann Am Thorac Soc 2015;12:202-8.
10. Khandelwal N, Hough CL, Downey L, Engelberg RA, Carson SS, White DB, et al. Prevalence, risk factors, and outcomes of finan- cial stress in survivors of critical illness. Crit Care Med 2018;46:
e530-e9.
11. Baldwin MR, Sell JL, Heyden N, Javaid A, Berlin DA, Gonzalez WC, et al. Race, ethnicity, health insurance, and mortality in older sur- vivors of critical illness. Crit Care Med 2017;45:e583-e91.
12. Yoo S, Lee KH, Lee HJ, Ha K, Lim C, Chin HJ, et al. Seoul National University Bundang Hospital’s electronic system for total care.
Healthc Inform Res 2012;18:145-52.
13. Song YJ. The South Korean health care system. JMAJ 2009;52:206-9.
14. Lee J, Lee JS, Park SH, Shin SA, Kim K. Cohort profile: the National Health Insurance Service-National Sample Cohort (NHIS-NSC), South Korea. Int J Epidemiol 2017;46:e15.
15. Rosenbaum PR, Rubin DB. Reducing bias in observational studies using subclassification on the propensity score. J Am Stat Assoc 1984;79:516-24.
16. Franse CB, van Grieken A, Qin L, Melis RJF, Rietjens JAC, Raat H.
Socioeconomic inequalities in frailty and frailty components among
community-dwelling older citizens. PLoS One 2017;12:e0187946.
17. Szanton SL, Seplaki CL, Thorpe RJ Jr, Allen JK, Fried LP. Socioeco- nomic status is associated with frailty: the Women’s Health and Aging Studies. J Epidemiol Community Health 2010;64:63-7.
18. Ferrante LE, Pisani MA, Murphy TE, Gahbauer EA, Leo-Summers LS, Gill TM. The Association of Frailty With Post-ICU Disability, Nursing Home Admission, and Mortality: a longitudinal study.
Chest 2018;153:1378-86.
19. Bagshaw SM, Stelfox HT, Johnson JA, McDermid RC, Rolfson DB, Tsuyuki RT, et al. Long-term association between frailty and health- related quality of life among survivors of critical illness: a pro- spective multicenter cohort study. Crit Care Med 2015;43:973-82.
20. Andersen RM. Revisiting the behavioral model and access to medi- cal care: does it matter? J Health Soc Behav 1995;36:1-10.
21. Lone NI, Lee R, Salisbury L, Donaghy E, Ramsay P, Rattray J, et al.
Predicting risk of unplanned hospital readmission in survivors of critical illness: a population-level cohort study. Thorax 2018 Apr 5 [Epub]. Available at: https://doi.org/10.1136/thoraxjnl-2017-210822.
22. van Beusekom I, Bakhshi-Raiez F, de Keizer NF, Dongelmans DA, van der Schaaf M. Reported burden on informal caregivers of ICU survivors: a literature review. Crit Care 2016;20:16.
23. Guessous I, Luthi JC, Bowling CB, Theler JM, Paccaud F, Gaspoz JM, et al. Prevalence of frailty indicators and association with socio- economic status in middle-aged and older adults in a swiss region with universal health insurance coverage: a population-based cross- sectional study. J Aging Res 2014;2014:198603.
24. Lu Y. Dynamic frailty count process in insurance: a unified frame- work for estimation, pricing, and forecasting. Journal of Risk and Insurance 2018;85:1083-102.