Electrochemical Evaluation of Si-Incorporated Diamond-Like Carbon (DLC) Coatings Deposited on STS 316L and
Ti Alloy for Biomedical Applications
†Jung-Gu Kim, Kwang-Ryeol Lee1, Young-Sik Kim2, and Woon-Suk Hwang3
Department of Advanced Materials Engineering, Sungkyunkwan University 300 Chunchun-Dong, Jangan-Gu, Suwon 440-746, Korea
1Future Technology Research Division, Korea Institute of Science and Technology P.O. Box 131, Cheongryang, Sungbuk-Gu, Seoul 130-650, Korea
2School of Advanced Materials Engineering, Andong National University 388 Songchun, Andogn, 760-749, Korea
3School of Materials Science and Engineering, Inha University Incheon, 402-751, Korea
DLC coatings have been deposited onto substrate of STS 316L and Ti alloy using r.f. PACVD (plasma-assisted chemical vapor deposition) with a mixture of C6H6 and SiH4 as the process gases. Corrosion performance of DLC coatings was investigated by electrochemical techniques (potentiodynamic polarization test and electrochemical impedance spectroscopy) and surface analysis (scanning electron microscopy). The electrolyte used in this test was a 0.89% NaCl solution of pH 7.4 at temperature 37℃. The porosity and protective efficiency of DLC coatings were obtained using potentiodynamic polarization test. Moreover, the delamination area and volume fraction of water uptake of DLC coatings as a function of immersion time were calculated using electrochemical impedance spectroscopy. This study provides the reliable and quantitative data for assessment of the effect of substrate on corrosion performance of Si-DLC coatings. The results showed that Si-DLC coating on Ti alloy could improve corrosion resistance more than that on STS 316L in the simulated body fluid environment. This could be attributed to the formation of a dense and low-porosity coating, which impedes the penetration of water and ions.
Keywords : DLC, corrosion, STS 316L, Ti alloy, coating
†Corresponding author: kimjg@skku.ac.kr
1. Introduction
The materials selected for biomedical applications come after years of research into the chemical and physical pro- perties of a host of different candidate materials. Ideally, the material of choice will not only be biocompatible, but also have electrochemical properties that match the biomaterial being replaced bone of human. STS 316L and Ti alloy have several advantages such as superior biocom- patibility and corrosion resistance.1)-3) However, the overall reaction of the human body on an implant is a system property that includes many different aspects, such as surface chemistry, implant movement, biodegradation and surgical aspects. The highly corrosive environment of the human body restricts the materials to be used for im- plants.4) High corrosion resistance is required for the
material to use in this corrosive environment.5) Moreover, wear debris produced from movement of joints can lead to wear-corrosion causing biodegradation.6) Recently, many researchers have focused on the development of advanced biomaterials to complement these drawbacks. DLC coa- tings are suitable materials for biomedical application.
DLC coatings have been the subject of extensive investi- gation in recent years because of its potential of attaining highly desirable properties of technological interest.7) Many authors have noted the potential of DLC coatings as a protective coating for biomedical applications. DLC coatings have been reported to have good biocompatibility, such as the absence of inflammatory responses in vitro when assessed by mouse peritoneal macrophages,8) and the absence of histopathological changes in vivo when im- planted in animal bone.9) Furthermore, the unique com- bination of corrosion resistance, wear resistance, low friction, chemical inertness and electrical insulation make
DLC increasingly the preferred candidate for wear-resistant and protective coatings. However, it is difficult to obtain the coatings which exhibit good adhesion on substrates.
Another authors have informed on the use of amorphous silicon intermediate layer to improve the adhesion of DLC coatings using r.f. PACVD method.10)
This study is focused on the evaluation of the elec- trochemical performance of Si-DLC coatings on STS 316L and Ti alloy with amorphous silicon intermediate layer prepared by r.f. PACVD using electrochemical techniques.
2. Experimental procedure
2.1 Coating deposition
Si-wafer, STS 316L and Ti alloy (Ti-6Al-4V) were used as substrate materials. Samples of 37 mm diameter were cut from a 2 mm thick sheet. DLC coatings were deposited on mirror-polished substrate. The sample surfaces were mechanically ground and polished using 2000-grit SiC and 0.3 ㎛ diamond paste for the final step. After cleaning with methanol, the polished samples were stored under vacuum. A substrate was placed on the water-cooled cathode where 13.56 MHz r.f. power was delivered through the impedance-matching network. Before deposition, sub- strates were precleaned using argon ion for 15 min at bias voltage of -400 V and pressure of 9.975×10⁻³ Torr. The precursor gas was used as a mixture of C6H6 and silane (SiH4) for the Si-DLC coatings. In r.f. PACVD method, the vacuum vessel is pumped by a rotary pump to a base pressure of approximately 2.0×10⁻⁵ Torr prior to depo- sition. A dense Si interlayer of thickness approximately 0.01 ㎛ is deposited onto the substrate prior to DLC coating. The interlayer is deposited primarily to control and set up a residual stress gradient between the DLC coating and the substrate. A total coating thickness of about 1 ㎛ was achieved in all cases. The film thickness was analyzed by alpha-step profilometer.
2.2 Surface analysis
The SEM investigations were used to examine the surface morphology of the coatings as well as the corroded surfaces of tested specimens. The SEM investigations took place with a voltage of 20 keV.
2.3 Electrochemical measurements
Potentiodynamic polarization test was determined with an EG&G Princeton Applied Research Model 273A potentiostat. Potentiodynamic polarization test was carried out in a 0.89% NaCl solution of pH 7.4 at temperature 37 ℃ which was thoroughly deaerated by bubbling high purity nitrogen gas for 30 min prior to the immersion of
the specimen and continuously purged during the test. This solution was simulated as a human body environment. The exposed coating area was 1 cm2. Reference and counter electrodes were used for a saturated calomel electrode (SCE) and a pure graphite, respectively. Prior to the be- ginning of the potentiodynamic polarization test, the specimens were kept in the solution for 6 h in order to establish the open-circuit potential (OCP). The potential of the electrode was swept at a rate of 0.166 mV/s from the initial potential of -250 mV versus Ecorr to the final potential of 1500 mVSCE. The porosity of DLC coating is estimated using electrochemical techniques. Porous coatings can not prevent the diffusion of aggressive agents through the coating, which lead to delamination of the coating. The porosity can be determined from the measured polarization resistance. Matthews et al.11) established an empirical equation to estimate the porosity (P) of the coatings:
(1)
where P was the total coating porosity, Rpm the polarization resistance of the substrate and Rp the measured polari- zation resistance of the coated steel system. ΔEcorr is the potential difference between the free corrosion potentials of the coated steel and the bare substrate, and βa the anodic Tafel slope for the substrate. Also, protective efficiency (Pi) of the coating was determined from the polarization curve by Eq. (2):
(2)
where icorr and iocorr indicate that the corrosion current densities in the presence and absence of the coating, respectively.12)
Electrochemical impedance spectroscopy (EIS) has been frequently used as a non-destructive testing method for assessing the protective performance of coating. Moreover, EIS has been recognized as the powerful instrument to know the surface of the specimens.13) EIS data were ob- tained by a Zahner IM6e system using commercial soft- ware (THALES) program for AC measurement. Impe- dance measurements were performed by applying a sinusoidal wave of 10 mV in amplitude to the working electrode at the frequency range from 10 kHz and 10 mHz.
The impedance diagrams were interpreted on the basis of the equivalent circuit using THALES fitting program. EIS has been used to determine the amount of delamination and water uptake of coatings exposed to an electrolyte.
(a) (b)
(c) (d)
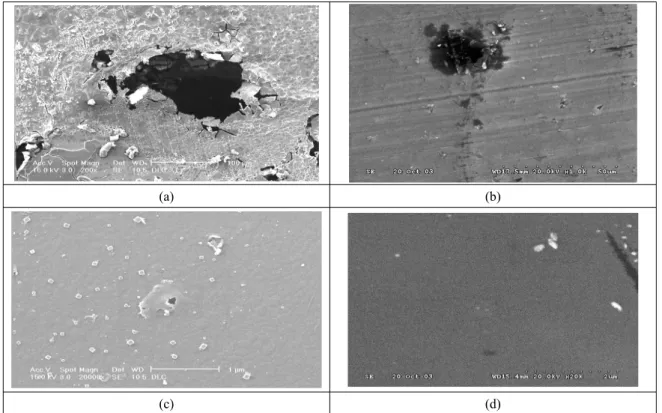
Fig. 1. SEM images showing surface morphologies of DLC coatings after polarization test; (a) STS 316L, (b) Ti alloy, (c) Si-DLC coating on STS 316L, (d) Si-DLC coating on Ti alloy
Thus, the extent of delamination area (Ad) and volume fraction of water uptake (V) could be determined from experimental values of pore resistance (Rpore) and coating capacitance (Ccoat) obtained by the impedance diagrams on the basis of the equivalent circuit.14)
(3)
(4)
(5)
where Ropore was characteristic value for the corrosion reaction at the solution/coating interface, d coating thickness, ρthe coating resistivity, Ccoat(t) the coating capacitance as a function of time (t) and Ccoat (0) the initial coating capacitance obtained from EIS data at initial exposure.
3. Results and discussion
3.1 Surface analysis
After the completion of potentiodynamic polarization
test, the morphology and corrosion features of each sub- strate and coated system were inspected by SEM and the resulting micrographs are shown in Fig. 1. Pitting was observed on both STS 316L and Ti alloy sustrates in Figs.
1 (a) and (b). The surface morphology of Si-DLC coating on STS 316L showed some pitting areas, as indicated in Fig. 1(c). The surface morphology of Si-DLC coating on Ti alloy almost indicated no evidence of penetration of water and ions, as shown in Fig. 1(d). This clearly indi- cates that Si-DLC coating on Ti alloy have excellent corrosion resistance, and no damage has been observed.
Moreover, it is also indicated that the penetration of water and ions of Si-DLC coating on Ti alloy is less than that of Si-DLC coating on STS 316L.
3.2 Electrochemical properties
Potentiodynamic polarization test was carried out in order to investigate the protective abilities of coating.
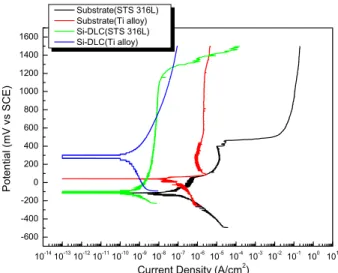
Potentiodynamic polarization curves for Si-DLC coatings in the simulated body fluid environment are shown in Fig.
2. The measured corrosion potential (Ecorr), corrosion current density (icorr), porosity (P) and protective efficiency (Pi) are given in Table 1. The corrosion current density of 0.06486 nA/cm2 for Si-DLC coating on STS 316L and that of 0.04099 nA/cm2 for Si-DLC coating on Ti alloy were examined. It was seen that the passive region was
Table 1. Results of potentiodynamic polarization tests; (a) DLC coating on STS 316 L, (b) DLC coating on Ti alloy (Ti-6Al-4V).15) (a)
Specimen Ecorr
(mV)
icorr
(nA/㎠)
βa (V/decade)
βc (V/decade)
Rp
(×103 Ω㎠)
Protective
efficiency (%) Porosity
Substrate(STS 316L) -114.6 249.3 0.1285 0.1868 132.7 - -
Si-DLC
Bias voltage = -400V -111.6 0.06486 0.3527 0.06077 347492.9 99.97 0.00037
(b) Specimen Ecorr
(mV)
icorr
(nA/㎠)
βa (V/decade)
βc (V/decade)
Rp
(×103 Ω㎠)
Protective
efficiency (%) Porosity
Substrate(Ti alloy) -5.48 195.6 0.1142 0.4451 202.2 - -
Si-DLC
Bias voltage(-400V) 270.6 0.04099 0.2353 0.6027 1795037 99.98 0.00000043
10-1410-1310-1210-1110-1010-910-810-710-610-510-410-310-210-1 100 101 -600
-400 -200 0 200 400 600 800 1000 1200 1400 1600
Potential (mV vs SCE)
Current Density (A/cm2) Substrate(STS 316L)
Substrate(Ti alloy) Si-DLC(STS 316L) Si-DLC(Ti alloy)
Fig. 2. Potentiodynamic polarization curves in deaerated 0. 89%
NaCl solution at 37℃ (pH=7.4);
formed on all the DLC coatings on STS 316L and Ti alloy.
It means that Si-DLC coating on Ti alloy with fewer pores makes the substrate more passive than DLC coating on STS 316L with more pores. A combination of the equation of A. Matthews et al.11) and the electrochemical determi- nations gives the porosity of 0.00037 for Si-DLC on STS 316L and the porosity of 0.000043 for Si-DLC coating on Ti alloy. This pore can weaken the interfacial material and provide an easy fracture path for metallic ions release.
It was shown that the porosity of DLC coating on Ti alloy was lower than that of DLC coating on STS 316 L. The lower the porosity, the denser the coating. Moreover, the lower the calculated porosity, the lower the corrosion current density. This means that the open channels of the substrate contacting with solution, which is often called pinhole, are significantly diminished. Therefore, the possi-
Si-DLC (STS316L) Si-DLC (Ti alloy) 0
20 40 60 80 100
Specimens
Protective Efficiency (%)
Fig. 3. Comparison of protective efficiency between DLC coating on STS 316L and DLC coating on Ti alloy
bility of a corrosive attack can be avoided and decreased.
Fig. 3 shows the protective efficiency calculated from corrosion current density described in Table 1.15) The pro- tective efficiency was 99.97 % and 99.98 % of Si-DLC coating on STS 316L and Ti alloy, respectively. It is shown that the protective efficiency of DLC coating on Ti alloy was higher than that of DLC coating on STS 316L. This is closely related to the corrosion protective ability and durability of coatings under conditions of appli- cations. Thus, potentiodynamic polarization test were con- sistent with porosity measurement and protective effi- ciency measurement. If the coating had poor adhesion strength, the coating was extruded by the corrosion pro- ducts and detached from substrate, and this made the corrosion products of substrate more severe. This means
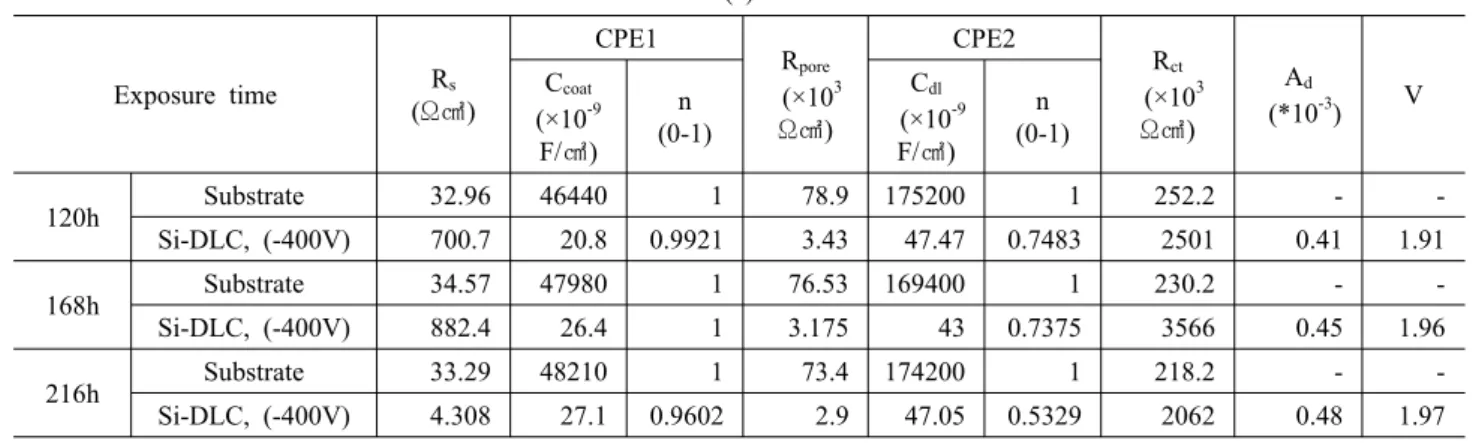
Table 2. Result of electrochemical impedance spectroscopy measurements; (a) DLC coating on STS 316L, (b) DLC coating on Ti alloy (Ti-6Al-4V).16)
(a)
Exposure time Rs
(Ω㎠)
CPE1 Rpore
(×103 Ω㎠)
CPE2 Rct
(×103 Ω㎠)
Ad
(*10-3) V Ccoat
(×10-9 F/㎠)
n (0-1)
Cdl
(×10-9 F/㎠)
n (0-1)
120h Substrate 32.96 46440 1 78.9 175200 1 252.2 - -
Si-DLC, (-400V) 700.7 20.8 0.9921 3.43 47.47 0.7483 2501 0.41 1.91
168h Substrate 34.57 47980 1 76.53 169400 1 230.2 - -
Si-DLC, (-400V) 882.4 26.4 1 3.175 43 0.7375 3566 0.45 1.96
216h Substrate 33.29 48210 1 73.4 174200 1 218.2 - -
Si-DLC, (-400V) 4.308 27.1 0.9602 2.9 47.05 0.5329 2062 0.48 1.97
(b)
Exposure time Rs
(Ω㎠)
CPE1 Rpore
(*103 Ω㎠)
CPE2 Rct
(*103 Ω㎠)
Ad
(*10-4) V Ccoat
(*10-9 F/㎠)
n (0-1)
Cdl
(×10-9 F/㎠)
n (0-1)
120h Substrate 8334 20040 0.9944 33.28 29360 1 343.3 - -
Si-DLC, (-400V) 19470 0.759 0.9088 28799 13.05 1 324700 0.00049 0.15
168h Substrate 1042 27530 1 39.52 33080 1 345.2 - -
Si-DLC, (-400V) 18540 0.816 0.9248 27789 13.89 1 298500 0.00051 1.17
216h Substrate 1734 30470 1 44.61 34250 1 253.4 - -
Si-DLC, (-400V) 24540 0.897 0.8994 23569 14.72 1 299700 0.00060 1.19
1 24 48 72 96 120 144 168 192 216
0 5000 10000 15000 20000 25000 30000 300000 400000
Rct (kohm.cm2 )
Immersion Time(h)
Substrate(STS316L) Substrate(Ti alloy) Si-DLC(STS316L) Si-DLC(Ti alloy)
Fig. 4. Charge transfer resistance values as a function of immersion time between DLC coating on STS 316L and DLC coating on Ti alloy
that the detachment of coating makes the corrosive attack of interface between coating and substrate easier. That is, corrosion resistance is dependent on porosity, protective efficiency and adhesion strength of coating.
Interpretation of the EIS measurements is usually done by fitting the impedance data to an equivalent circuit, which is representative of the physical processes taking place in the system under investigation. According to the Table 216) and Fig. 4, the charge transfer resistance (Rct) of DLC coating on Ti alloy was higher than that of Si-DLC coating on STS 316L. It is important that the high Rct
value indicates good corrosion resistance. Furthermore, it is also shown that Si-DLC coatings on Ti alloy have improved corrosion resistance more than that of DLC coating on STS 316L in corrosive environment.
Also, the results obtained from EIS measurements were usually used to monitor the change of delamination area (Ad) and volume fraction of water uptake (V). Figs. 5 and 6 show delamination area (Ad) and volume fraction of water uptake (V) of Si-DLC coatings on STS 316 L and Ti alloy, respectively. The delamination area of Si-DLC coating on STS 316L is much higher than that of Si-DLC coating on Ti alloy. Delamination area was affected by the volume fraction of water uptake through porous coa- ting because penetration of water in coating lead to delami-
1 24 48 72 96 120 144 168 192 216 -1
0 1 2
Delamination Area(*10-3 ,Ad)
Immersion Time(h)
Si-DLC on STS316L Si-DLC on Ti alloy
Fig. 5. Delamination area as a function of immersion time.
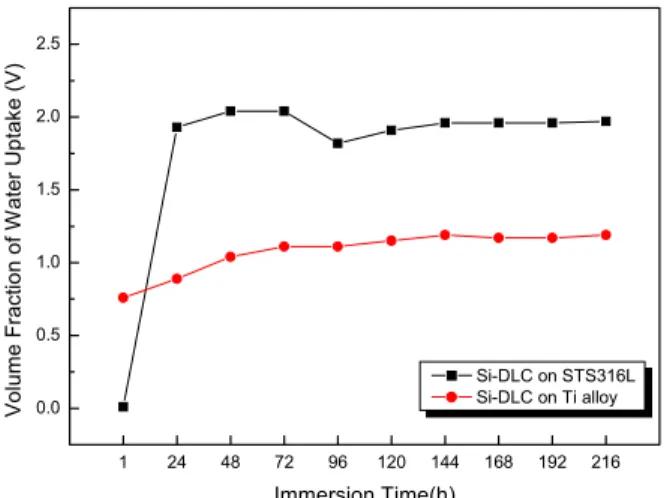
1 24 48 72 96 120 144 168 192 216
0.0 0.5 1.0 1.5 2.0 2.5
Volume Fraction of Water Uptake (V)
Immersion Time(h)
Si-DLC on STS316L Si-DLC on Ti alloy
Fig. 6. Volume fraction of water uptake as a function of immersion time.
nation and blisters. It is seen that longer time of exposure leads to a continuous increase of the volume fraction of water uptake, as shown Fig. 6. Especially, the volume fraction of water uptake of Si-DLC coating on STS 316L tends to absorb more water due to the enhancement of diffusion mechanisms of active species through the coating. Consequently, delamination area and the volume fraction of water uptake of Si-DLC coating on Ti alloy are lower than those of Si-DLC coating on STS 316L, as shown in Figs. 5 and 6. This implies that Si-DLC coating on Ti alloy permeate less amount of water and ions than DLC coating on STS 316L.
The excellent agreement between the delamination area and the volume fraction of water uptake over the test period suggests that porosity is indeed strongly related to the coating delamination and the fraction of the substrate which is wetted by the electrolyte through defects.
4. Conclusions
(1) Si-DLC coating on Ti alloy (Ti-6Al-4V) showed lower corrosion current density, porosity and higher pro- tective efficiency than that on STS 316L, indicating better corrosion resistance.
(2) Delamination area and the volume fraction of water uptake of Si-DLC coating on Ti alloy are lower than those of Si-DLC coating on STS 316L
(3) From the SEM analyses, the surface morphology of Si-DLC coating on Ti alloy indicated no evidence of pitting while that on STS 316L showed some pitting.
(4) The corrosion resistance of DLC coating on Ti alloy was better than that of DLC coating on STS 316L due to the low porosity.
Acknowledgments
This work was supported by Grant No. R11-2000-096- 0000-0 from the Center of Excellency Program of the KOSEF, MOST.
References
1. K. Bordji, J. Jouzeau, D. Mainard, E. Payan, J.
Delagoutte, and P. Netter, Biomaterials, 17, 491 (1996).
2. H. Matsuno, A. Yokoyama, F. Watari, M. Uo, and T.
Kawasaki, Biomaterials, 22, 1253 (2001).
3. I. S. Lee, Met. Mater. Int., 3, 144 (1997).
4. R. Hauert, Diam. Relat. Mater., 12, 583 (2003).
5. Y. Hayashi and G. Nakayama, Corrosion Science and Technology, 1, 491 (2002).
6. H. Kim and J. J. Lee, J. Kor. Inst. Met. and Mater., 16, 11 (2003).
7. P. Papakonstantinou, J. F Zhao, P. Lemoine, E. T.
McAdams, and J. A. McLaughlin, Diam. Relat. Mater., 11, 1074 (2002).
8. L. A. Thomson, F. C. Law, N. Rushton, and J. Franks, Biomaterials, 12, 37 (1991).
9. D. P. Dowling, P. V. Kola, K. Donnelly, T. C. Kelly, K. Brumitt, L. Lloyd, R. Eloy, M. Therin, and N. Weill, Diam. Relat. Mater., 6, 390 (1997).
10. R. Butter, M. Allen, L. Chandra, A. H. Lettington, and N. Rushton, Diam. Relat. Mater., 4, 857 (1995).
11. B. Matthes, E. Brozeit, J. Aromaa, H. Ronkainen, S.
P. Hannula, A. Leyland, and A. Matthews, Surf. Coat.
Technol., 49, 489 (1991).
12. Y. J. Yu, J. G. Kim, S. H. Cho, and J. H. Boo, Surf.
Coat. Technol., 162, 161 (2003).
13. T. H. Ha, D. K. Kim, J. H. Bae, H. G. Lee, and S.
J. Lee, Corrosion Science and Technology, 1, 444 (2002).
14. F. Mansfeld and C. H. Tsai, Corrosion, 49, 727 (1993).
15. H. G. Kim, S. H. Ahn, and J. G. Kim, Diam. Relat.
Mater, 14, 35 (2005).
16. H. G. Kim, S. H. Ahn, and J. G. Kim, Thin Solid Films, 475, 291 (2005).