Tumor Size as a Prognostic Factor in Gastric Cancer Patient
Won Jin Im, Min Gyu Kim, Tae Kyung Ha, and Sung Joon Kwon Department of Surgery, Hanyang University College of Medicine, Seoul, Korea
Purpose: The purpose of this study is to investigate the prognostic significance of tumor size for 5-year survival rate in patients with gas- tric cancer.
Materials and Methods: A total of 1,697 patients with gastric cancer, who underwent potentially curative gastrectomy, were evaluated.
Patients were divided into 4 groups as follows, according to the median size of early and advanced gastric cancer, respectively: small early gastric cancer (tumor size ≤3 cm), large early gastric cancer (tumor size >3 cm), small advanced gastric cancer (tumor size ≤ 6 cm), and large advanced gastric cancer (tumor size >6 cm). The prognostic value of tumor size for 5-year survival rate was investigated.
Results: In a univariate analysis, tumor size is a significant prognostic factor in advanced gastric cancer, but not in early gastric cancer.
Multivariate analysis showed that tumor size is an independent prognostic factor for 5-year survival rate in advanced gastric cancer (P=0.003, hazard ratio=1.372, 95% confidence interval=1.115~1.690). When advanced gastric cancer is subdivided into 2 groups, according to serosa invasion: Group 1; serosa negative (T2 and T3, 7th AJCC), and Group 2; serosa positive (T4a and T4b, 7th AJCC), tumor size is an independent prognostic factor in Group 1 (P=0.011, hazard ratio=1.810, 95% confidence interval=1.149~2.852) and in Group 2 (P=0.033, hazard ratio=1.288, 95% confidence interval=1.020~1.627), respectively.
Conclusions: Tumor size is an independent prognostic factor in advanced gastric cancer irrespective of the serosa invasion, but not in early gastric cancer.
Key Words: Gastric cancer; Tumor size; Prognosis
Correspondence to: Sung Joon Kwon
Department of Surgery, Hanyang University College of Medicine, 222, Wangsimni-ro, Seongdong-gu, Seoul 133-791, Korea
Tel: +82-2-2290-8453, Fax: +82-2-2281-0224 E-mail: sjkwon@hanyang.ac.kr
Received June 8, 2012 Revised August 17, 2012 Accepted August 20, 2012
This is an open-access article distributed under the terms of the Creative Commons Attribution Non-Commercial License (http://creativecommons.org/
licenses/by-nc/3.0) which permits unrestricted noncommercial use, distribution, and reproduction in any medium, provided the original work is properly cited.
Introduction
The incidence of gastric cancer has gradually been declin- ing worldwide. However, gastric cancer has exhibited the highest prevalence rate in Korea, and it ranks as one of the leading causes of cancer death, followed by lung cancer.(1,2) In recent years, early cancer detection in many cases is gradually increasing due to diag- nosis technology advancement and frequent checkups. Moreover, a 5-year survival rate of gastric cancer has been showing an increas-
ing trend.(3,4) Due to the advancement of endoscopic and laparo- scopic surgery, the quality of life is improving and complications of surgery are reduced.(5) However, advanced gastric cancer (AGC) is still frequently detected,(6,7) and a 5-year survival rate of AGC is not promising despite curative gastrectomy.(8)
Clinico-pathologic characteristics affecting the prognosis of gastric cancer are depth of tumor invasion, nodal status, distant metastasis, macroscopic types of tumor, tumor size, histologic type and others.(3)
Tumor size belongs to the category of factors for determining stages of cancers including breast cancer, lung cancer, pancreatic cancer, and others.(9) Thus, stages are determined according to the sizes of tumor, and therapeutic treatments vary depending on the size. However, few studies have analyzed the effect of tumor size on the prognosis of gastric cancer. Hence, the authors of this study investigated the effect of tumor size on the prognosis of gastric
cancer.
Materials and Methods
This study conducted a retrospective analysis on 1,697 patients who underwent curative surgery among the total of 1,897 patients who received gastrectomy after a diagnosis with gastric cancer in the Department of Surgery of Hanyang University Medical Center, from June 1992 to August 2009. The curative surgery was defined as a surgery which was performed on M0 patients who underwent lymph node dissection with more than 16 dissected nodes without any distant metastasis. In case of adjacent organ invasion of T4b (7th American Joint Committee on Cancer [AJCC] staging system),(10) combined resection of invaded organs was carried out, and the resection margin must be negative. Study population comprised of 720 early gastric cancer (EGC) patients and 977 AGC patients. The median follow-up period was 50 months until August 31, 2011.
The follow-up rate was 97.0% (1,897/1,955). Tumor sizes ranged 0.3~15.0 cm (median=3 cm, mean±standard deviation [SD]=3.2
±2.1 cm) in case of EGC and 1.0~20.0 cm (median=6 cm, mean
±SD=6.4±3.0 cm) in case of AGC. By taking the median tumor size as the standard, the study defined tumors less than 3 cm in size as small tumors and those that are more than 3 cm in size as large tumors in EGC. Meanwhile, tumors less than 6 cm in size were set as small tumors and more than 6 cm as large tumors in AGC.
To analyze the survival rate in each group, univariate and mul- tivariate analyses were conducted on patient’s factors (age, sex), tumor factors (depth of invasion, nodal status, tumor size, tumor site, histologic type, lymphatic invasion, venous invasion, perineural invasion), and treatment factors (type of surgery).
PASW Statistics ver. 18.0 (IBM Co., Armonk, NY, USA) was used for statistical analysis. Kaplan-Meier survival analysis was performed for univariate analysis of the survival rate, while Cox regression analysis was performed for multivariate analysis. A P-
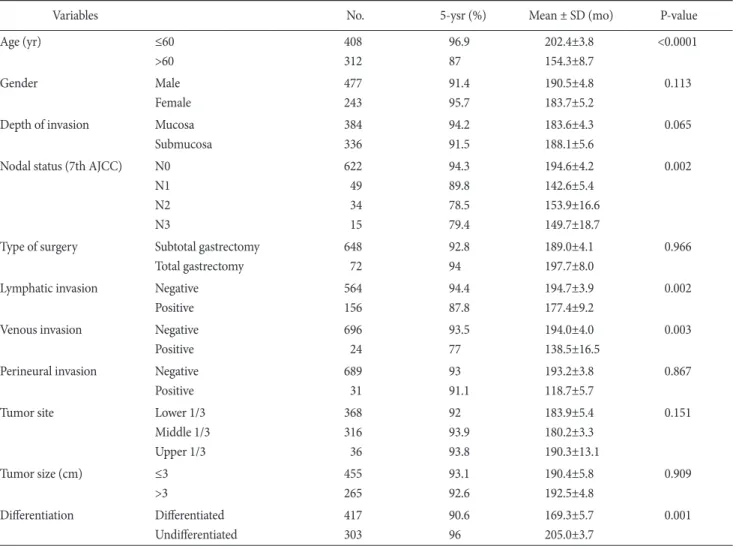
Table 1. Univariate survival analysis in early gastric cancer
Variables No. 5-ysr (%) Mean ± SD (mo) P-value
Age (yr) ≤60
>60
408 312
96.9 87
202.4±3.8 154.3±8.7
<0.0001
Gender Male
Female
477 243
91.4 95.7
190.5±4.8 183.7±5.2
0.113
Depth of invasion Mucosa Submucosa
384 336
94.2 91.5
183.6±4.3 188.1±5.6
0.065
Nodal status (7th AJCC) N0 N1 N2 N3
622 49 34 15
94.3 89.8 78.5 79.4
194.6±4.2 142.6±5.4 153.9±16.6 149.7±18.7
0.002
Type of surgery Subtotal gastrectomy Total gastrectomy
648 72
92.8 94
189.0±4.1 197.7±8.0
0.966
Lymphatic invasion Negative Positive
564 156
94.4 87.8
194.7±3.9 177.4±9.2
0.002
Venous invasion Negative
Positive
696 24
93.5 77
194.0±4.0 138.5±16.5
0.003
Perineural invasion Negative Positive
689 31
93 91.1
193.2±3.8 118.7±5.7
0.867
Tumor site Lower 1/3
Middle 1/3 Upper 1/3
368 316 36
92 93.9 93.8
183.9±5.4 180.2±3.3 190.3±13.1
0.151
Tumor size (cm) ≤3
>3
455 265
93.1 92.6
190.4±5.8 192.5±4.8
0.909
Differentiation Differentiated Undifferentiated
417 303
90.6 96
169.3±5.7 205.0±3.7
0.001
No. = number of patients; 5-ysr = 5-year survival rate; SD = standard deviation; AJCC = American Joint Committee on Cancer.
value of less than 0.05 was considered statistically significant.
Results
1. EGC
Among the 720 patients falling under EGC, patients with small tumors and large tumors were 455 and 265, respectively. The 5-year survival rate of small tumors was 93.1% (mean: 190±5.8 months), while that of large tumors was 92.6% (mean: 192.5±4.8 months) in EGC patients (P=0.909) (Table 1). Thus, no difference was observed in the survival rate depending on the tumor size in EGC.
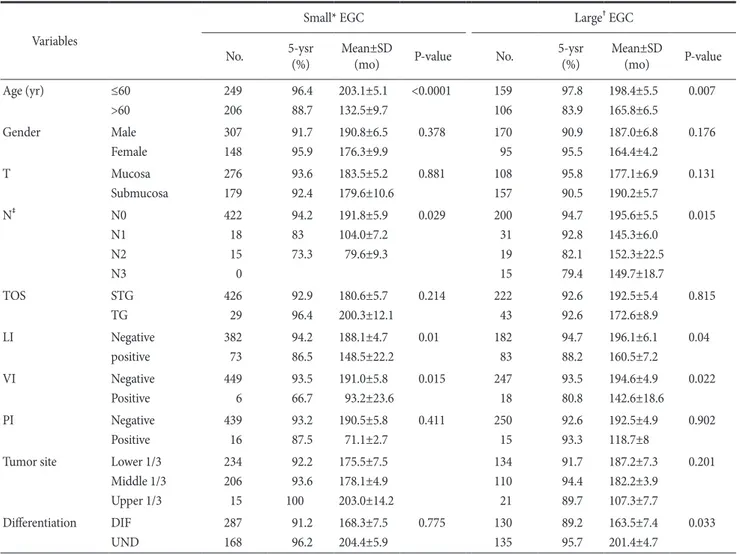
According to the univariate analysis of small tumors on the sur- vival in EGC, statistically significant factors were age, nodal status,
lymphatic invasion, and venous invasion. According to the uni- variate analysis of large tumors on survival, statistically significant factors were age, nodal status, lymphatic invasion, venous invasion, and histologic type (Table 2).
Moreover, statistically significant factors were age and histologic type in the multivariate analysis on survival in all EGC groups and large tumors in EGC. On the other hand, age was the only factor in small tumors in EGC (Table 3).
2. AGC
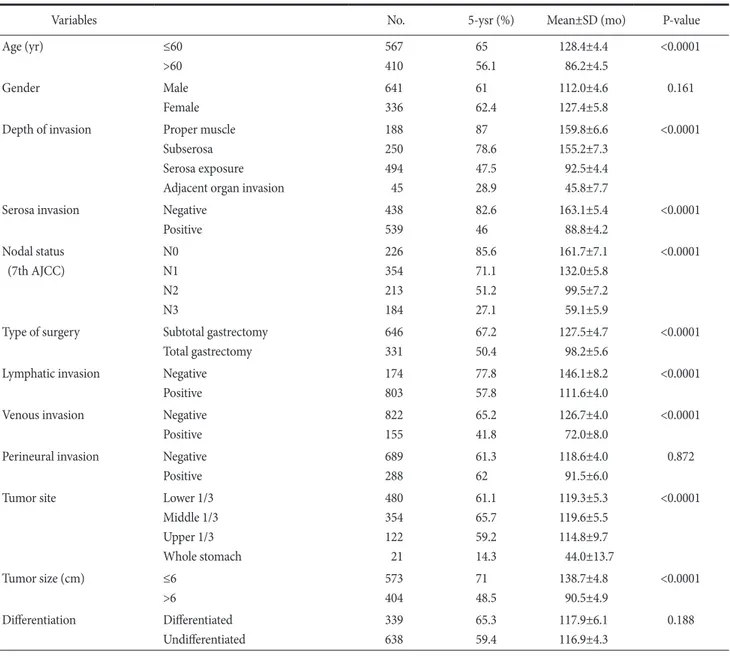
According to the univariate analysis on survival of all patients with AGC (n=977), statistically significant factors were age, serosa invasion, nodal status, type of surgery, lymphatic invasion, venous invasion, tumor site, and tumor size (Table 4). The depth of tumor
Table 2. Univariate survival analysis in early gastric cancer according to tumor size Variables
Small* EGC Large† EGC
No. 5-ysr
(%) Mean±SD
(mo) P-value No. 5-ysr
(%) Mean±SD
(mo) P-value
Age (yr) ≤60
>60
249 206
96.4 88.7
203.1±5.1 132.5±9.7
<0.0001 159 106
97.8 83.9
198.4±5.5 165.8±6.5
0.007
Gender Male
Female
307 148
91.7 95.9
190.8±6.5 176.3±9.9
0.378 170
95
90.9 95.5
187.0±6.8 164.4±4.2
0.176
T Mucosa
Submucosa
276 179
93.6 92.4
183.5±5.2 179.6±10.6
0.881 108
157
95.8 90.5
177.1±6.9 190.2±5.7
0.131
N‡ N0
N1 N2 N3
422 18 15 0
94.2 83 73.3
191.8±5.9 104.0±7.2 79.6±9.3
0.029 200
31 19 15
94.7 92.8 82.1 79.4
195.6±5.5 145.3±6.0 152.3±22.5 149.7±18.7
0.015
TOS STG
TG
426 29
92.9 96.4
180.6±5.7 200.3±12.1
0.214 222
43
92.6 92.6
192.5±5.4 172.6±8.9
0.815
LI Negative
positive
382 73
94.2 86.5
188.1±4.7 148.5±22.2
0.01 182
83
94.7 88.2
196.1±6.1 160.5±7.2
0.04
VI Negative
Positive
449 6
93.5 66.7
191.0±5.8 93.2±23.6
0.015 247
18
93.5 80.8
194.6±4.9 142.6±18.6
0.022
PI Negative
Positive
439 16
93.2 87.5
190.5±5.8 71.1±2.7
0.411 250
15
92.6 93.3
192.5±4.9 118.7±8
0.902
Tumor site Lower 1/3 Middle 1/3 Upper 1/3
234 206 15
92.2 93.6 100
175.5±7.5 178.1±4.9 203.0±14.2
134 110 21
91.7 94.4 89.7
187.2±7.3 182.2±3.9 107.3±7.7
0.201
Differentiation DIF UND
287 168
91.2 96.2
168.3±7.5 204.4±5.9
0.775 130
135
89.2 95.7
163.5±7.4 201.4±4.7
0.033
EGC = early gastric cancer; No. = number of patients; 5-ysr = 5-year survival rate; SD = standard deviation; T = depth of invasion; N = nodal status; TOS = type of surgery; STG = subtotal gastrectomy; TG = total gastrectomy; LI = lymphatic invasion; VI = venous invasion; PI = perineural
Table 3. Multivariate survival analysis in early gastric cancer
Variables B SE P-value HR 95% CI
All EGC Age (yr) ≤60
>60 1.215 0.297 <0.0001 3.369 1.881~6.035
Differentiation Differentiated
Undifferentiated -0.951 0.325 0.003 0.386 0.204~0.731
Small* EGC Age (yr) ≤60
>60 1.338 0.396 0.001 3.812 1.753~8.289
Large† EGC Age (yr) ≤60
>60 1.174 0.470 0.013 3.235 1.287~8.135
Differentiation Differentiated
Undifferentiated -1.102 0.497 0.027 0.332 0.125~0.880
B = the coefficient for the constant; SE = standard error; HR = hazard ratio; CI = confidence interval; EGC = early gastric cancer. *Less than 3 cm in diameter. †More than 3 cm in diameter.
Table 4. Univariate survival analysis in advanced gastric cancer (all)
Variables No. 5-ysr (%) Mean±SD (mo) P-value
Age (yr) ≤60
>60
567 410
65 56.1
128.4±4.4 86.2±4.5
<0.0001
Gender Male
Female
641 336
61 62.4
112.0±4.6 127.4±5.8
0.161
Depth of invasion Proper muscle Subserosa Serosa exposure Adjacent organ invasion
188 250 494 45
87 78.6 47.5 28.9
159.8±6.6 155.2±7.3 92.5±4.4 45.8±7.7
<0.0001
Serosa invasion Negative
Positive
438 539
82.6 46
163.1±5.4 88.8±4.2
<0.0001
Nodal status (7th AJCC)
N0 N1 N2 N3
226 354 213 184
85.6 71.1 51.2 27.1
161.7±7.1 132.0±5.8 99.5±7.2 59.1±5.9
<0.0001
Type of surgery Subtotal gastrectomy Total gastrectomy
646 331
67.2 50.4
127.5±4.7 98.2±5.6
<0.0001
Lymphatic invasion Negative Positive
174 803
77.8 57.8
146.1±8.2 111.6±4.0
<0.0001
Venous invasion Negative
Positive
822 155
65.2 41.8
126.7±4.0 72.0±8.0
<0.0001
Perineural invasion Negative Positive
689 288
61.3 62
118.6±4.0 91.5±6.0
0.872
Tumor site Lower 1/3
Middle 1/3 Upper 1/3 Whole stomach
480 354 122 21
61.1 65.7 59.2 14.3
119.3±5.3 119.6±5.5 114.8±9.7 44.0±13.7
<0.0001
Tumor size (cm) ≤6
>6
573 404
71 48.5
138.7±4.8 90.5±4.9
<0.0001
Differentiation Differentiated Undifferentiated
339 638
65.3 59.4
117.9±6.1 116.9±4.3
0.188
No. = number of patients; 5-ysr = 5-year survival rate; SD = standard deviation; AJCC = American Joint Committee on Cancer.
invasion of AGC were classified into the T2 or T3 (7th AJCC TNM staging system) group without serosal invasion, and the T4a or T4b (7th AJCC TNM staging system) group with serosal invasion.
A significant difference was observed in the survival rate of two groups (Table 4).
The survival rates between small tumors (n=573) and large tu- mors (n=404) were compared among AGC patients. The 5-year survival rate of small tumors was 71.0% (mean: 138.7±4.8 months), while that of large tumors was 48.5% (mean: 90.5±4.9 months) in AGC patients (P<0.0001) (Table 4). Thus, a statistically significant difference was observed in the survival rate depending
on the tumor size in AGC.
3. The relationship between tumor size and prog
nosis in advanced gastric cancer without serosal invasion
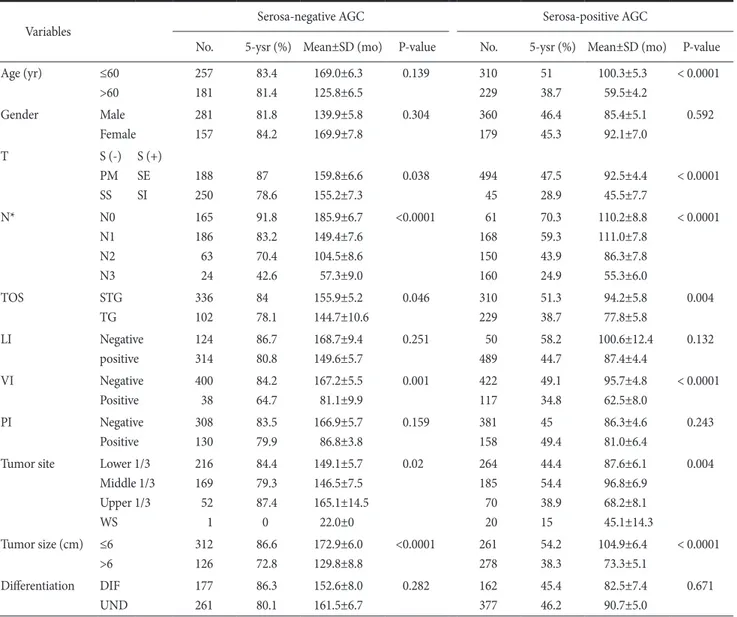
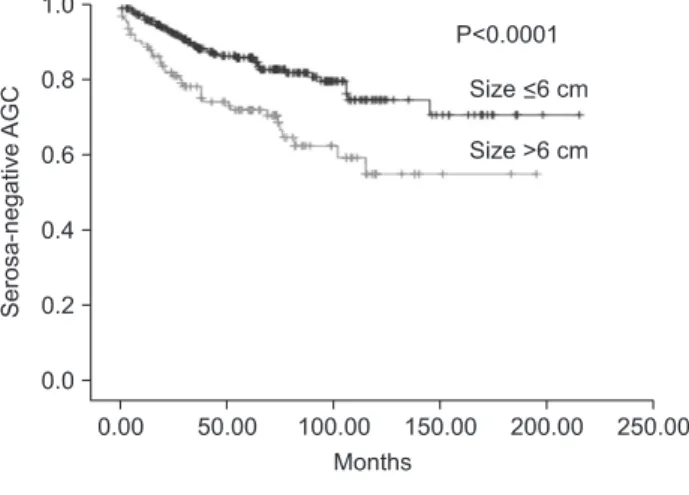
Statistical significance was observed in the depth of invasion, nodal status, type of surgery, venous invasion, tumor sites, as well as, tumor size, according to the univariate analysis on the prognosis related survival of T2 or T3 group without serosal invasion in AGC (Table 5, Fig. 1).
Table 5. Univariate survival analysis in serosa-negative and serosa-positive advanced gastric cancer
Variables Serosa-negative AGC Serosa-positive AGC
No. 5-ysr (%) Mean±SD (mo) P-value No. 5-ysr (%) Mean±SD (mo) P-value
Age (yr) ≤60
>60
257 181
83.4 81.4
169.0±6.3 125.8±6.5
0.139 310
229
51 38.7
100.3±5.3 59.5±4.2
< 0.0001
Gender Male
Female
281 157
81.8 84.2
139.9±5.8 169.9±7.8
0.304 360
179
46.4 45.3
85.4±5.1 92.1±7.0
0.592
T S (-)
PM SS
S (+) SE SI
188 250
87 78.6
159.8±6.6 155.2±7.3
0.038 494
45
47.5 28.9
92.5±4.4 45.5±7.7
< 0.0001
N* N0
N1 N2 N3
165 186 63 24
91.8 83.2 70.4 42.6
185.9±6.7 149.4±7.6 104.5±8.6 57.3±9.0
<0.0001 61 168 150 160
70.3 59.3 43.9 24.9
110.2±8.8 111.0±7.8 86.3±7.8 55.3±6.0
< 0.0001
TOS STG
TG
336 102
84 78.1
155.9±5.2 144.7±10.6
0.046 310
229
51.3 38.7
94.2±5.8 77.8±5.8
0.004
LI Negative
positive
124 314
86.7 80.8
168.7±9.4 149.6±5.7
0.251 50
489
58.2 44.7
100.6±12.4 87.4±4.4
0.132
VI Negative
Positive
400 38
84.2 64.7
167.2±5.5 81.1±9.9
0.001 422
117
49.1 34.8
95.7±4.8 62.5±8.0
< 0.0001
PI Negative
Positive
308 130
83.5 79.9
166.9±5.7 86.8±3.8
0.159 381
158
45 49.4
86.3±4.6 81.0±6.4
0.243
Tumor site Lower 1/3 Middle 1/3 Upper 1/3 WS
216 169 52 1
84.4 79.3 87.4 0
149.1±5.7 146.5±7.5 165.1±14.5
22.0±0
0.02 264
185 70 20
44.4 54.4 38.9 15
87.6±6.1 96.8±6.9 68.2±8.1 45.1±14.3
0.004
Tumor size (cm) ≤6
>6
312 126
86.6 72.8
172.9±6.0 129.8±8.8
<0.0001 261 278
54.2 38.3
104.9±6.4 73.3±5.1
< 0.0001
Differentiation DIF UND
177 261
86.3 80.1
152.6±8.0 161.5±6.7
0.282 162
377
45.4 46.2
82.5±7.4 90.7±5.0
0.671
AGC = advanced gastric cancer; No. = number of patients; 5-ysr = 5-year survival rate; SD = standard deviation; T = depth of invasion; S (-) = serosa-negative; S (+) = serosa-positive; PM = proper muscle; SE = serosa exposure; SS = subserosa; SI = adjacent organ invasion; N = nodal
4. The relationship between tumor size and prog
nosis in advanced gastric cancer with serosa invasion
Statistical significance was observed in age, depth of invasion, nodal status, type of surgery, venous invasion, tumor sites, as well as, tumor size, according to the univariate analysis on the prognosis related survival of T4a or T4b group with serosal invasion in AGC (Table 5) (Fig. 1).
5. Survival in advanced gastric cancer multivariate analysis
According to the multivariate analysis on survival of all patients with AGC, statistically significant factors were age, nodal status, serosal invasion, venous invasion, and tumor size. The degree of lymph node metastasis, along with tumor size (P=0.011, hazard ratio (HR)=1.810, 95% confidence interval (CI)=1.149~2.852), were independent prognostic factors in AGC without serosal inva- sion. Age, nodal status, and tumor size (P=0.033, HR=1.288, 95%
CI=1.020~1.627) were independent prognostic factors in AGC with serosal invasion, according to the multivariate analysis on survival (Table 6).
Discussion
Tumor size can be determined quite easily in the preoperative exam and the accuracy of information is fairly reliable. In recent years, tumor size has been continuously pointed out as one of the critical factors determining the prognosis in gastric cancer. Hence, the necessity of study has lately been underscored as a crucial issue.
Establishing the standard of tumor size is a considerably critical issue in categorizing gastric cancers based on the tumor size. Pre- vious studies classified tumors based on their own standards. When Adachi et al.(11) categorized patients’ tumor sizes by 2 cm, rela- tively significant survival rate was observed between tumors with 4 cm and 10 cm in size. Subsequently, they categorized patients into 3 groups; with tumors less than 4 cm, in between 4 cm to 10 cm, and larger than 10 cm. Giuliani et al.(12) classified patients into three groups with sizes less than 26 mm, in between 26~50 mm, and more than 50 mm, based on the survival rate. Li et al.(13) took 10 cm or above as the standard by setting the standard at 90% de- pending on patient distribution. Saito et al.(14) took the most statis- tically significant result as the standard in terms of disease-specific survival when they set the standard as 8 cm in the study using the
Fig. 1. Survival rate according to tumor size showed significant dif- ference in all cases of advanced gastric cancer (AGC) (P<0.0001), se- rosa-negative AGC (P<0.0001), and serosa-positive AGC (P<0.0001), respectively.
Cox proportional hazard model to find the critical point. Liu et al.(15) took 6 cm as the standard by calculating the mean of the tu- mor sizes in the study on the tumor size of T3 gastric cancer. This study calculated the median by classifying gastric cancers into EGC and AGC with tumor sizes of 3 cm and 6 cm, respectively. Using medians are thought to be valid to exclude statistic errors in tumor size and establish objective standards. However, this issue needs to be further discussed since there is no definite basis regarding the tumor size.
The significance of tumor size can be viewed from two as- pects. First, the frequency of endoscopic and laparoscopic surgery has lately been surged in case of EGC. However, its indication has not yet been established. Independent factors are the tumor size, lymphatic invasion and submucosal invasion according to the
Maehara et al.(16) asserted that tumor size is a reliable predictor in examining the tumor behavior in EGC. On the other hand, Tsu- jitani et al.(17) did not consider the tumor size as an independent prognostic factor. They reported that tumor size and macroscopic appearance are the most reliable factors in determining the indica- tion of endoscopic mucosal resection since the predictability of preoperative depth of tumor invasion is inaccurate and determining nodal status is unreliable. In case of EGC, the tumor size does not belong to an independent prognostic factor in this study. Second, the tumor size is a crucial factor in the evaluation of the prognosis.
A previous study reported that tumor size is more significant prog- nostic factor than depth of invasion in gastric cancers without se- rosal invasion and lymph node metastasis.(18) However, the tumor size does not fall under one of the factors determining the different Table 6. Multivariate survival analysis in advanced gastric cancer
Variables B SE P-value HR 95% CI
All AGC Age (yr) ≤60
>60 0.401 0.103 <0.0001 1.494 1.221~1.828
Serosa Negative
Positive 0.822 0.133 <0.0001 2.276 1.754~2.954
Nodal status (7th AJCC) N0 N1 N2 N3
0.290 0.611 1.135
0.178 0.185 0.188
0.104 0.001
<0.0001
1.336 1.843 3.111
0.942~1.894 1.282~2.650 2.152~4.499 Venous invasion Negative
Positive 0.313 0.123 0.011 1.368 1.075~1.740
Tumor size (cm) ≤6
>6 0.316 0.106 0.003 1.372 1.115~1.690
Serosa-negative AGC Nodal status (7th AJCC) N0 N1 N2 N3
0.582 0.970 1.535
0.290 0.336 0.412
0.045 0.004
<0.0001
1.789 2.638 4.640
1.013~3.159 1.366~5.096 2.069~10.406
Tumor size (cm) ≤6
>6 0.593 0.232 0.011 1.810 1.149~2.852
Serosa-positive AGC Age (yr) ≤60
>60 0.420 0.117 <0.0001 1.522 1.211~1.914
Nodal status (7th AJCC) N0 N1 N2 N3
0.036 0.334 0.873
0.223 0.222 0.219
0.872 0.132
<0.0001
1.037 1.396 2.394
0.669~1.606 0.904~2.155 1.558~3.680
Tumor size (cm) ≤6
>6 0.253 0.119 0.033 1.288 1.020~1.627
B = the coefficient for the constant; SE = standard error; HR = hazard ratio; CI = confidence interval; AGC = advanced gastric cancer; AJCC = American Joint Committee on Cancer.
and prognosis depending on the tumor size are essential by analyz- ing the characteristics of gastric cancer, based on detailed clinico- pathologic classifications. This study analyzed the relationship be- tween tumor size and prognosis in all patients with AGC. Although a poor prognosis was assessed in case of large tumors, this study reclassified and reanalyzed AGC, according to the depth of tumor invasion, one of the main factors determining the prognosis of gastric cancer. A statistically significant difference (P<0.0001) was shown in the prognosis depending on the depth of tumor invasion of AGC (T2, T3, T4a, T4b). A meaningful difference was observed in the survival rate (P<0.0001) (Table 4), when each survival rate was examined by classifying AGC, according to serosal invasion (T2, T3 vs. T4a, T4b). This study further investigated on the relationship between the tumor size and prognosis by a depth of tumor invasion in AGC. Moreover, this study analyzed the prognostic significance of tumor size in each group by dividing AGC into 2 groups, based on the presence of serosal invasion by considering an adequate number of the cases. As a result, the tumor size was an indepen- dent factor affecting in the prognosis of both groups, regardless of differences in the depth of tumor invasion.
The clinical characteristics of tumor size have not yet been ad- equately clarified in terms of large gastric cancers. However, large tumor size is profoundly associated with Borrmann type IV, adja- cent organ invasion (T4) and higher lymph node and distant me- tastasis rate.(21,22) For this reason, most patients have stage III or stage IV cancers, low possibility of radical resection in many cases, and lower 5-year survival rate.(23) Likewise, clinico-pathologic characteristics vary depending on the tumor size, and distinct dif- ferences are present in the survival rate. Therefore, utilizing a stan- dardized tumor size could be substantially meaningful in arranging the treatment during the postoperative follow-up period by analyz- ing the evaluation factors of prognosis of cancers.
Adachi et al.(11) categorized patients into 3 groups- with tu- mors less than 4 cm, in between 4 cm to 10 cm, and larger than 10 cm in size- and compared the 10-year survival rate of the 3 groups. The survival rates were 92%, 66%, and 33%, respectively, exhibiting the statistically significant difference. The tumor size was an independent prognostic factor along with T and N according to multivariate analysis. Therefore, they reported that tumor size is a simple predictor in the progress of tumor and survival of patients.
Saito et al.(14) compared the 5-year survival rate in 2 groups with tumors less than 8 cm and more than 8 cm in size. The survival rates were 89.7% and 54%, respectively, showing a statistically significant difference. Moreover, they reported that tumor size is
an independent prognostic factor along with T and N factors and lymphatic invasion, according to the multivariate analysis. Jun et al.(24) compared the 5-year survival rates of 2 groups with tumors below and above 3.5 cm. The survival rates were 86.8% and 62%, respectively, showing a statistically significant difference. In addi- tion, the tumor size was reported to be an independent prognostic factor through multivariate analysis. Liu et al.(15) also reported that the tumor size is an independent prognostic factor by taking 6 cm, the standard in the multivariate analysis. A significant difference was found in the prognosis depending on the tumor size, especially in stages IIIb and IV.
In this study, no difference was present in the survival rates by using the median value of 3 cm for the tumor size as the stan- dard in case of EGC. However, when the median value of 6 cm in AGC was used as the standard, significant differences of 71.0%
and 48.5% (P<0.0001) were observed, respectively. Moreover, the 5-year survival rates were 86.6% vs. 72.8% (P<0.0001) and 54.2%
vs. 38.3% (P<0.0001) in serosa negative group and positive group, respectively, exhibiting a statistically significant difference in both groups. Tumor size was an independent prognostic factor in AGC, along with the patient’s age, depth of tumor invasion, nodal status, and venous invasion. Therefore, the tumor size is thought to be a simple but significant factor in the evaluation of the prognosis.
To investigate the effect of tumor size on the prognosis of gas- tric cancer patients, this study examined 1,697 patients who under- went curative surgery. The study defined tumors less than 3 cm as small tumors, and those that are more than 3 cm as large tumors, in 720 EGC patients. Meanwhile, tumors less than 6 cm in size were set as small tumors, while more than 6 cm as large tumors, in 977 AGC patients. The study has acquired the following results.
Tumor size was an independent prognostic factor in AGC, un- like in EGC. Independent prognostic factors in EGC were age and histologic type. A statistically significant difference was observed in the survival rate, based on tumor size in AGC. Tumor size in AGC was an independent prognostic factor. Furthermore, it was an inde- pendent prognostic factor in the result of analysis carried out based on the presence of serosal invasion.
References
1. Cheung LY, Delcore R. Gastric cancer. In: Townsend CM, ed. Sabiston Textbook of Surgery. 16th ed. Philadelphia: W.B.
Saunders; 2001:855-865.
2. Jemal A, Tiwari RC, Murray T, Ghafoor A, Samuels A, Ward
E, et al; American Cancer Society. Cancer statistics, 2004. CA Cancer J Clin 2004;54:8-29.
3. Kim W, Park CH, Park SM, Park WB, Lim KW, Kim SN.
Prognostic significance of lymphatic and perineural invasions in patients with gastric cancer who have no lymph node and serosal involvement. J Korean Gastric Cancer Assoc 2001;1:77- 82.
4. Huh H, Hyung WJ, Chen J, Choi SH, Noh SH. Implication of lymphatic or blood vessel invasion in early gastric cancer. J Korean Surg Soc 2003;64:134-139.
5. Kim JJ, Song KY, Hur H, Hur JI, Park SM, Park CH. Lymph node micrometastasis in node negative early gastric cancer.
Eur J Surg Oncol 2009;35:409-414.
6. Suh KW, Kim CB, Kim MW, Chi HS, Cho CH, Kim BR, et al. A clinical study of 2789 gastric cancers. J Korean Surg Soc 1991;41:148-158.
7. Park CH, Kim DG, Jung SS, Yoo SJ, Lee MD, Kim SK, et al.
Clinical analysis of gastric adenocarcinoma experienced dur- ing recent 10 years and follow up results. J Korean Surg Soc 1992;42:787-798.
8. Nakamura K, Ueyama T, Yao T, Xuan ZX, Ambe K, Adachi Y, et al. Pathology and prognosis of gastric carcinoma. Findings in 10,000 patients who underwent primary gastrectomy. Can- cer 1992;70:1030-1037.
9. Sobin LH, Wittekind C, eds. International Union against Can- cer. TNM Classification of Malignant Tumours. 5th ed. New York: Wiley-Liss, 1997.
10. Washington K. 7th edition of the AJCC cancer staging manual:
stomach. Ann Surg Oncol 2010;17:3077-3079.
11. Adachi Y, Oshiro T, Mori M, Maehara Y, Sugimachi K. Tumor size as a simple prognostic indicator for gastric carcinoma.
Ann Surg Oncol 1997;4:137-140.
12. Giuliani A, Caporale A, Di Bari M, Demoro M, Gozzo P, Co- rona M, et al. Maximum gastric cancer diameter as a prognos- tic indicator: univariate and multivariate analysis. J Exp Clin Cancer Res 2003;22:531-538.
13. Li C, Oh SJ, Kim S, Hyung WJ, Yan M, Zhu ZG, et al. Risk fac- tors of survival and surgical treatment for advanced gastric
cancer with large tumor size. J Gastrointest Surg 2009;13:881- 885.
14. Saito H, Osaki T, Murakami D, Sakamoto T, Kanaji S, Oro S, et al. Macroscopic tumor size as a simple prognostic indicator in patients with gastric cancer. Am J Surg 2006;192:296-300.
15. Liu X, Xu Y, Long Z, Zhu H, Wang Y. Prognostic significance of tumor size in T3 gastric cancer. Ann Surg Oncol 2009;16:1875- 1882.
16. Maehara Y, Orita H, Okuyama T, Moriguchi S, Tsujitani S, Korenaga D, et al. Predictors of lymph node metastasis in early gastric cancer. Br J Surg 1992;79:245-247.
17. Tsujitani S, Oka S, Saito H, Kondo A, Ikeguchi M, Maeta M, et al. Less invasive surgery for early gastric cancer based on the low probability of lymph node metastasis. Surgery 1999;125:148-154.
18. Yamamura Y, Nakajima T, Ohta K, Nashimoto A, Arai K, Hiratsuka M, et al. Determining prognostic factors for gas- tric cancer using the regression tree method. Gastric Cancer 2002;5:201-207.
19. Maruyama K, Okabayashi K, Kinoshita T. Progress in gastric cancer surgery in Japan and its limits of radicality. World J Surg 1987;11:418-425.
20. Roviello F, Marrelli D, de Manzoni G, Morgagni P, Di Leo A, Saragoni L, et al; Italian Research Group for Gastric Cancer.
Prospective study of peritoneal recurrence after curative sur- gery for gastric cancer. Br J Surg 2003;90:1113-1119.
21. Yokota T, Ishiyama S, Saito T, Teshima S, Yamada Y, Iwamoto K, et al. Is tumor size a prognostic indicator for gastric carci- noma? Anticancer Res 2002;22:3673-3677.
22. Shiraishi N, Sato K, Yasuda K, Inomata M, Kitano S. Multi- variate prognostic study on large gastric cancer. J Surg Oncol 2007;96:14-18.
23. Yasuda K, Shiraishi N, Adachi Y, Inomata M, Sato K, Kitano S.
Risk factors for complications following resection of large gas- tric cancer. Br J Surg 2001;88:873-877.
24. Jun KH, Jung H, Baek JM, Chin HM, Park WB. Does tumor size have an impact on gastric cancer? A single institute experi- ence. Langenbecks Arch Surg 2009;394:631-635.