Corresponding author: Hyun Yoon
Department of Clinical Laboratory Science, Wonkwang Health Science University, 514 Iksan-daero, Iksan 54538, Korea
E-mail: [email protected]
ORCID: https://orcid.org/0000-0002-4741-9664
ORIGINAL ARTICLE
Relationship between Metabolic Syndrome, Metabolic Syndrome Score, Insulin Resistance and Beta Cell Function in Korean Adults with Obesity
Hyun Yoon
Department of Clinical Laboratory Science, Wonkwang Health Science University, Iksan, Korea
대한민국 비만 성인에서 대사증후군과 인슐린저항성 및 베타세포기능의 관련성
윤 현
원광보건대학교 임상병리과
ARTICLE INFO ABSTRACT
Received October 21, 2020 Revised 1st October 31, 2020 Revised 2nd November 4, 2020 Accepted November 4, 2020
The present study was conducted to assess the relationship between metabolic syndrome, metabolic syndrome score, homeostasis model assessment of insulin resistance (HOMA-IR), and beta-cell function (HOMA-B) in obese Korean adults. The study included 1,860 adults aged 20 years or older from the 2010 Korean National Health and Nutrition Examination Survey (KNHANES) data.
Metabolic syndrome and metabolic syndrome score (MSS) were positively associated with HOMA-IR (both P<0.001). HOMA-B levels of elevated blood pressure (P<0.001) and elevated fasting blood glucose group (P<0.001) were significantly lower than the normal group. However, the HOMA-B levels of abdominal obesity (P=0.003) and reduced high-density lipoprotein cholesterol group (P=0.030) were significantly higher than the normal group. Nevertheless, metabolic syndrome (P<0.001) and MSS (P<0.001) were inversely associated with the HOMA-B levels. In conclusion, metabolic syndrome and MSS were positively associated with insulin resistance and inversely associated with beta-cell function in Korean adults with obesity.
Copyright Ⓒ 2020 The Korean Society for Clinical Laboratory Science. All rights reserved.
Key words Beta cell function Insulin resistance Metabolic syndrome Metabolic syndrome score Obesity
INTRODUCTION
Obesity is one of the most important public health problems due to its association with many diseases, including type 2 diabetes mellitus, hypertension, dyslipidemia, and metabolic syndrome [1-4]. Metabolic syndrome is characterized by insulin resistance (IR), as
studies have mainly noted IR in subjects with individual metabolic syndrome components, such as abdominal obesity, hypertension, and dyslipidemia [5-7]. The populations with obesity maintain normal glucose level since a preserved ability to secrete insulin [8]. However, if IR increases, the ability to secrete insulin decreases, as IR is one of the factors in the de-differentiation and death of beta cells [9, 10].
Recently, research on metabolic syndrome and IR is currently being conducted all over the world. However, there are few studies on the relationship between beta
Korean Society for Clinical Laboratory Science
cell function and metabolic syndrome in Korea, and research findings on the association between beta cell function and metabolic syndrome components were not consistent according to countries and ethnic groups, healthy subjects and subjects with chronic disease (e.g., obesity, diabetes) [11-15]. The prevalence of metabolic syndrome and obesity in the Republic of Korea has been increasing due to the Westernized diet [16]. Therefore, the present study aimed to investigate the relationship between metabolic syndrome and the increased levels of its components and the HOMA-B levels in adults with obesity using the Korean National Health and Nutrition Examination Survey (KNHANES V-1, 2010) data.
MATERIALS AND METHODS
1. Study subjects
This study was based on data from the fifth KNHANES (2010), which is the most recent data that measured insulin among the KNHANES. The KNHANES is a cross-sectional survey conducted nationwide by the Division of Korean National Health and Welfare. The fifth KNHANES (2010) was performed from January 2010 to December 2010. In the fifth KNHANES (2010), 8,958 individuals over 1 year of age were sampled for the survey. Among the 6,665 subjects who participated in the fifth KNHANES (2010), we limited the analyses to adults aged over 20 years. We excluded 4,805 subjects who were in no-obesity group (3,941 subjects, body mass index [BMI] <25.0 kg/m
2) or for whom data were missing for an important analytic variables, such as the insulin, fasting blood glucose (FBG), and various blood chemistry tests (864 subjects). Finally, 1,860 subjects were included in the statistical analysis. The KNHANES study was approved by the Institutional Review Board of the Centers for Disease Control and Prevention in Korea (IRB No, 2010-02CON-21-C). All participants in the survey signed an informed written consent form.
2. General characteristics and blood chemistry
Anthropometric measurements included height, weight, waist circumference (WC), and BMI as well as final measurements of diastolic blood pressure (DBP) and systolic blood pressure (SBP). Blood chemistry included measurement of total cholesterol (TC), triglycerides (TGs), high-density lipoprotein cholesterol (HDL-C), FBG, and 25-hydroxyvitamin D [25(OH)D].
3. HOMA-IR and HOMA-B and obesity
The HOMA-B and HOMA-IR constitute a method for assessing beta cell function and IR from basal insulin concentrations and glucose [17]. HOMA-B and HOMA-IR are also significantly associated with diabetes risk across ethnic groups [18]. The formulas are as follows:
HOMA-B=20×fasting insulin (μU/mL)/[FBG (mg/dL)−
63]; HOMA-IR=[fasting insulin (μU/mL)×FBG (mg/dL)]/
405 [17]. Obese population was defined as BMI ≥25.0 kg/m
2[19].
4. Metabolic syndrome and metabolic syndrome score Metabolic syndrome was defined using the diagnostic criteria of the revised National Cholesterol Education Program Adult Treatment Panel III [20], including TGs, HDL-C, BP, FBG, and WC. TGs over 150 mg/dL for dyslipidemia were set as the criteria for elevated TGs.
The criteria for reduced HDL-C were HDL-C of less than 50 mg/dL and 40 mg/dL for females and males, respectively. FBG over 100 mg/dL were set as the criteria for elevated FBG. DBP over 85 mmHg or SBP over 130 mmHg were set as the criteria for elevated BP.
The criteria for abdominal obesity were WC of over 80 cm and 90 cm for females and males, respectively [21].
The presence of defined abnormalities in any three of
these five measures constitutes a diagnosis of metabolic
syndrome. The metabolic syndrome (MSS) indicates the
presence of elevated FBG, elevated TGs, and reduced
HDL-C, abdominal obesity, and elevated BP. Subjects
without any of the five risk factors received an MSS of 0,
while those with one, two, three, or four or more of the
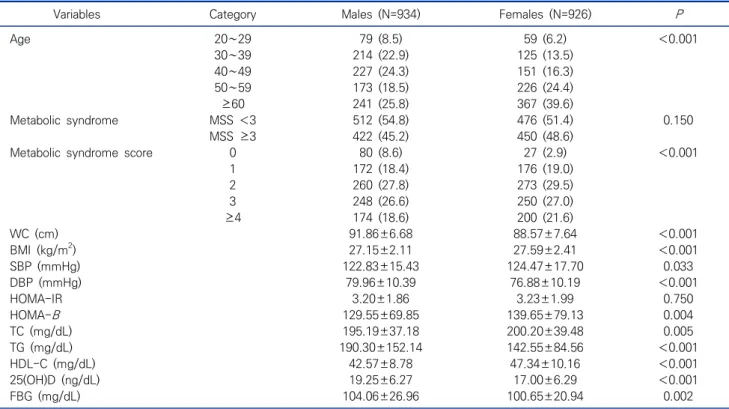
Table 1. General characteristics of research subjects N (%), Mean±SD (N=1,860)
Variables Category Males (N=934) Females (N=926) P
Age 20∼29 79 (8.5) 59 (6.2) <0.001
30∼39 214 (22.9) 125 (13.5)
40∼49 227 (24.3) 151 (16.3)
50∼59 173 (18.5) 226 (24.4)
≥60 241 (25.8) 367 (39.6)
Metabolic syndrome MSS <3 512 (54.8) 476 (51.4) 0.150
MSS ≥3 422 (45.2) 450 (48.6)
Metabolic syndrome score 0 80 (8.6) 27 (2.9) <0.001
1 172 (18.4) 176 (19.0)
2 260 (27.8) 273 (29.5)
3 248 (26.6) 250 (27.0)
≥4 174 (18.6) 200 (21.6)
WC (cm) 91.86±6.68 88.57±7.64 <0.001
BMI (kg/m2) 27.15±2.11 27.59±2.41 <0.001
SBP (mmHg) 122.83±15.43 124.47±17.70 0.033
DBP (mmHg) 79.96±10.39 76.88±10.19 <0.001
HOMA-IR 3.20±1.86 3.23±1.99 0.750
HOMA-B 129.55±69.85 139.65±79.13 0.004
TC (mg/dL) 195.19±37.18 200.20±39.48 0.005
TG (mg/dL) 190.30±152.14 142.55±84.56 <0.001
HDL-C (mg/dL) 42.57±8.78 47.34±10.16 <0.001
25(OH)D (ng/dL) 19.25±6.27 17.00±6.29 <0.001
FBG (mg/dL) 104.06±26.96 100.65±20.94 0.002
Abbreviations: WC, waist circumference; BMI, body mass index; SBP, systolic blood pressure; DBP, diastolic blood pressure; HOMA-IR, homeostasis model assessment of insulin resistance; HOMA-B, homeostasis model assessment of beta-cell function; TC, total cholesterol;
TGs, triglycerides; HDL-C, high density lipoprotein cholesterol; LDL-C, LDL-cholesterol; 25(OH)D, 25-hydroxyvitamin D; FBG, fasting blood glucose.
risk factors received an MSS of 1, 2, 3, and ≥4, respectively [22].
5. Data analysis
The collected data were statistically analyzed using SPSS statistics 20 (SPSS Inc., Chicago, IL, USA). The distributions of the subjects characteristics were converted into percentages (%), and the successive data were presented as averages with standard deviations (M±SD). Clinical characteristics grouped by men or women were analyzed using chi-square and an independent t-test. The average difference in the HOMA-IR and HOMA-B levels for the clinical elements of metabolic syndrome were calculated using an independent t-test. The average difference in the HOMA-IR and HOMA-B levels for metabolic syndrome and MSS were calculated using an analysis of variance (ANOVA) and an analysis of covariance (ANCOVA). The significance level for all of the statistical tests was set as
P<0.05.
RESULTS
1. Clinical characteristics of research subjects
The clinical characteristics of the research participants are shown in Table 1. In the males, the HOMA-IR and HOMA-B levels of participants were 3.20±1.86 and 129.55±69.85, respectively. According to the classification of the MSS guidelines, 80 (8.6%), 172 (18.4%), 260 (27.8%), 248 (26.6%), and 174 (18.6%) participants were classified as MSS 0, MSS 1, MSS 2, MSS 3, and MSS ≥4, respectively, while the prevalence rate of metabolic syndrome was 422 of the 934 patients (45.2%). In the females, the HOMA-IR and HOMA-B levels of subjects were 3.23±1.99 and 139.65±79.13, respectively.
According to the classification of the MSS guidelines, 27
(2.9%), 176 (19.0%), 273 (29.5%), 250 (27.0%), and 200
(21.6%) participants were classified as MSS 0, MSS 1,
Table 3. Comparisons of the HOMA-IR levels according to metabolic syndrome and metabolic syndrome scores in obesity subjects (N=1,860) HOMA-IR (M±SD)
non-adjusted (95%, CI) P HOMA-IR (M±SE)
adjusted* (95%, CI) P
MSS 0 2.14±0.81 (1.99∼2.30) <0.001 2.41±0.17 (2.06∼2.75) <0.001
1 2.40±0.95 (2.30∼2.50) 2.55±0.01 (2.36∼2.74)
2 3.00±1.81 (2.85∼3.15) 2.99±0.08 (2.84∼3.14)
3 3.48±1.80 (3.32∼3.64) 3.41±0.08 (3.26∼3.57)
≥4 4.24±2.53 (3.98∼4.49) 4.12±0.09 (3.93∼4.29)
Non-mets 2.69±1.50 (2.61∼2.79) <0.001 2.65±0.07 (2.51∼2.79) <0.001
Mets 3.80±2.17 (3.66∼3.94) 3.76±0.06 (3.64∼3.88)
Abbreviations: MSS, metabolic syndrome score; Non-Mets, non-metabolic syndrome; Mets, metabolic syndrome.
*Adjusted for age, gender, BMI, TC, and 25(OH)D.
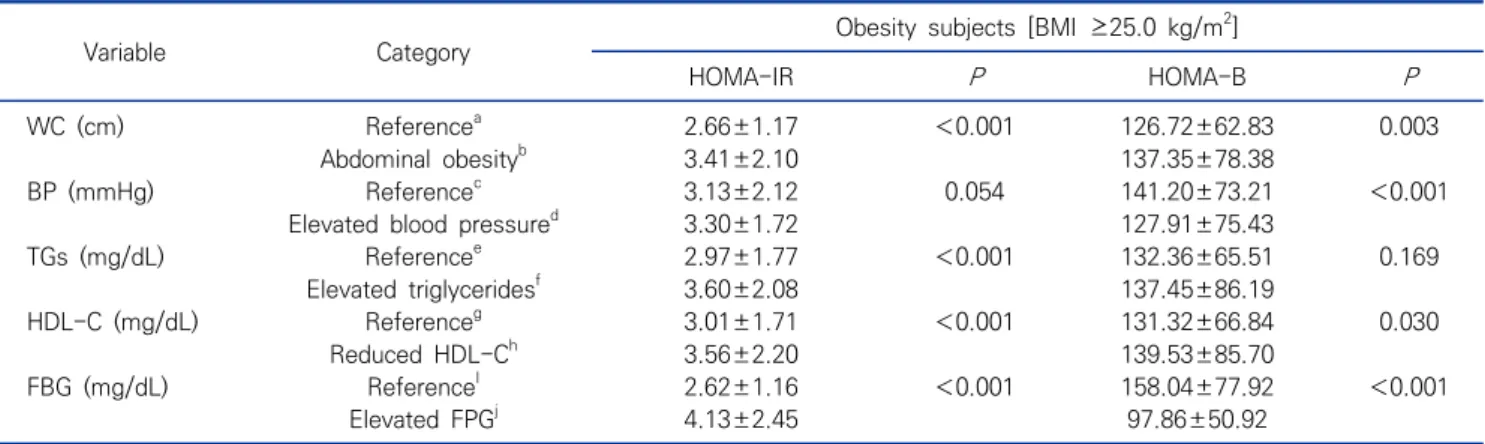
Table 2. Comparisons of the HOMA-IR and HOMA-B levels according to metabolic syndrome characteristics in obesity subjects Mean±SD (N=1,860)
Variable Category Obesity subjects [BMI ≥25.0 kg/m2]
HOMA-IR P HOMA-B P
WC (cm) Referencea 2.66±1.17 <0.001 126.72±62.83 0.003
Abdominal obesityb 3.41±2.10 137.35±78.38
BP (mmHg) Referencec 3.13±2.12 0.054 141.20±73.21 <0.001
Elevated blood pressured 3.30±1.72 127.91±75.43
TGs (mg/dL) Referencee 2.97±1.77 <0.001 132.36±65.51 0.169
Elevated triglyceridesf 3.60±2.08 137.45±86.19
HDL-C (mg/dL) Referenceg 3.01±1.71 <0.001 131.32±66.84 0.030
Reduced HDL-Ch 3.56±2.20 139.53±85.70
FBG (mg/dL) ReferenceI 2.62±1.16 <0.001 158.04±77.92 <0.001
Elevated FPGj 4.13±2.45 97.86±50.92
Abbreviations: aReference is defined as WC <90 cm in males or <80 cm in females, bAbdominal obesity is defined as WC >90 cm in males or >80 cm in females, cReference is defined as SBP <130 mmHg or DBP <85 mmHg, dElevated blood pressure is defined as SBP >130 mmHg or DBP >85 mmHg, eReference is defined as TGs <150 mg/dL, fElevated triglycerides is defined as TGs >150 mg/dL,
gReference is defined as HDL-C >40 mg/dL in males or >50 mg/dL in females, hReduced HDL-C is defined as HDL-C <40 mg/dL in males or <50 mg/dL in females, iReference is defined as FBG <100 mg/dL, jElevated FBG is defined as FBG >100 mg/dL.
MSS 2, MSS 3, and MSS ≥4, respectively, while the prevalence rate of metabolic syndrome was 450 of the 926 patients (48.6%).
2. Comparisons of the HOMA-IR and HOMA-B according to metabolic syndrome characteristics in subjects with obesity
Comparisons of the HOMA-IR and HOMA-B levels according to metabolic syndrome characteristics are shown in Table 2. In terms of components of metabolic syndrome, the HOMA-IR were significantly higher (P<
0.001) than the normal groups in all metabolic syndrome components [except elevated BP (P=0.054)]. The HOMA-B levels were significantly lower in the elevated BP (P<
0.001) and elevated FBG group (P<0.001) than in the normal groups. However, the HOMA-B were significantly higher in the abdominal obesity (P=0.003) and reduced HDL-C group (P=0.030) than the normal group.
3. Comparisons of the HOMA-IR and HOMA-B according to metabolic syndrome and MSS in subjects with obesity
Comparisons of the HOMA-IR and HOMA-B levels according to metabolic syndrome and MSS in subjects with obesity are shown in Tables 3, 4. In terms of the HOMA-IR by MSS values after adjusting for age, gender, BMI, TC, and 25(OH)D, the HOMA-IR [M±SE, 95%
confidence interval (CI)] were 2.41±0.17 (95% CI, 2.06∼
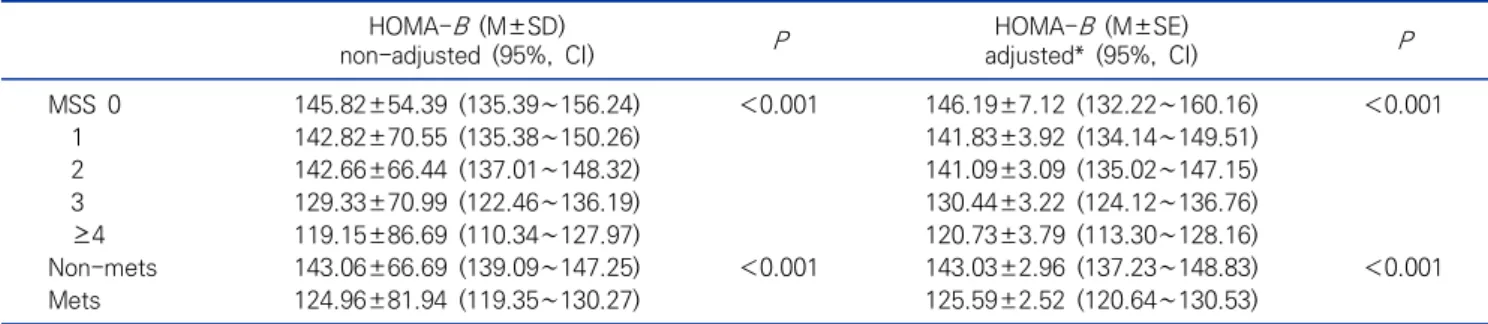
Table 4. Comparisons of the HOMA-B levels according to metabolic syndrome and metabolic syndrome scores in obesity subjects (N=1,860) HOMA-B (M±SD)
non-adjusted (95%, CI) P HOMA-B (M±SE)
adjusted* (95%, CI) P
MSS 0 145.82±54.39 (135.39∼156.24) <0.001 146.19±7.12 (132.22∼160.16) <0.001
1 142.82±70.55 (135.38∼150.26) 141.83±3.92 (134.14∼149.51)
2 142.66±66.44 (137.01∼148.32) 141.09±3.09 (135.02∼147.15)
3 129.33±70.99 (122.46∼136.19) 130.44±3.22 (124.12∼136.76)
≥4 119.15±86.69 (110.34∼127.97) 120.73±3.79 (113.30∼128.16)
Non-mets 143.06±66.69 (139.09∼147.25) <0.001 143.03±2.96 (137.23∼148.83) <0.001
Mets 124.96±81.94 (119.35∼130.27) 125.59±2.52 (120.64∼130.53)
Abbreviation: See Table 3.
*Adjusted for age, gender, BMI, TC, and 25(OH)D.
2.75) for MSS 0, 2.55±0.01 (95% CI, 2.36∼2.74) for MSS 1, 2.99±0.08 (95% CI, 2.84∼3.14) for MSS 2, 3.41±0.08 (3.26∼3.57) for MSS 3, and 4.12±0.09 (95% CI, 3.93∼
4.29) for MSS ≥ 4. The HOMA-IR increased as increases of metabolic syndrome components (P<0.001). In addition, the HOMA-IR of metabolic syndrome group [3.76±0.06 (95% CI, 3.64∼3.88)] was significantly higher (P<0.001) than the non-metabolic syndrome group [2.65±0.07 (95% CI, 2.51∼2.79)]. In terms of the HOMA-B by MSS values after adjusting for age, gender, BMI, TC, and 25(OH)D, the HOMA-B [M±SE (95% CI)]
were 146.19±7.12 (95% CI, 132.22-160.16) for MSS 0, 141.83±3.92 (95% CI, 134.14∼149.51) for MSS 1, 141.09±3.09 (95% CI, 135.02∼147.15) for MSS 2, 130.44±3.22 (95% CI, 124.12∼136.76) for MSS 3, and 120.73±3.79 (95% CI, 113.30∼128.16) for MSS ≥4. The HOMA-B decreased as increases of metabolic syndrome components (P<0.001). In addition, the HOMA-B of metabolic syndrome group [125.59±2.52 (120.64∼
130.53)] was significantly lower (P<0.001) than the non-metabolic syndrome group [143.03±2.96 (95% CI, 137.23∼148.83)].
DISCUSSION
The present study investigated the association between metabolic syndrome and its components and HOMA-B levels using data from the KNHANES V-I. Although individually, its components may not be associated with the HOMA-IR and HOMA-B levels, metabolic
syndrome and MSS were positively associated with the HOMA-IR levels and inversely associated with the HOMA-B levels (Tables 3, 4).
Many previous studies have shown that IR is associated
with metabolic syndrome and its components. Yin et al
[23] reported that all of the metabolic syndrome
components were associated with the HOMA-IR of
Chinese children and teenagers (P<0.001). Ying et al
[24] reported that all of the metabolic syndrome
components were associated with the HOMA-IR in
young Chinese men (P< 0.001). In addition, Yamada et
al [25] reported that all of the metabolic syndrome
components were associated with the HOMA-IR in
Japanese adults (P<0.001). In populations with obesity,
the association between metabolic syndrome com-
ponents and the HOMA-IR vary across the ethnic
groups and countries. Gobato et al [26] evaluated the
association between the HOMA-IR and metabolic
syndrome in adolescent with obesity. SBP (P =0.352),
DBP (P =0.182), and TGs (P =0.051) are not significantly
associated with insulin resistance. On the other hand,
Margoth et al [27] evaluated the association between IR
and metabolic syndrome in Bolivian children and
adolescents with obesity. High TGs (P=0.0025) and high
blood pressure (P= 0.0148) are significantly associated
with insulin resistance. In the present study, abdominal
obesity (P<0.001), reduced HDL-C (P<0.001), elevated
FBG (P<0.001), and elevated TGs (P<0.001) are
significantly associated with the HOMA-IR levels, but
the elevated BP (P=0.054) was not significantly
associated with the HOMA-IR, and metabolic syndrome and increases of its components were positively associated with IR.
Studies on the association between beta cell function and metabolic syndrome components are not so much, and previous results were not consistent according to healthy subjects and subjects with disease, country and ethnicity [13, 28, 29]. Imamura et al [28] conducted the association between the risk factors of type 2 diabetes mellitus (T2DM) and IR and beta cell function in the Cardiovascular Health Study and they suggested that HOMA-B was positively associated with the elevated TGs and FBG, but was not associated with the elevated BP and reduced HDL-C. Garg et al [29] evaluated the association between beta cell function and metabolic syndrome in the USA adults and they suggested that beta cell function was positively associated with fasting plasma glucose and waist hip ratio, but was not associated with hypertension, TGs and HDL-C. On the other hand, Haffner et al [13] reported that all of the metabolic syndrome components were not associated with beta cell function in Mexican Americans and non-Hispanic Whites. In the present study, the HOMA- B levels were significantly lower in the elevated BP (P<
0.001) and elevated FBG groups (P<0.001) than the normal group, but they were not associated with the elevated TGs group (P=0.169). Whereas, the HOMA-B levels of the abdominal obesity (P=0.003) and reduced HDL-C groups (P=0.030) were significantly higher than those of the normal group. However, if the metabolic syndrome components occur simultaneously, they decrease the HOMA-B levels. Currently, research on the association between beta cell function and the meta- bolic syndrome components is lacking. Baez-Duarte et al [11] reported that the progressive deterioration of insulin sensitivity and beta cell function in subjects with metabolic syndrome as the number of features of metabolic syndrome increases in Mexican subjects.
Cubeddu and Hoffmann [12] reported that beta cell function and insulin sensitivity were inversely asso- ciated with a number of metabolic syndrome components
in apparently healthy Latin-American subjects. In addition, Garg et al [29] reported that increasing number of metabolic abnormalities was inversely associated with the HOMA-B levels in USA adults. In the present study is performed for obese population, although individual components may not be associated with the HOMA-B levels, increases of metabolic syndrome components were inversely associated with the HOMA-B levels (P<0.001).
Obesity is the one of the factors responsible for T2DM. However, in order to develop into hyperglycemia, the human body must fail to produce sufficient insulin, and this is associated with the beta cells that secrete insulin. Even in the populations with obesity, in the absence of IR, beta cells are activated for insulin secretion when blood glucose increases [30, 31]. However, the beta cell function or mass is significantly reduced in subjects with IR, such as T2DM and metabolic synd- rome [32, 33]. In previous studies [34, 35], decreases in pancreatic beta cell mass were mainly seen in subjects with IR, implying that it is caused by an increase in beta cell apoptosis or necrosis or autophagy in the state of IR. Metabolic syndrome is characterized by IR [5], and the risk factors of metabolic syndrome are the strongly associated with oxidative stress or the elevated circulating concentration of free fatty acids [36], Oxidative stress increases in response to the increased production of reactive oxygen species, which is increased by the decrease of antioxidant enzymes. In particular, endo- plasmic reticulum stress is caused by prolonged high lipid molecules or insulin production, such as free fatty acids [9]. The de-differentiation and death of pancreatic beta cells are caused by IR [11], oxidative stress [37], and increased endoplasmic reticulum stress [38].
In conclusions, the relationship between the
HOMA-B levels and individual metabolic syndrome
components varies between countries and races. In the
present study, although individual components of
metabolic syndrome may not be associated with
HOMA-IR and HOMA-B levels, metabolic syndrome
component increases were positively associated with
insulin resistance and inversely associated with beta cell function in Korean adults with obesity. The present study has a limitation. Because this study was a cross-sectional study, the ability to establish a causal relationship between metabolic syndrome and the increased its components and pancreatic beta cell dysfunction was limited. Therefore, the more accurate results might be obtained by performing a cohort study.
요 약
본 연구는 대한민국 비만 성인에서 대사증후군과 대사증후군 구성요소의 증가와 인슐린저항성(homeostasis model assessment of insulin resistance, HOMA-IR) 및 베타세포 기능(homeostasis model assessment of beta cell function, HOMA-B)의 관련성을 조사하였다. 본 연구는 2010 년 국민건강영양조사 자료(2010 Korean National Health and Nutrition Examination Survey, KNHANES V-1)의 20세 이상 성인 1,860명을 대상으로 실시하였다. 본 연구의 주 요한 결과는 다음과 같다. 첫째, 대사증후군(P<0.001) 및 대사 증후군 구성요소의 증가(P<0.001)는 HOMA-IR의 증가와 관 련이 있었다. 둘째, 증가된 혈압군(P<0.001)과 증가된 혈당군 (P<0.001)의 HOMA-B는 정상군보다 낮았고, 복부비만군 (P=0.003)과 감소된 저밀도 콜레스테롤군(P=0.030)의 HOMA-B 는 정상군보다 높았다. 그럼에도 불구하고 대사증후군 및 대사 증후군 구성요소의 증가에 따라 HOMA-B은 감소하였다. 결론 적으로, 대한민국 비만 성인에서 대사증후군 및 대사증후군 구 성요소의 증가에 따라 인슐린저항성은 증가하였고 베타세포기 능은 감소하였다.
Acknowledgements: This paper was supported by Wonkwang Health Science University in 2020.
Conflict of interest: None
Author’s information (Position): Yoon H, Professor.
REFERENCES
1. Stefan N, Kantartzis K, Machann J, Schick F, Thamer C, Rittig K, et al. Identification and characterization of metabolically benign obesity in humans. Arch Intern Med. 2008;168:1609–1616.
https://doi.org/10.1001/archinte.168.15.1609
2. James PT, Leach R, Kalamara E, Shayeghi M. The worldwide obe- sity epidemic. Obes Res. 2001;9:228–233. https://doi.org/10.1038/
oby.2001.123
3. Kaidar-Person O, Bar-Sela G, Person B. The two major epi- demics of the twenty-first century: obesity and cancer. Obes Surg.
2011;21:1792–1797. https://doi.org/10.1007/s11695-011-0490-2 4. Spence-Jones G. Overview of obesity. Crit Care Nurs Q.
2003;26:83–88. https://doi.org/10.1097/00002727-200304000-00002 5. Reaven GM. Role of insulin resistance in human disease.
Diabetes. 1998;37:1598–1607. https://doi.org/10.2337/diab.37.
12.1595
6. Karter AJ, Mayer-Davis EJ, Selby JV, D’Agostino RB Jr D, Haffner SM, Sholinsky P, et al. Insulin sensitivity and abdominal obesity in African-American, Hispanic, and non-Hispanic white men and women: the Insulin Resistance and Atherosclerosis Study.
Diabetes. 1996;45:1547–1555. https://doi.org/10.2337/diab.45.
11.1547
7. Howard BV, Mayer-Davis EJ, Goff D, Zaccaro DJ, Laws A, Robbins DC, et al. Relationships between insulin resistance and lip- oproteins in nondiabetic African Americans, Hispanics, and non-Hispanic whites: the Insulin Resistance Atherosclerosis Study. Metabolism. 1998;47:1174–1179. https://doi.org/10.1016/
s0026-0495(98)90319-5
8. Kahn SE, Prigeon RL, Schwartz RS, Fujimoto WY, Knopp RH, Brunzell JD, et al. Obesity, body fat distribution, insulin sensi- tivity and islet beta-cell function as explanations for metabolic diversity. J Nutr. 2001;131:354–360. https://doi.org/10.1093/jn/
131.2.354S
9. Kim KA, Lee MS. Role and mechanism of pancreatic β-cell death in diabetes: the emerging role of autophagy. J Diabetes Invest.
2010;1:232–238. https://doi.org/10.1111/j.2040-1124.2010.00054.x 10. Kasuga M. Insulin resistance and pancreatic beta cell failure. J
Clin Invest. 2006;116:1756–1760. https://doi.org/10.1172/JCI29189 11. Baez-Duarte BG, Sánchez-Guillén MDC, Pérez-Fuentes R,
Zamora-Ginez I, Leon-Chavez BA, Revilla-Monsalve C, et al. β-cell function is associated with metabolic syndrome in Mexican subjects. Diabetes Metab Syndr Obes. 2010;3:309–311. https://
doi.org/10.2147/DMSOTT.S12375
12. Cubeddu LX, Hoffmann IS. Impact of traits of metabolic syn- drome on beta-cell function and insulin resistance in normal fasting, normal glucose tolerant subjects. Metabol Synd Relat Disord. 2012;10:344–350. https://doi.org/10.1089/met.2012.0040 13. Haffner SM, Mykkänen L, Festa A, Burke JP, Stern MP. Insulin-re-
sistant prediabetic subjects have more atherogenic risk factors than insulin-sensitive prediabetic subjects: implications for pre- venting coronary heart disease during the prediabetic state.
Circulation. 2000;101:975–980. https://doi.org/10.1161/01.cir.
101.9.975
14. Kitabchi AE, Temprosa M, Knowler WC, Kahn SE, Fowler SE, Haffner SM, et al. Role of insulin secretion and sensitivity in the evolution of type 2 diabetes in the Diabetes Prevention Program:
effects of lifestyle intervention and metformin. Diabetes. 2005;
54:2404–2414. https://doi.org/10.2337/diabetes.54.8.2404 15. Hanley AJ, Wagenknecht LE, D’Agostino RB Jr, Zinman B, Haffner
SM. Identification of subjects with insulin resistance and beta-cell dysfunction using alternative definitions of the metabolic syndrome. Diabetes. 2003;52:2740–2747. https://doi.org/10.2337/
diabetes.52.11.2740
16. Kim MK, Lee WY, Kang JH, Kang JH, Kim BT, Kim SM, et al. 2014
clinical practice guidelines for overweight and obesity in Korea.
Endocrinol Metab (Seoul). 2014;29:405–409. https://doi.org/10.
3803/EnM.2014.29.4.405
17. Matthews DR, Hosker JP, Rudenski AS, Naylor BA, Treacher DF, Turner RC. Homeostasis model assessment: insulin resistance and beta cell function from fasting plasma glucose and insulin con- centrations in man. Diabetologia. 1985;28:412–419. https://do- i.org/10.1007/BF00280883
18. Scragg R, Sowers M, Bell C. Serum 25-hydroxyvitamin D, dia- betes, and ethnicity in the third national health and nutrition ex- amination survey. Diabetes Care. 2004;27:2813–2818. https://
doi.org/10.2337/diacare.27.12.2813
19. Misra A, Chowbey PK, Makkar BM, Vikram NK, Wasir JS, Chadha D, et al. Consensus statement for diagnosis of obesity, abdominal obesity and the metabolic syndrome for Asian Indians and rec- ommendations for physical activity, medical and surgical management. J Assoc Physicians India. 2009;57:163–170. PMID:
19582986
20. Expert Panel on Detection, Evaluation, and Treatment of High Blood Cholesterol in Adults. Executive summary of the third re- port of the national cholesterol education program (NCEP) expert panel on detection, evaluation, and treatment of high blood cho- lesterol in adults (Adult Treatment Panel III). JAMA. 2001;
285:2486–2497. https://doi.org/10.1001/jama.285.19.2486 21. WHO Western Pacific Region; International Association for the
Study of Obesity Task Force. The Asia-Pacific perspective: re- defining obesity and its treatment. Sydney: Health Communicati- ons Australia; 2000. p15–21.
22. Yoon H, Kim GS, Kim SG, Moon AE. The relationship between metabolic syndrome and increase of metabolic syndrome score and serum vitamin D levels in Korean adults: 2012 Korean National Health and Nutrition Examination Survey. J Clin Biochem Nutr. 2015;57:82–87. https://doi.org/10.3164/jcbn.15-31 23. Yin J, Li M, Xu L, Wang Y, Cheng H, Zhao X, et al. Insulin resist- ance determined by homeostasis model assessment (HOMA) and associations with metabolic syndrome among Chinese children and teenagers. Diabetol Metab Syndr. 2013;5:71. https://do- i.org/10.1186/1758-5996-5-71
24. Ying X, Song Zh, Zhao Ch, Jiang Y. Association between homeo- stasis model assessment of insulin resistance (HOMA-IR) and components of metabolic syndrome in young Chinese men. Iran J Public Health, 2011;40:1–5. PMID: 23113066
25. Yamada C, Moriyama K, Takahashi E. Association between in- sulin resistance and metabolic syndrome risk factors in Japanese.
J Diabetes Investig. 2012;28:185-190. https://doi.org/10.1111/j.
2040-1124.2011.00162.x
26. Gobato AO, Vasques AC, Zambon MP, Barros Filho Ade A, Hessel G. Metabolic syndrome and insulin resistance in obese adolescents.
Rev Paul Pediatr. 2014;32:55–62. https://doi.org/10.1590/s0103- 05822014000100010
27. Margoth C, Carlos GT, Susana R, Marcos M. Prevalence of insulin resistance and its association with metabolic syndrome criteria
among Bolivian children and adolescents with obesity. BMC Pediatr. 2008;8:31. https://doi.org/10.1186/1471-2431-8-31 28. Imamura F, Mukamal KJ, Meigs JB, Luchsinger JA, Ix JH, Siscovick
DS, et al. Risk factors for type 2 diabetes mellitus preceded by β -cell dysfunction, insulin resistance, or both in older adults: the cardiovascular health study. Am J Epidemiol. 2013;177:1418–
1429. https://doi.org/10.1093/aje/kws440
29. Garg MK, Dutta MK, Mahalle N. Study of beta-cell function (by HOMA model) in metabolic syndrome. Indian J Endocrinol Metab. 2011;15(Suppl 1):44–49. https://doi.org/10.4103/2230- 8210.83059
30. Liu YQ, Jetton TL, Leahy JL. Beta cell adaptation to insulin resistance. Increased pyruvate carboxylase and malate-pyruvate shuttle activity in islets of nondiabetic Zucker fatty rats. J Biol Chem. 2002;277:39163–39168. https://di.org/10.1074/jbc.M207157200 31. Chen C, Hosokawa H, Bumbalo LM, Leahy JL. Mechanism of compensatory hyperinsulinemia in normoglycemic in- sulin-resistant spontaneously hypertensive rats. Augmented enzy- matic activity of glucokinase in beta-cells. J Clin Invest. 1994;
94:399–404. https://doi.org/10.1172/JCI117335
32. Shimabukuro M, Zhou YT, Levi M, Unger RH. Fatty acid-induced beta cell apoptosis: a link between obesity and diabetes. Proc Natl Acad Sci USA. 1998;95:2498–2502. https://doi.org/10.1073/
pnas.95.5.2498
33. Kaneto H, Kajimoto Y, Miyagawa J, Matsuoka T, Fujitani Y, Umayahara Y, et al. Beneficial effects of antioxidants in diabetes:
possible protection of pancreatic beta-cells against glucose toxicity. Diabetes. 1999;48:2398–2406. https://doi.org/10.2337/
diabetes.48.12.2398
34. Deng S, Vatamaniuk M, Huang X, Doliba N, Lian MM, Frank A, et al. Structural and functional abnormalities in the islets isolated from type 2 diabetic subjects. Diabetes. 2004;53:624–632. https://
doi.org/10.2337/diabetes.53.3.624
35. Gunton JE, Kulkarni RN, Yim S, Okada T, Hawthorne WJ, Tseng YH, et al. Loss of ARNT/HIF1 beta mediates altered gene ex- pression and pancreatic islet dysfunction in human type 2 diabetes. Cell. 2005;122:337–349. https://doi.org/10.1016/j.cell.
2005.05.027
36. Laws A, Hoen HM, Selby JV, Saad MF, Haffner SM, Howard BV.
Differences in insulin suppression of free fatty acid levels by gen- der and glucose tolerance status. Relation to plasma triglyceride and apolipoprotein B concentrations: insulin resistance athero- sclerosis study (IRAS) Investigators. Arterioscler Thromb Vasc Biol. 1997;17:64–71. https://doi.org/10.1161/01.atv.17.1.64 37. Robertson RP, Zhou H, Zhang T, Harmon JS. Chronic oxidative
stress as a mechanism for glucose toxicity of the beta cell in type 2 diabetes. Cell Biochem Biophys. 2007;48:139–146. https://do- i.org/10.1007/s12013-007-0026-5
38. Zhou L, Zhang J, Fang Q, Liu M, Liu X, Jia W, et al. Autophagy- mediated insulin receptor down-regulation contributes to endo- plasmic reticulum stress-induced insulin resistance. Mol Pharmacol.
2009;76:596–603. https://doi.org/10.1124/mol.109.057067