Introduction
Flatfoot is a state in which the medial longi- tudinal arch has collapsed or become abnor- mally low (Kitaoka et al, 1998) and is divided into rigid flatfoot and flexible flatfoot (Flemister et al, 2007). In flexible flatfoot, the medial longitudinal arch appears as normal in a state where the body’s weight is not being supported. However, when the
body’s weight is being supported, the medial longi- tudinal arch collapses excessively (Mosca, 2010;
Neumann, 2010). Flexible flatfoot may cause ex- cessive stretching of the foot’s intrinsic muscle, dys- function of the posterior tibial tendon, excessive stretching of the plantar fascia, and an abnormally pronated foot (Flemister et al, 2007).
Interventions for flexible flatfoot are footwear, foot orthoses, foot insoles, and the adhesive taping Corresponding author: Chung-hwi Yi [email protected]
Biomechanical Effectiveness of the Low-Dye Taping on Peak Plantar Pressure During Treadmill Walking Exercise in
Subjects With Flexible Flatfoot
One-bin Lim1, MSc, PT, Jeong-ah Kim1, MSc, PT, Oh-yun Kwon2,3, PhD, PT, Chung-hwi Yi2,3, PhD, PT
1Dept. of Physical Therapy, The Graduate School, Yonsei University
2Dept. of Physical Therapy, College of Health Science, Yonsei University
3Dept. of Ergonomic Therapy, The Graduate School of Health Science, Yonsei University
Abstract
1)The purposes of this study were 1) to determine the effects of low-dye taping on peak plantar pressure following treadmill walking exercise, 2) to determine whether the biomechanical effectiveness of low-dye taping in peak plantar pressure was still maintained following removal of the tape during treadmill walking, and 3) to determine the trend towards a medial-to-lateral shift in peak plantar pressure in the midfoot region before and after application of low-dye taping. Twenty subjects with flexible flatfoot were recruited using a navicular drop test. The peak plantar pressure data were recorded during five treadmill walking sessions: (1) un-taped, (2) baseline-taped, (3) after a 10-minute treadmill walking exercise, (4) after a 20-minute treadmill walking exercise, and (5) after removal of the taping. The foot was divided into six parts during the data analysis. One-way repeated measures analysis of variance was performed to investigate peak plantar pressure variations in the six foot parts in the five sessions.
This study resulted in significantly increased medial forefoot peak plantar pressure compared to the un-taped condition (p=.017, post 10-minute treadmill walking exercise) and (p=.021, post 20-minute treadmill walking exercise). The peak plantar pressure in the lateral forefoot showed that there was a significant decrease after sessions of baseline-taped (p=.006) and 10-minute of treadmill walking exercise (p=.46) compared to the un-taped condition. The tape removal values were similar to the un-taped values in the five sessions. Thus, the findings of the current study may be helpful when researchers and clinicians estimate single taping effects or consider how frequently taping should be replaced for therapeutic purposes. Further studies are required to investigate the evidence in support of biomechanical effectiveness of low-dye taping in the midfoot region.
Key Words: Flatfoot; Low-dye taping; Peak plantar pressure; Treadmill walking exercise.
method. A recent systematic review reported that the adhesive taping method was more effective than footwear and foot orthoses in controlling excessive pronated feet (Cheung et al, 2010). One adhesive taping method is low-dye taping. Low-dye taping provides support to the medial longitudinal arch from the outside relative to the sole by applying the tape while pulling toward the inside (Holmes et al, 2002;
Radford et al, 2006; Whitaker et al, 2003). Low-dye taping is used for the managing of symptoms and pain associated with excessive pronated feet at the subtalar joint (Radford et al, 2006). The pronation movement itself is a functionally essential movement, helping in the medial transfer of weight across the foot throughout the stance phase of gait (Nolan and Kennedy, 2009). However, excessive pronation hap- pens while the subtalar joint remains pronated be- yond the midstance phase of the gait (Brukner and Khan, 2011). This excessive pronation is associated with an increased soft tissue stress and risk of low- er limb overuse injury (Kaufman et al, 1999;
Vicenzino et al, 2000). Low-dye taping helps de- crease excessive pronation by generating an external supinating force medial to the subtalar joint axis, specifically at the medial plantar surface of the foot (Del Rossi et al, 2004). Low-dye taping assists in in- creasing medial longitudinal arch support and bringing the subtalar joint closer to its neutral position.
Plantar pressure distribution is a commonly used method in rehabilitation and related research. One way to evaluate whether low-dye taping decreases pronation in the foot is by measuring the change in plantar pressure distribution. Although a direct rela- tion between plantar pressure and subtalar joint movement has not been established, it is assumed that changes in subtalar joint alignment during the stance phase of gait causes a change in plantar pressure distribution (Lange et al, 2004; Nolan and Kennedy, 2009; O’Sullivan et al, 2008; Russo and Chipchase, 2001). Previous studies have reported that low-dye taping is an effective intervention on plantar pressure distribution throughout the stance phase of
gait by decreasing plantar pressure along the medial side of the foot in both subjects with and without flexible flatfoot (Lange et al, 2004; Russo and Chipchase, 2001). However, these studies investigated only the immediate effects of low-dye taping, and the effects following application over a prolonged period of activity (10 or 20 minutes) are unknown.
Nolan and Kennedy (2009) investigated the imme- diate effects of low-dye taping on peak plantar pres- sure post-application and whether the effects of low-dye taping on peak plantar pressure were main- tained following walking exercise on a flat, level, rectangular-shaped track outdoors. After the walking exercise, the data on plantar pressure distribution were collected by a 10-meter walk recording test.
This study’s results showed that the reduced lateral forefoot peak pressure of the taping’s initial effect disappeared after a 10-minute walk, but that low-dye taping continued to have an effect on the medial forefoot after a 20-minute walk, indicating increased pronation. This continue might have been due to in- direct effects of the low-dye taping, or perhaps as a result of the walking exercise itself. To our knowl- edge, no previous research has investigated the ef- fects of low-dye taping on plantar pressure dis- tribution during treadmill walking and during walk- ing after removal of the low-dye taping.
It is clinically important to discern how long a patient can be supported from a single taping and how often the taping must be replaced for ther- apeutic purposes. Therefore, the purposes of this study were 1) to determine the biomechanical effec- tiveness of low-dye taping on peak plantar pressure following three periods of continual application (0, 10, and 20 minutes) on a treadmill, 2) to determine whether the biomechanical effectiveness of low-dye taping in peak plantar pressure was maintained fol- lowing removal of the tape during treadmill walking, and 3) to determine the trend towards a me- dial-to-lateral shift in peak plantar pressure on the midfoot before and after application of the low-dye taping. We hypothesized that the effects of low-dye
taping on peak plantar pressure would be maintained both following the three periods of continual applica- tion (0, 10, and 20 minutes) and following removal of the tape during treadmill walking. The trend towards a medial-to-lateral shift in peak plantar pressure would increase in the midfoot after application of the low-dye taping.
Methods
Subjects
Twenty subjects (8 males and 12 females) with flexible flatfoot volunteered to participate in this study (Table 1). The subjects were initially screened for eligibility to participate in the study using the following criteria. The subjects who were included had: 1) greater than 10 ㎜ discrepancy in a navicular drop test, indicative of excessive pronation (Cote et al, 2005); 2) less than 5 ㎜ discrepancy in leg length (Hong et al, 2012); and 3) normal muscle strength and normal range of motion in the lower limbs (Hong et al, 2012). The subjects who were excluded had: 1) tape allergies (excessive redness/rash/skin peeling) (Nolan and Kennedy, 2009), 2) a history of lower leg surgery (Hong et al, 2012), 3) ortho- pedic maladies that would prevent a normal stance (Ledoux and Hillstrom, 2002), and 4) persistent pain of the lower leg in the past six months (Hong et al, 2012). Each subject signed an informed consent form, and the rights of each subject were protected. The re- search protocol was approved by the Yonsei
University Wonju Campus Human Studies Committee (IRB: 1041849-201501-BM-004-02).
Instrumentation
Navicular drop test
The navicular drop test is commonly used as a method for measuring excessive pronation at the subtalar joint (Vinicombe et al, 2001). The most prom- inent side of the navicular tuberosity was marked with a spot. The first placement was marked on an index ruler at the spot level when the subjects kept the subtalar joint in a neutral sitting position. The examiner arrayed the index ruler perpendicular to the medial aspect of the foot. The subtalar joint was considered to be in a neutral position when the talar head was positioned equally between the examiner’s thumb and index finger. The second placement was marked on the index ruler when the subject sus- tained equal weight on each foot while standing. The distance between the two placements on the index ruler indicated the amount of navicular tuberosity drop from the neutral subtalar joint position to the standing position. A distance value more than 10 ㎜ was deemed to indicate the flatfoot condition (Cote et al, 2005). Before the test, to reduce measurement er- ror, the examiner practiced the test procedure during 10 hours of hands-on training. Good intra-rater reli- ability for the navicular drop test had been estab- lished in a previous study (Vinicombe et al, 2001).
Peak plantar pressure measurement The Tekscan insole pressure system (F-Scan Versa System, Tekscan Inc., MA, USA) was used to meas- ure peak plantar pressure (Figure 1). The Tekscan system consists of a thin two-layer (.18 ㎜) insole sensor containing 960 individual pressure sensors.
This system is useful for evaluating plantar pressure distribution under constant conditions. F-Scan Research ver. 6.70 software (F-Scan Versa System, Tekscan Inc., MA, USA) was used to record and analyze the plantar pressure data. The reliability of in-shoe plan-
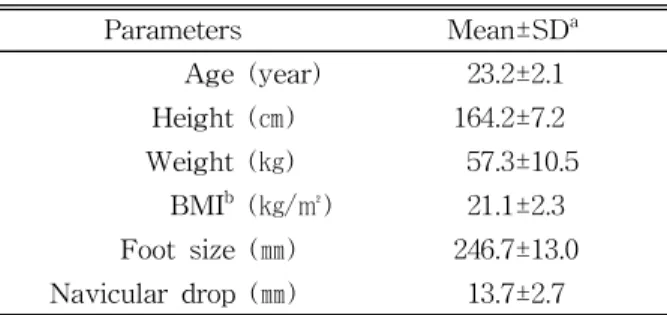
Parameters Mean±SDa
Age (year) 23.2±2.1
Height (㎝) 164.2±7.2
Weight (㎏) 57.3±10.5
BMIb (㎏/㎡) 21.1±2.3
Foot size (㎜) 246.7±13.0 Navicular drop (㎜) 13.7±2.7
amean±standard deviation, bbody mass index.
Table 1. Characteristics of subjects (N=20)
tar pressure has been shown to exhibit good to ex- cellent reliability (Vidmar and Novak, 2009).
Taping method
The taping method for this study was low-dye taping, which is described by Vicenzino et al (1997) (Figure 1). A 38-㎜-wide rigid sports tape (Battlewin tape, Nichiban Co. Ltd., Tokyo, Japan) was applied to all subjects by the same examiner to ensure consistency. The subjects were asked to position in long-sitting with the foot in both talocrural and sub- talar joint neutral, as palpated by the examiner. The foot to be taped was cleaned with warm water, and any hair in the region was removed to maximize tape adherence. Longitudinal arch support strips were pulled in a lateral-to-medial direction along the lat- eral side of the foot beginning at the head of the fifth metatarsal and finishing at the head of the first metatarsal. This was followed by transverse arch support strips pulled in a lateral-to-medial direction under the plantar surface of the foot beginning at the anterior surface of the calcaneus and finishing at the heads of the metatarsals. The taping was com- pleted with an additional longitudinal arch support strip applied to provide additional assistance in se- curing the transverse arch support strips.
Procedures
After performing the navicular drop test, all sub- jects wore standard laboratory shoes provided by the examiner to minimize the possible confounding ef-
fects of different shoes. The shoes used for the study were thin and flat shoes. The insole sensors were cut to the subject’s foot size. The insole sensor connector was put into cuffs attached to the ankle via a Velcro strap. The subject placed the ankle strap around their ankle and wore a waist belt with a wireless data-logger unit. When the Tekscan sys- tem was in place, the examiner explained the overall experimental procedures to the subject.
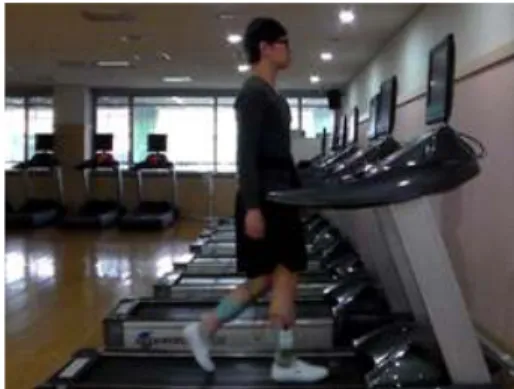
Prior to testing, all subjects were familiarized with the device for approximately five minutes (Bacarin et al, 2009). Following this familiarization, insole cali- bration was performed as per the Tekscan system guidelines. This involved the subject being asked to place full body weight on each foot for 1 second while in a standing position. The duration of 1 sec- ond was chosen as this best matched the duration of the stance period during gait in this study. All data were obtained while the subjects walked on a tread- mill at a 3.5∼4.0 ㎞/h speed, which is the average walking speed of a normal person (Petersen et al, 2012) (Figure 2). For the treadmill walking activity, a minimum of 10 steps was obtained at a frequency of 50 frames/second. Subjects were asked to walk at their normal, comfortable pace, looking straight ahead. The same insole was used during each of the five walks performed throughout the session, and peak plantar pressure was recorded as follows:
Session 1: The first treadmill walking session was carried out in an un-taped condition. Session 2: After session 1, the examiner applied low-dye taping to
Figure 1. Low-dye taping. Figure 2. Treadmill walking activity.
the subject’s foot, and more than 10 steps of peak plantar pressure data were recorded. Session 3: A twenty-minute duration was chosen as a previous study (Harradine et al, 2001) reported that low-dye taping had totally lost its effect on the rearfoot mo- tion after 30 minutes of walking. However, to exam- ine the possibility of the tape losing its effectiveness in less time, the treadmill walking exercise compo- nent was divided into two 10-minute periods of treadmill walking, and the data were obtained after each walk. After the first 10-minute treadmill walk, peak plantar pressure data were recorded. Session 4:
After the 20-minute treadmill walk, peak plantar pressure data were recorded. Session 5: After re- moval of the tape, peak plantar pressure data were obtained. The subjects were not permitted to use the handrails during the sessions.
Data analysis
The dominant foot from each subject was utilized for analysis to meet the assumption of independence (Menz et al, 2004) and was defined by inquiring as to which foot would be used to kick a ball. Data from each treadmill walking activity obtained by the Tekscan system were visually represented in movie format by the F-Scan Research ver. 6.70 software.
Mean peak plantar pressure data from eight stance phases occurring mid-walk were used for the data analysis. Mid-walk data were chosen to avoid accel- eration or deceleration effects, which could influence the result (Bacarin et al, 2009). Before analyzing the data, certain foot cells of each subject’s movies were edited according to the Tekscan system guidelines.
This was used in the locations where “shorts” had developed, which caused insole cells to appear to be loaded when they were not. For each subject’s movie, the foot was separated into six distinct grids, or
“panes” demonstrating the different anatomical parts of the foot. The location of these panes remained constant for the analysis of a subject’s five walks.
However, different grids were used for each subject so as to adapt to variations in the subjects’ foot size
(Nolan and Kennedy, 2009). For each of the six panes, the mean peak plantar pressure over the eight stance phases of the movie was analyzed by the F-Scan Research ver. 6.70 software. The remaining six parts were the medial forefoot, lateral forefoot, medial midfoot, lateral midfoot, medial rearfoot, and lateral rearfoot (Nolan and Kennedy, 2009). The me- dial-to-lateral shift as a dependent variable is de- monstrative of an anti-pronatory pressure change in the midfoot region (Del Rossi et al, 2004).
Statistical analysis
A one-sample Kolmogorov-Smirnov Z-test was conducted to determine whether continuous data ap- proximated a normal distribution. A one-way re- peated measures analysis of variance (ANOVA) was used to determine the significant difference between the peak plantar pressure variations in the six foot parts in the five sessions (Session 1: first treadmill walking in an un-taped condition; Session 2: second treadmill walking with baseline-taping; Session 3: post 10-minute treadmill walking; Session 4: post 20-minute treadmill walking; Session 5: after removal of the tape). If significant differences in the five sessions were found, post-hoc simple analysis using contrast comparison test of each session period with the first session period was conducted to determine differ- ences among the levels within the subjects factor, following statistical advice. Paired t-tests were used to determine the significance of peak plantar pressure variations between medial midfoot and lateral midfoot in the five testing conditions. The level of sig- nificance was set at α=.05. Statistical analysis was performed using SPSS ver. 21.0 software (SPSS Inc., Chicago, IL, USA). All the data were expressed as the mean and standard deviation.
Results
All the peak plantar pressure data of the 20 sub- jects is shown in Table 2.
Forefoot
The result of the one-way repeated ANOVA of peak plantar pressure in the medial forefoot showed that there were significant differences (F=3.593, p=.029) between the five sessions. Each session re- sulted in significant increases in medial forefoot peak plantar pressure (p=.017, post 10-minute treadmill walking exercise session; and p=.021, post 20-minute treadmill walking exercise session) in comparison to the un-taped condition. However, there was no sig- nificant differences between the un-taped condition and the baseline-taped condition (p=.380). The values from removal of the tape were similar to the un-taped values (p=.532). Peak plantar pressure in the lateral forefoot showed significant differences (F=3.770, p=.024) between the five sessions. A simple contrast test in the un-taped first session showed a significant decrease in lateral forefoot peak plantar pressure after application of the low-dye taping (p=.006, baseline-taped; p=.46, post 10-minute tread- mill walking exercise session). However, no sig-
nificant difference was observed between the un-tap- ed values and after the 20-minute treadmill walking exercise session values (p=.950). Also, no significant difference was observed between the un-taped values and removal of the tape values (p=.946). The values from after the 20-minute treadmill walking exercise session and tape removal were similar to the un-taped values.
Midfoot
The result of the one-way repeated ANOVA of peak plantar pressure in the medial forefoot showed that there were no significant differences between the five sessions (F=.348, p=.841). The results of the paired t-tests of the medial-to-lateral shift in pressure in the midfoot region showed that there were not statistically significant differences between any of the five sessions (p=.316, un-taped; p=.088, baseline-taped;
p=.170, post 10-minute treadmill walking exercise ses- sion; p=.228, post 20-minute treadmill walking exercise session; and p=.278, removal of the tape) (Table 3).
Un-taped Baseline-taped Post 10-minute Post 20-minute After removal of the tape Medial forefoot 310.30±86.94a 325.55±83.72 345.80±82.08* 349.90±87.81* 314.05±82.66 Lateral forefoot 291.30±87.11 251.90±72.33* 276.60±73.84* 293.05±119.83 292.25±66.28 Medial midfoot 102.70±42.94 98.20±47.12 98.55±55.82 101.5±45.72 107.40±44.97 Lateral midfoot 111.75±42.79 120.60±69.27 121.50±61.73 120.30±59.62 120.05±51.42 Medial rearfoot 255.40±64.11 221.55±49.31 225.05±74.45 241.05±72.63 253.65±88.69 Lateral rearfoot 246.60±62.01 230.10±68.99 243.00±108.76 246.05±89.92 246.25±64.31
amean±standard deviation, *significance differences compared to un-taped.
Table 2. Peak plantar pressure data (Unit=㎪)
Medial midfoot Lateral midfoot Mean difference (95 CIa) p
Un-taped 102.70±42.94b 111.75±42.94 9.05 (-27.44 to 9.34) .316
Baseline-taped 98.20±47.12 120.60±68.27 22.40 (-48.49 to 3.69) .088 Post 10-minute 98.55±55.82 121.50±61.73 22.95 (-56.59 to 10.69) .170 Post 20-minute 101.45±45.72 120.30±59.62 18.85 (-50.52 to 12.82) .228 After removal of the tape 107.40±44.97 120.05±51.42 12.65 (-36.34 to 11.04) .279
aconfidence interval, bmean±standard deviation.
Table 3. Medial-to-lateral shift in peak plantar pressure in the midfoot region (Unit=㎪)
Rearfoot
Peak plantar pressure in the medial rearfoot showed no significant differences among the five sessions (F=2.139, p=.141). A simple contrast test in the un-taped first session showed no significant de- crease in medial rearfoot peak plantar pressure be- tween any of the five sessions (p=.096, base- line-taped; p=.152, post 10-minute treadmill walking exercise session; p=.516, post 20-minute treadmill walking exercise session; and p=.941, removal of the tape). The values of the tape removal were similar to the un-taped values. Peak plantar pressure in the lateral rearfoot across the five testing conditions showed no significant differences between the five sessions (F=.983, p=.444). A simple contrast test with the un-taped first session showed no significant de- crease in medial rearfoot peak plantar pressure be- tween any of the five sessions (p=.058, base- line-taped; p=.873, post 10-minute treadmill walking exercise session; p=.977, post 20-minute treadmill walking exercise session; and p=.965, removal of the tape). The values of the tape removal were similar to the un-taped values.
Discussion
In this study, we investigated the biomechanical effect of low-dye taping during treadmill walking on peak plantar pressure following three continual appli- cations (0, 10, and 20 minutes), investigated whether the effect of low-dye taping was maintained after removal of the tape, and examined the trend towards a medial-to-lateral shift on the midfoot before and after application of the low-dye taping.
An explanation for the immediate effect of low-dye taping in these results is as follows. Peak plantar pressure in the lateral forefoot had sig- nificantly decreased following the first baseline-taped session when compared to that of the un-taped condition. These results are in close agreement with the findings of Lange et al (2004), Russo and
Chipchase (2001), and Nolan and Kennedy (2009).
Low-dye taping can improve control of the midtarsal joint motion, preventing the molding of the forefoot to the ground and consequently decreasing peak plantar pressure in the lateral forefoot (Lange et al, 2004). The current study showed a different mecha- nism from that of Vicenzino et al (2007), which showed increased lateral forefoot peak plantar pres- sure following the immediate application of taping.
But this outcome may be due to the different taping techniques in studies. While the current study and other previous studies have experimented using just the standard augmented low-dye taping, Vicenzino et al (2007) added two other taping techniques (calcaneal slings and reverse 6s) and used them randomly. The techniques showed more widely dis- tributed plantar pressures at the forefoot and rearfoot than other previous studies.
In this study, the main region of foot was the medial midfoot. We assumed that the immediate ap- plication of low-dye taping may decrease the peak plantar pressure by supporting the medial longi- tudinal arch of foot during midstance phase of the gait. Interestingly, this study results tended to reveal decreased peak plantar pressure after immediate ap- plication of the taping. However, there was no stat- istically significant difference between the un-taped and baseline-taped conditions in the midfoot region.
Therefore, we couldn’t conclude that low-dye taping is an effective intervention for the medial longitudinal arch. Lange et al (2004) showed that there was no significant decrease in the peak plantar pressure in the medial midfoot region during midstance phase of the gait after immediate application of low-dye taping. The trends of previous outcomes are con- sistent with those of present study. The reason of the lack of significant peak plantar pressure is that the adhesion of tape was reduced (Lange et al, 2004). It was not enough to support the medial longi- tudinal arch during dynamic walking on a treadmill.
Thus, future studies need to test in the same con- ditions after increased dosage of transverse arch
support strip taping to support the medial longi- tudinal arch.
The study results tended to reveal that the de- crease in rearfoot peak plantar pressure in medial rearfoot and lateral rearfoot after the immediate ap- plication of low-dye taping. However, there was no statistically significant difference between the un- taped and baseline-taped conditions in the rearfoot region. These trends agree with the findings obtained by Nolan and Kennedy (2009). The decrease in rear- foot peak plantar pressure with immediate tape ap- plication may represent an overall controlling of foot hypermobility rather than an actual tape-induced re- striction in the subtalar joint pronation (Nolan and Kennedy, 2009). This biomechanical mechanism may indicate that low-dye taping may be an aid for hy- permobility of the foot and consequently increase the load transfer from the rearfoot to the lateral midfoot throughout the stance phase of gait.
Explanations for following a period of continual application and following removal of the tape are as follows. Following the 20-minute treadmill walking exercise session, peak plantar pressure in the lateral forefoot was similar to that of the un-taped values.
Peak plantar pressure in the lateral forefoot following removal of the tape also returned to the level of the un-taped condition. Peak plantar pressures in the midfoot and rearfoot regions indicated similar re- gressions following their initial values, low-dye tap- ing-induced trends. This trend could explain that the taping’s effectiveness declined as a result of reduced adhesiveness to the skin or decreased tape tensile strength (Ator et al, 1991).
Peak plantar pressure in the medial forefoot sig- nificantly increased after the 10-minute and 20-minute treadmill walking exercise sessions. These results are in close agreement with the findings of Nolan and Kennedy (2009). Nolan and Kennedy’s (2009) results showed higher values after 10-minute and 20-minute exercise sessions than in the un-taped condition in the medial forefoot region. In the current study, peak plantar pressure in the medial forefoot after removal
of the tape returned to its un-taped level. This in- dicates that for the medial forefoot region, low-dye taping might actually increase its effect up to 20 mi- nutes of exercise, and then its effect disappears after removing the tape.
This study is the first to investigate low-dye tap- ing’s biomechanical effects on peak plantar pressure following removal of the taping during treadmill walking exercise; no previous hypothesis can be re- ferred to. One possibility is that subjects with flexi- ble flatfoot may adapt to treadmill walking through muscular compensation with the tibialis, peroneus, and fibularis muscles (Mulligan and Cook, 2013). In addition to intrinsic foot muscles, extrinsic factors may include integration of visual, auditory, somato- sensory, and other proprioceptive systems, as well as biomechanical factors (Kim et al, 2014). A previous study reported that post-application of low-dye tap- ing produced decreases in tibialis anterior and tibialis posterior activity as well as increases in arch height (Franettovich et al, 2010). However, following the re- moval of low-dye taping, the changes in leg muscle activity and foot posture did not persist. These pre- vious findings suggest that the low-dye taping itself may generate carry-over effects in soft tissue structures. Thus, increased medial forefoot pressure after both 10-minute and 20-minute treadmill walking exercise sessions may be associated with a car- ry-over effect in foot muscle activity following the initial facilitation from the tape. However, this car- ry-over effect may not appear following removal of the low-dye taping. Excessively pronated feet in- creased soft tissue stress and risk of lower limb overuse injury due to the increased medial transfer of weight across the foot throughout the stance phase of gait. Thus, the high medial forefoot peak plantar pressure present after both 10-minute and 20-minute treadmill walking exercise sessions is not desirable as it represents increased pronation at the subtalar joint.
The lack of significant medial-to-lateral shift in peak plantar pressure in the midfoot region across
the five sessions suggests that the low-dye taping did not succeed in restricting pronation. However, the current results showed that medial-to-lateral shifts in the midfoot increased. This trend is consistent with the previous findings obtained by Nolan and Kennedy (2009) and Russo and Chipchase (2001).
The medial-to-lateral shift has been thought to be a characteristic of an anti-pronatory pressure change in the region because the low-dye tape may generate an external supinating force medial to the subtalar joint axis, specifically at the medial plantar surface of the foot (Del Rossi et al, 2004). One reason for no significant differences in current study may be due to the small sample size. This could explain the lack of a significant difference in the midfoot region.
There are research limitations in this study. First, this study included only the activity of treadmill walking. Further studies on the flatfoot condition should include other functional activities such as running and jumping. Second, this study used only peak plantar pressure data as the dependent variable for explaining the biomechanical effects of low-dye taping while the tape was in situ and immediately fol- lowing its removal. Considering other biomechanical and neuromuscular dependent variables, which may include lower limb motion, foot mobility, and foot muscle activity are needed in future research. Third, the generalizability of these results is limited because the subjects were asymptomatic and between 20~26 years of age. Further research should investigate subjects with pathological symptoms. The present in a symptomatic individual and individual age may af- fect the peak pressure outcomes.
Conclusion
In conclusion, the present study found that the only immediate post-application effect of low-dye taping was a decrease in peak plantar pressure in the lateral forefoot. This effect of taping was lost after the 10-minute treadmill walking exercise
session. The high medial forefoot peak plantar pres- sure present after both the 10-minute and 20-minute treadmill walking exercise sessions are not desirable, as they represent increased pronation at the subtalar joint. This result may be associated with the low- dye taping itself generating carry-over effects in soft tissue structures of forefoot region. Peak plantar pressure in the six foot regions following removal of the tape returned to its un-taped level. Overall, sig- nificant extensive anti-pronatory pressure changes did not occur either on continual application of the low-dye taping or removal of the tape during tread- mill walking. Thus, the findings may be helpful when researchers and clinicians estimate single tap- ing effects or consider how frequently taping should be replaced for therapeutic purposes.
References
Ator R, Gunn K, McPoil TG, et al. The effect of ad- hesive strapping on medial longitudinal arch support before and after exercise. J Orthop Sports Phys Ther. 1991;14(1):18-23.
Bacarin TA, Sacco IC, Hennig EM. Plantar pressure distribution patterns during gait in diabetic neu- ropathy patients with a history of foot ulcers.
Clinics (Sao Paulo). 2009;64(2):113-120.
Brukner P, Khan K. Clinical Sports Medicine. 4th ed.
Sydney, McGraw-Hill, 2011:86-92.
Cheung RT, Chung RC, Ng GY. Efficacies of differ- ent external controls for excessive foot prona- tion: A meta-analysis. Br J Sports Med. 2010;
45(9):743-571. http://dx.doi.org/10.1136/bjsm.2010.
079780
Cote KP, Brunet ME, Gansneder BM, et al. Effects of pronated and supinated foot postures on stat- ic and dynamic postural stability. J Athl Train.
2005;40(1):41-46.
Del Rossi G, Fiolkowski P, Horodyski MB, et al. For how long do temporary techniques maintain the height of the longitudinal arch? Phys Ther
Sport. 2004;5:84-89.
Flemister AS, Neville CG, Houck J. The relationship between ankle, hindfoot, and forefoot position and posterior tibial muscle excursion. Foot Ankle Int. 2007;28(4):448-455.
Franettovich M, Chapman AR, Blanch P, et al.
Augmented low-dye tape alters foot mobility and neuromotor control of gait in individuals with and without exercise related leg pain. J Foot Ankle Res. 2010;18(3):5. http://dx.doi.org/
10.1186/1757-1146-3-5
Harradine P, Herrington L, Wright R. The effect of low-dye taping upon rearfoot motion and posi- tion before and after exercise. The Foot. 2001;
11:57-60.
Hintermann B, Nigg BM. Pronation in runners.
Implications for injuries. Sports Med. 1998;26(3):
169-176.
Holmes CF, Wilcox D, Fletcher JP. Effect of a modi- fied, low-dye medial longitudinal arch taping procedure on the subtalar joint neutral position before and after light exercise. J Orthop Sports Phys Ther. 2002;32(5):194-201.
Hong JA. Effects of orthotic insole on peak plantar pressure, center of pressure trajectory, and muscle activity of lower limb during one leg standing in adults with flexible flat foot. Seoul, Yonsei University, Master Thesis. 2012.
Kaufman KR, Brodine SK, Shaffer RA, et al. The effect of foot structure and range of motion on musculoskeletal overuse injuries. Am J Sports Med. 1999;27(5):585-593.
Kitaoka HB, Luo ZP, An KN. Three-dimensional analysis of flatfoot deformity: Cadaver study.
Foot Ankle Int. 1998;19(7):447-451.
Kim JA, Lim OB, Yi CH. Difference in static and dynamic stability between flexible flatfeet and neutral feet. Gait Posture. 2015;41(2);546-550.
http://dx.doi.org/10.1016/j.gaitpost.2014.12.012 Lange B, Chipchase L, Evans A. The effect of
low-dye taping on plantar pressures, during gait, in subjects with navicular drop exceeding
10 mm. J Orthop Sports Phys Ther. 2004;34(4):
201-209.
Ledoux WR, Hillstrom HJ. The distributed plantar vertical force of neutrally aligned and pes planus feet. Gait Posture. 2002;15(1):1-9.
Menz HB, Latt MD, Tiedemann A, et al. Reliability of the gaitrite walkway system for the quantifi- cation of temporo-spatial parameters of gait in young and older people. Gait Posture. 2004;20 (1):20-25.
Mosca VS. Flexible flatfoot in children and adolescents. J Child Orthop. 2010;4(2):107-121.
http://dx.doi.org/10.1007/s11832-010-0239-9 Mulligan EP, Cook PG. Effect of plantar intrinsic
muscle training on medial longitudinal arch morphology and dynamic function. Man Ther.
2013;18(5):425-430. http://dx.doi.org/10.1016/j.math.
2013.02.007
Neumann DA. Kinesiology of the Musculoskeletal System: Foundations for rehabilitation. 2nd ed.
St Louis, Mosby, 2010:593-595.
Nolan D, Kennedy N. Effects of low-dye taping on plantar pressure pre and post exercise: An ex- ploratory study. BMC Musculoskelet Disord. 2009;
10:40. http://dx.doi.org/10.1186/1471-2474-10-40 O’Sullivan K, Kennedy N, O’Neill E, et al. The effect
of low-dye taping on rearfoot motion and plan- tar pressure during the stance phase of gait.
BMC Musculoskelet Disord. 2008;9:111. http://
dx.doi.org/10.1186/1471-2474-9-111
Petersen TH, Willerslev-Olsen M, Conway BA, et al.
The motor cortex drives the muscles during walking in human subjects. J Physiol. 2012;
590(10):2443-2452. http://dx.doi.org/10.1113/jphysiol.
2012.227397
Radford JA, Burns J, Buchbinder R, et al. The effect of low-dye taping on kinematic, kinetic, and electromyographic variables: A systematic review. J Orthop Sports Phys Ther. 2006;36(4):
232-241.
Russo SJ, Chipchase LS. The effect of low-dye tap- ing on peak plantar pressures of normal feet
during gait. Aust J Physiother. 2001;47(4):
239-244.
Tome J, Nawoczenski DA, Flemister A, et al.
Comparison of foot kinematics between subjects with posterior tibialis tendon dysfunction and healthy controls. J Orthop Sports Phys Ther.
2006;36(9):635-644.
Vicenzino B, Feilding J, Howard R, et al. An inves- tigation of the anti-pronation effect of two tap- ing methods after application and exercise. Gait Posture. 1997;5(1):1-5.
Vicenzino B, Griffiths SR, Griffiths LA, et al. Effect of antipronation tape and temporary orthotic on vertical navicular height before and after exercise. J Orthop Sports Phys Ther. 2000;30(6):
333-339.
Vinicombe A, Raspovic A, Menz HB. Reliability of navicular displacement measurement as a clinical indicator of foot posture. J Am Podiatr Med Assoc. 2001;91(5):262-268.
Vidmar G, Novak P. Reliability of in-shoe plantar pressure measurements in rheumatoid arthritis patients. Int J Rehabil Res. 2009;32(1):36-40.
http://dx.doi.org/10.1097/MRR.0b013e328307bdc2 Whitaker JM, Augustus K, Ishii S. Effect of the
low-dye strap on pronation-sensitive mechanical attributes of the foot. J Am Podiatr Med Assoc.
2003;93(2):118-123.
This article was received January 26, 2015, was reviewed January 26, 2015, and was accepted February 26, 2015.